. 2020 Nov 3;9(11):2408.
doi: 10.3390/cells9112408.

Characterization of Mutational Status, Spheroid Formation, and Drug Response of a New Genomically-Stable Human Ovarian Clear Cell Carcinoma Cell Line, 105C

Affiliations

Characterization of Mutational Status, Spheroid Formation, and Drug Response of a New Genomically-Stable Human Ovarian Clear Cell Carcinoma Cell Line, 105C

Bart Kolendowski et al. Cells. .

Abstract

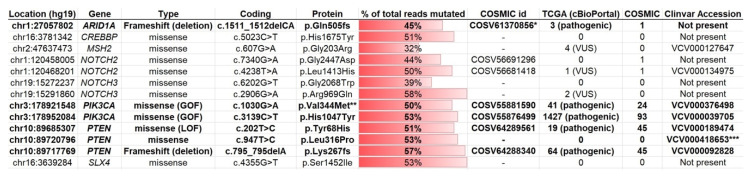
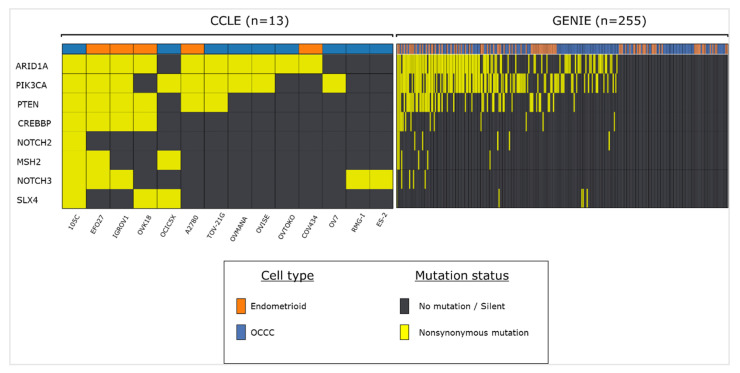
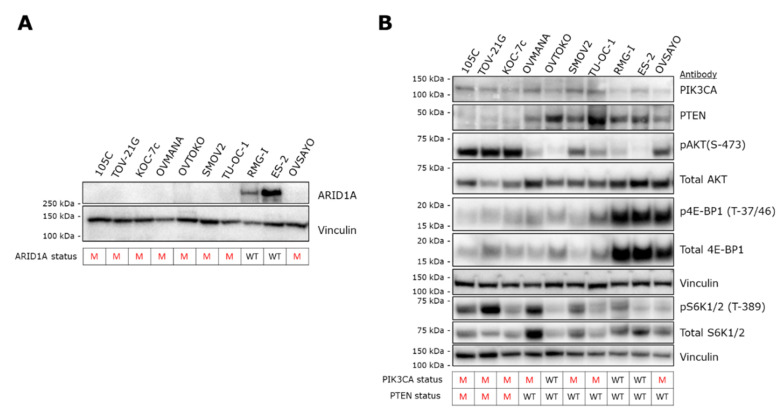
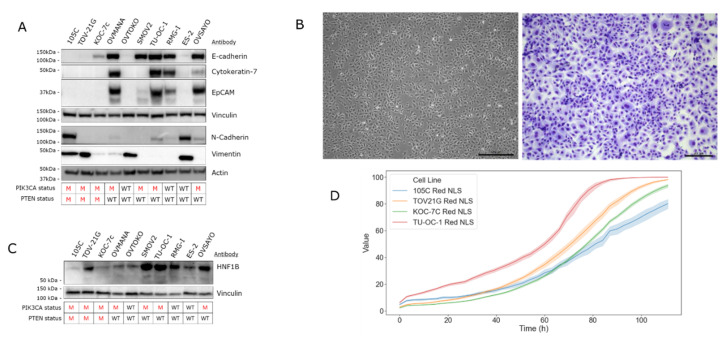
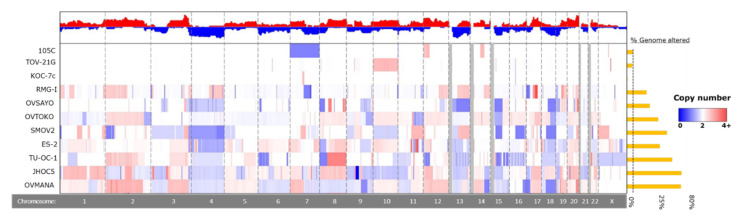
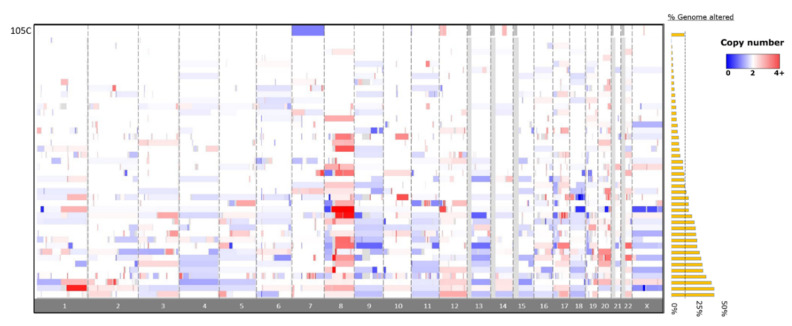
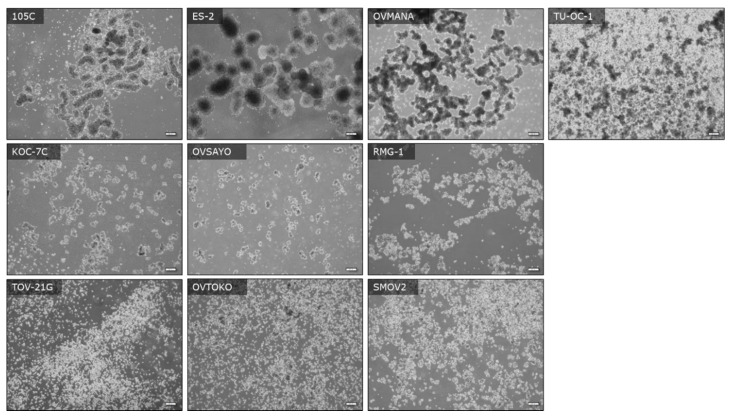
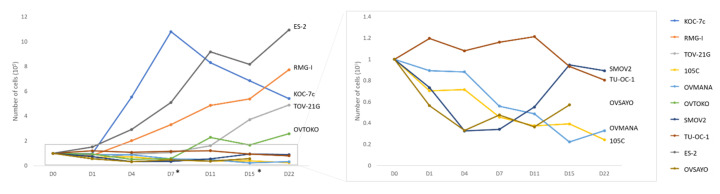
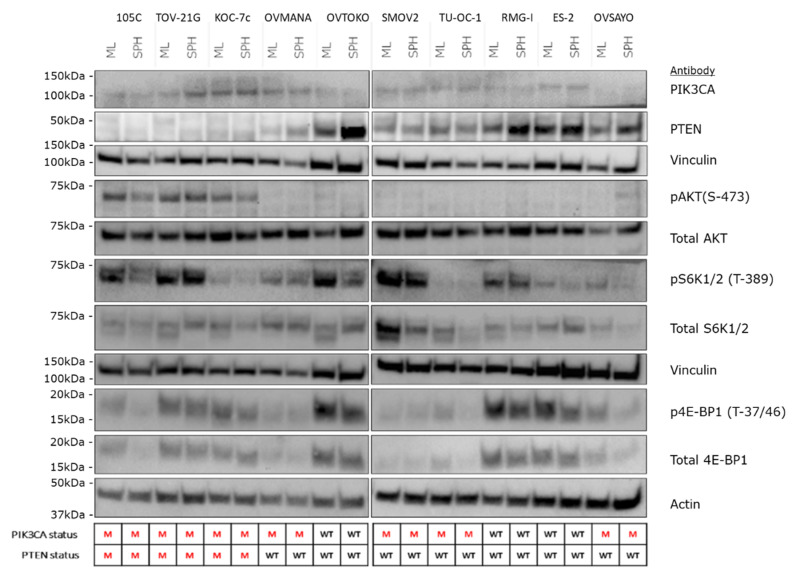
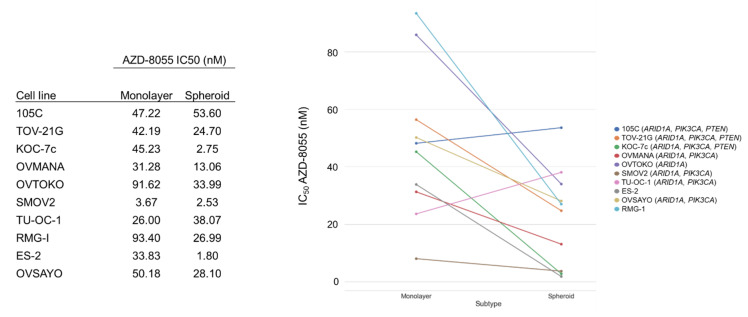
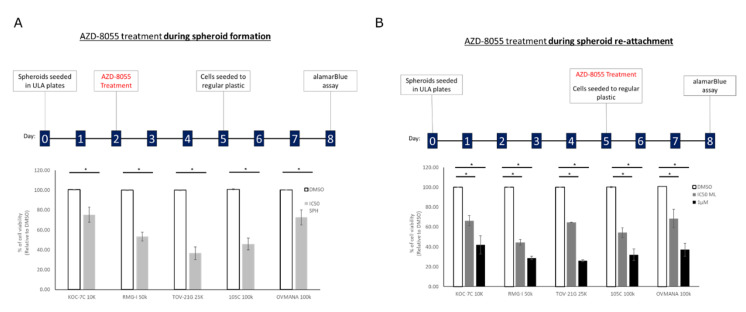
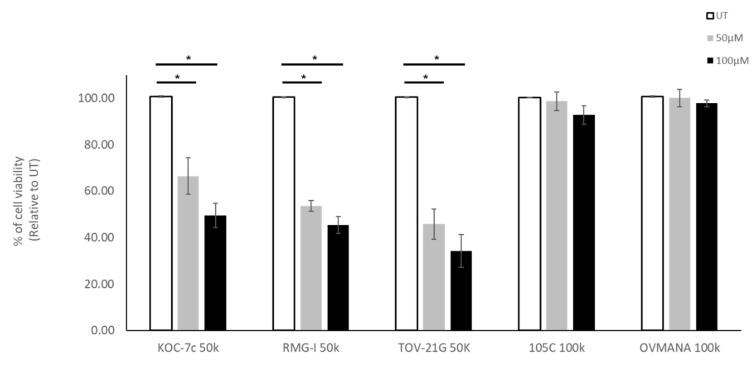
Ovarian clear cell carcinoma (OCCC) is a rare subtype of gynecological cancer for which well-characterized and authenticated model systems are scarce. We provide an extensive characterization of '105C', a cell line generated from an adenocarcinoma of the clear cell histotype using targeted next-generation sequencing, cytogenetic microarrays, along with analyses of AKT/mTOR signaling. We report that that the 105C cell line is a bona fide OCCC cell line, carrying PIK3CA, PTEN, and ARID1A gene mutations, consistent with OCCC, yet maintain a stable genome as reflected by low copy number variation. Unlike KOC-7c, TOV-21G, and RMG-V OCCC lines also mutated for the above genes, the 105C cells do not carry mutations in mismatch repair genes. Importantly, we show that 105C cells exhibit greater resistance to mTOR inhibition and carboplatin treatment compared to 9 other OCCC cell lines in 3D spheroid cultures. This resistance may be attributed to 105C cells remaining dormant in suspension culture which surprisingly, contrasts with several other OCCC lines which continue to proliferate in long-term suspension culture. 105C cells survive xenotransplantation but do not proliferate and metastasize. Collectively, we show that the 105C OCCC cell line exhibits unique properties useful for the pre-clinical investigation of OCCC pathobiology.

Keywords: OCCC; cancer; cell line; clear cell; epithelial ovarian cancer; mTOR inhibitor; ovarian; spheroid.


Conflict of interest statement

The authors declare no conflict of interest.

Figures

Figure 1
Figure 1
Genes mutated in the 105C cell line. Targeted sequencing of 161 cancer-driver genes was performed using the Oncomine v3 assay in the 105C cell line. The horizontal red bar provides a measure of the mutated gene allele frequency with the exact value in the middle of each bar. The gene mutations known to be deleterious to protein function are in bolded text. Mutations were filtered to exclude common SNPs and Minor Allele Frequency (MAF) > 0.01 and % of total reads mutated < 30%. *: This COSMIC id for ARID1A describes a frameshift mutation that is similar, but not identical to, the mutation found in 105C. **: Identified as hotspot. ***: Identified as ‘likely pathogenic’ in macrocephaly/autism syndrome and Cowden syndrome 1. Type: “GOF”: Known to result in a gain of function: “LOF”: Known to result in loss of function. TCGA: indicates number of unique cases reported with the mutation; VUS: variant of unknown significance. COSMIC: indicates number of unique cases reported with the mutation in the COSMIC database. Clinvar: indicates whether the specific mutation has been annotated in this database. “VUS”: Variant of Unknown Significance.
Figure 2
Figure 2
Frequency of 105C cell line-related mutations in endometrioid and OCCC tumour samples and cell lines. Using publicly available datasets we assessed the mutational status of genes that we previously characterized as mutated in the 105C cell line. Cell line data was obtained using CCLE database and tumor sample information was obtained from the GENIE database.
Figure 3
Figure 3
Expression of gene products of NGS-detected mutated genes in OCCC cell lines. (A) Western blot analysis to assess the expression of ARID1A revealed no detectable signal from 105C cells as well as all the other OCCC cell lines that are mutated for ARID1A. In contrast, RMG-I and ES-2 cell lines, wildtype for ARID1A, produced an ARID1A band of the expected M.W. Vinculin was used as loading control. ARID1A mutation status is shown below the blots. M: mutant; WT: wildtype. (B) To determine the downstream effects of the PIK3CA and PTEN mutations in 105C cells in relation to 10 other OCCC cell lines, we performed western blot using antibodies targeting components of the AKT signaling pathway. Notably, cell lines containing both PIK3CA and PTEN mutations (105C, TOV-21G, and KOC-7c) show the highest level of pAKT (S-473). Vinculin was used as loading control. The PIK3CA and PTEN mutation status is shown below the blots. Densitometric quantification of western blot signals is provided in Supplementary Figure S1. M: mutant; WT: wildtype.
Figure 4
Figure 4
Molecular characterization of the 105C cell line. (A) Western blot analysis to assess the expression of mesenchymal and epithelial associated gene products was performed on the 105C cell line and nine other OCCC lines. The 105C cell line did not demonstrate detectable epithelial markers, but showed expression of the mesenchymal markers, N-cadherin and vimentin whereas OVMANA, SMOV-2, TU-OC-1, RMG-I, OVSAYO, and OVISE showed detectable expression of epithelial markers. (B) Imaging and staining of 105C cell line using Hema 3 reveals a cobblestone appearance. (C) Western blot of HNF1B abundance in the 105C cell line relative to OCCC cell lines. siRNA knockdown experiment of HNF1B mRNA was performed to verify western blot bands that corresponded to HNF1B. Vinculin and actin were used as loading controls. The PIK3CA and PTEN mutation status is shown below the blots. M: mutant; WT: wildtype. (D) Confluency of various OCCC cell lines was measured every 3 h for 111 h using the IncuCyte™ platform.
Figure 5
Figure 5
Chromosomal copy number alterations in 105C cell line compared to other OCCC cell lines. To identify copy number alterations in OCCC cell lines we assayed 105C, KOC-7c, SMOV-2, TU-OC-I, and OVSAYO using Cytoscan HD and obtained CNA publicly available data for TOV-21G, RMG-I, OVTOKO, ES-2, OVISE, OVMANA, and JHOC5 cell lines from the CCLE. Red indicates DNA amplification and blue indicates DNA deletion, with intensity of the color indicating degree of change, with darker colors reflecting higher levels of amplification/deletion. Chromosome identity is provided in the bottom row. Greyed-out areas are genomic regions left out of the analysis due to low coverage.
Figure 6
Figure 6
Copy number alterations in the 105C OCCC cell-line compared to patient tumors from the GENIE database. Copy number alterations in the 105C line are focal in nature and are primarily restricted to chromosome 7, 12, and 14 with an overall 8% change in genome integrity. The OCCC tumor CNA data (n = 43) indicates a wide variety of chromosomal changes showing between 0.1% and 46.7% of genome altered. Red indicates DNA amplification and blue indicates DNA deletion. Greyed-out areas are genomic regions left out of analysis due to low coverage.
Figure 7
Figure 7
Images of OCCC cell lines seeded to ULA plates showing the morphology of autonomously formed multicellular clusters (spheroids) and presence of single and dead cells at day-3 of culture. Cell lines were seeded to six-well ULA plates at a density of 500,000 cells per well and images were captured with an inverted Olympus microscope at the 72 h timepoint. Scale bars represent 200 μM.
Figure 8
Figure 8
Viability of OCCC cell lines cultured as spheroids in suspension. 100,000 cells were seeded in triplicate in 24-well ULA plates and cultured for up to 22 days. Trypan blue exclusion counting was performed at each time point and the total number of viable cells per well is shown for each cell line. While we found that a subset of OCCC cell lines (ES-2, RMG-I, KOC-7c, TOV-21G) proliferate in suspension culture, the majority of the OCCC cell lines including the 105C cells remained cytostatic or lost viability when maintained in suspension culture over the period of the assay. *: Fresh media added on D7 and D15.
Figure 9
Figure 9
Western blot analysis of AKT/mTOR signaling in OCCC cell lines cultured as adherent versus 72 h spheroid suspension culture. Major changes in the abundance of AKT/mTOR signaling components across all OCCC lines was not observed when they were cultured as spheroids in suspension. Changes in the relative levels of specific components of the pathway were observed as focal changes in specific cell lines. Vinculin and actin were used as loading controls. The PIK3CA and PTEN mutation status is shown below the blots. M: mutant; WT: wildtype.
Figure 10
Figure 10
OCCC cell line sensitivity to the mTORC1/2 inhibitor, AZD-8055, when cultured as monolayer versus spheroid suspensions. The cell lines were cultured as monolayers or spheroids in suspension for 48 h and then treated for 72 h with a range of AZD-8055 concentrations to determine the IC50 for each line. AlamarBlue was used to assess viability. 105C cells did not show an increase in sensitivity to mTOR inhibition in suspension cultures as occurred for most of the OCCC cell lines tested. Genes in brackets are mutated in the cell line.
Figure 11
Figure 11
AZD-8055 reduces OCCC cell line viability during spheroid formation and spheroid reattachment. (A) Cells were seeded into 24-well ULA plates for 48 h and then treated with DMSO, the AZD-8055 spheroid IC50 for each cell line respectively or 1 μM AZD-8055 for 72 h. Spheroids were then reattached for 72 h into 24-well regular tissue culture plastic at which point viability was assessed by alamarBlue assay. (B) Cells were seeded into 24-well ULA plates for 5 days. Spheroids were then treated at the time of reattachment into 24-well regular tissue culture plastic with DMSO, the AZD-8055 monolayer IC50 for each cell line respectively or 1 μM AZD-8055. 72 h after reattachment viability was assessed by alamarBlue assay. Viability data was normalized to DMSO-treated controls set to 100%. A one-way ANOVA with Tukey’s multiple comparisons test was performed to determine statistical significance for each cell line (*, p < 0.05) (n = 3).
Figure 12
Figure 12
Effect of carboplatin treatment on OCCC cell lines in spheroid culture. Cells were seeded into 24-well ULA plates for 48 h and then treated with 50 μM or 100 μM of Carboplatin. Untreated cells were use as control cultures (UT). Trypan Blue Exclusion cell counting was performed 72 h after treatment. Viability data was normalized to untreated controls set to 100%. A one-way ANOVA with Tukey’s multiple comparisons test were performed to identify statistically significant differences in cell viability for each cell line (*, p < 0.05) (n = 4).

Similar articles

Cited by

References

    1. Hermens M., van Altena A.M., Nieboer T.E., Schoot B.C., van Vliet H.A.A.M., Siebers A.G., Bekkers R.L.M. Incidence of endometrioid and clear-cell ovarian cancer in histological proven endometriosis: The ENOCA population-based cohort study. Am. J. Obstet. Gynecol. 2020;223:107.e1–107.e11. doi: 10.1016/j.ajog.2020.01.041. - DOI - PubMed
    1. Köbel M., Kalloger S.E., Huntsman D.G., Santos J.L., Swenerton K.D., Seidman J.D., Gilks C.B., Cheryl B. Ovarian Cancer Outcomes Unit of the British Columbia Cancer Agency VB. Differences in tumor type in low-stage versus high-stage ovarian carcinomas. Int. J. Gynecol. Pathol. 2010;29:203–211. doi: 10.1097/PGP.0b013e3181c042b6. - DOI - PubMed
    1. Wiegand K.C., Shah S.P., Al-Agha O.M., Zhao Y., Tse K., Zeng T., Senz J., McConechy M.K., Anglesio M.S., Kalloger S.E., et al. ARID1A mutations in endometriosis-associated ovarian carcinomas. N. Engl. J. Med. 2010;363:1532–1543. doi: 10.1056/NEJMoa1008433. - DOI - PMC - PubMed
    1. Anglesio M.S., Bashashati A., Wang Y.K., Senz J., Ha G., Yang W., Aniba M.R., Prentice L.M., Farahani H., Li C.H., et al. Multifocal endometriotic lesions associated with cancer are clonal and carry a high mutation burden. J. Pathol. 2015;236:201–209. doi: 10.1002/path.4516. - DOI - PMC - PubMed
    1. Anglesio M.S., Papadopoulos N., Ayhan A., Nazeran T.M., Noë M., Horlings H.M., Lum A., Jones S., Senz J., Seckin T., et al. Cancer-Associated Mutations in Endometriosis without Cancer. N. Engl. J. Med. 2017;376:1835–1848. doi: 10.1056/NEJMoa1614814. - DOI - PMC - PubMed

Publication types

MeSH terms

Substances