. 2020 Dec;17(6):644-653.
doi: 10.1177/1740774520944377. Epub 2020 Aug 16.

The DURATIONS randomised trial design: Estimation targets, analysis methods and operating characteristics

Affiliations

The DURATIONS randomised trial design: Estimation targets, analysis methods and operating characteristics

Matteo Quartagno et al. Clin Trials. 2020 Dec.

Abstract

Background: Designing trials to reduce treatment duration is important in several therapeutic areas, including tuberculosis and bacterial infections. We recently proposed a new randomised trial design to overcome some of the limitations of standard two-arm non-inferiority trials. This DURATIONS design involves randomising patients to a number of duration arms and modelling the so-called 'duration-response curve'. This article investigates the operating characteristics (type-1 and type-2 errors) of different statistical methods of drawing inference from the estimated curve.

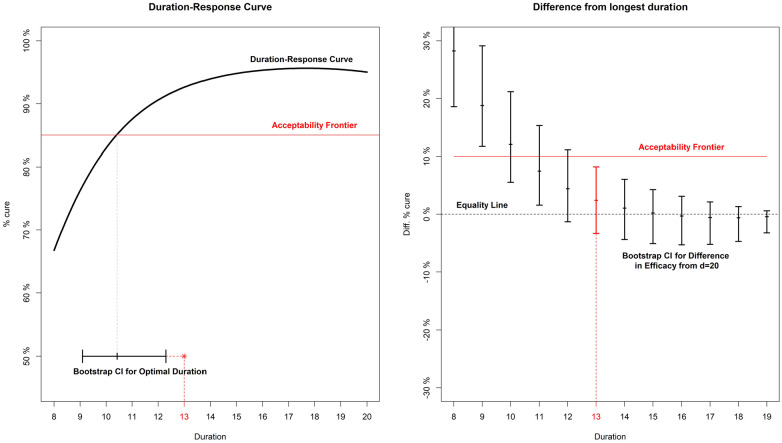
Methods: Our first estimation target is the shortest duration non-inferior to the control (maximum) duration within a specific risk difference margin. We compare different methods of estimating this quantity, including using model confidence bands, the delta method and bootstrap. We then explore the generalisability of results to estimation targets which focus on absolute event rates, risk ratio and gradient of the curve.

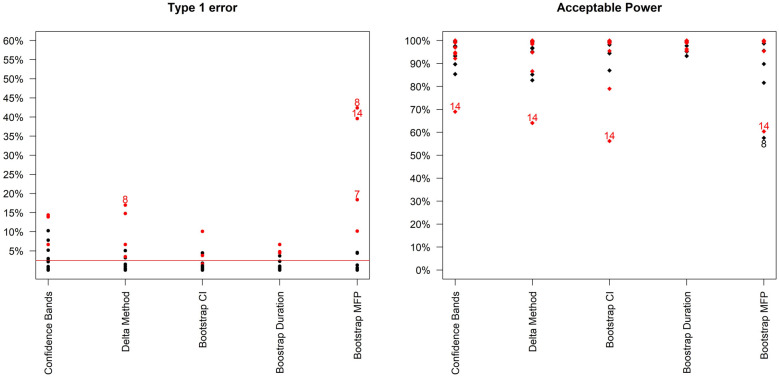
Results: We show through simulations that, in most scenarios and for most of the estimation targets, using the bootstrap to estimate variability around the target duration leads to good results for DURATIONS design-appropriate quantities analogous to power and type-1 error. Using model confidence bands is not recommended, while the delta method leads to inflated type-1 error in some scenarios, particularly when the optimal duration is very close to one of the randomised durations.

Conclusions: Using the bootstrap to estimate the optimal duration in a DURATIONS design has good operating characteristics in a wide range of scenarios and can be used with confidence by researchers wishing to design a DURATIONS trial to reduce treatment duration. Uncertainty around several different targets can be estimated with this bootstrap approach.

Keywords: Durations; estimand; estimation methods; operating characteristics.


Conflict of interest statement

Declaration of conflicting interests: The author(s) declared no potential conflicts of interest with respect to the research, authorship, and/or publication of this article.

Figures

Figure 1.
Figure 1.
Example of estimated duration-response curve(solid, black), drawn against three possible non-inferiority margins or ‘acceptability frontiers’ (dotted, red = 10% fixed risk difference; dashed, blue = 5% fixed risk difference; solid, grey = duration-specific acceptability frontier).
Figure 2.
Figure 2.
Type-1 error and acceptable power (probability of recommending any sufficiently effective shorter duration) of the 5 analysis methods across the 16 simulation scenarios. Bootstrap MFP uses the Bootstrap duration CI method, but using the standard fractional polynomial approach as the analysis method (as in R package mfp). Scenarios leading to type 1 error > 15% or Acceptable Power < 70% are indexed. In addition, scenarios where the curvature is positive at the optimal duration are in red.
Figure 3.
Figure 3.
Duration recommended and associated cure rate across the 16 simulation scenarios using the Bootstrap duration CI method, with base-case design parameters (estimation target = shortest duration non-inferior to 20 days within 10% risk difference). The vertical bar indicates the true minimum effective duration.
Figure 4.
Figure 4.
Analysis example for a hypothetical trial. On the left panel, the duration-response curve is estimated and then a bootstrap CI is built around the point where it crosses the acceptability frontier. On the right panel, bootstrap CIs are built around the difference in efficacy (cure rate) between each arm and the longest (d = 20).

References

    1. LLewelyn MJ, Fitzpatrick JM, Darwin E, et al. The antibiotic course has had its day. BMJ 2017; 358: j3418. - PubMed
    1. Quartagno M, Walker AS, Carpenter JR, et al. Rethinking non-inferiority: a practical trial design for optimising treatment duration. Clin Trials 2018; 15(5): 477–488. - PMC - PubMed
    1. Rehal S, Morris TP, Fielding K, et al. Non-inferiority trials: are they inferior? A systematic review of reporting in major medical journals. BMJ Open 2016; 6(10): 012594. - PMC - PubMed
    1. Pouwels KB, Yin M, Butler CC, et al. Optimising trial designs to identify appropriate antibiotic treatment durations. BMC Med 2019; 17: 1–7. - PMC - PubMed
    1. Royston P, Ambler G, Sauerbrei W. The use of fractional polynomials to model continuous risk variables in epidemiology. Int J Epidemiol 1999; 28(5): 964–974. - PubMed

Publication types

LinkOut - more resources