. 2020 Nov 5;17(1):329.
doi: 10.1186/s12974-020-01987-y.

Sestrin2 regulates microglia polarization through mTOR-mediated autophagic flux to attenuate inflammation during experimental brain ischemia

Affiliations

Sestrin2 regulates microglia polarization through mTOR-mediated autophagic flux to attenuate inflammation during experimental brain ischemia

Tingting He et al. J Neuroinflammation. .

Abstract

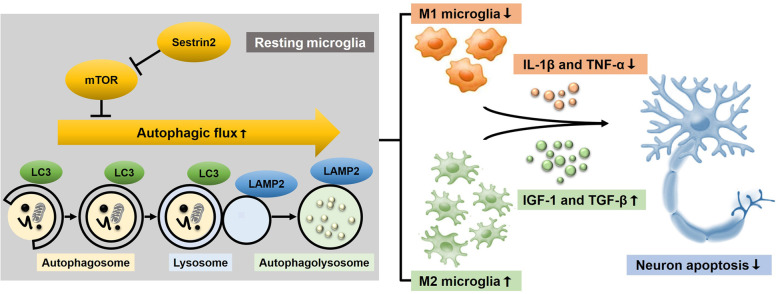
Background: Neuroinflammation is the major pathogenesis of cerebral ischemia. Microglia are activated and polarized to either the pro-inflammatory M1 phenotype or anti-inflammatory M2 phenotype, which act as a critical mediator of neuroinflammation. Sestrin2 has pro-survival properties against ischemic brain injury. However, whether sestrin2 has an anti-inflammatory function by shifting microglia polarization and its underlying mechanism is unknown.

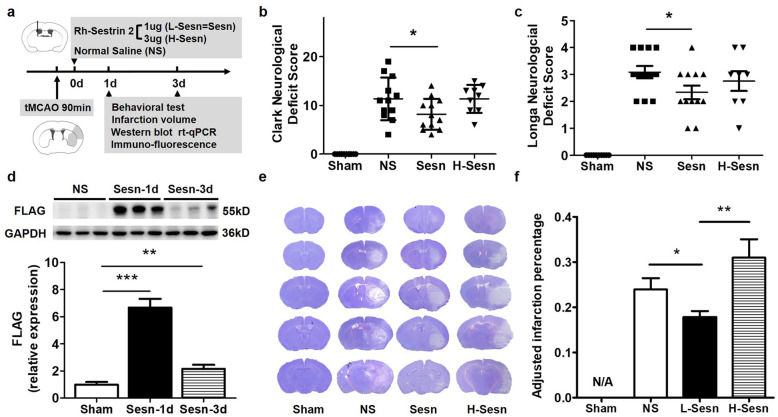
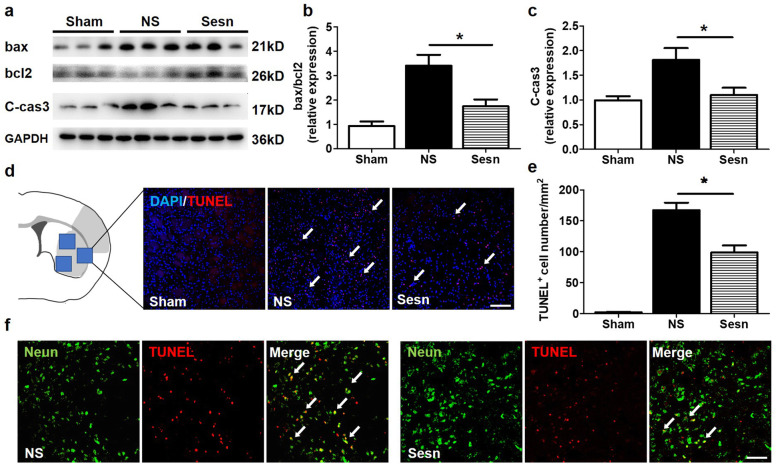
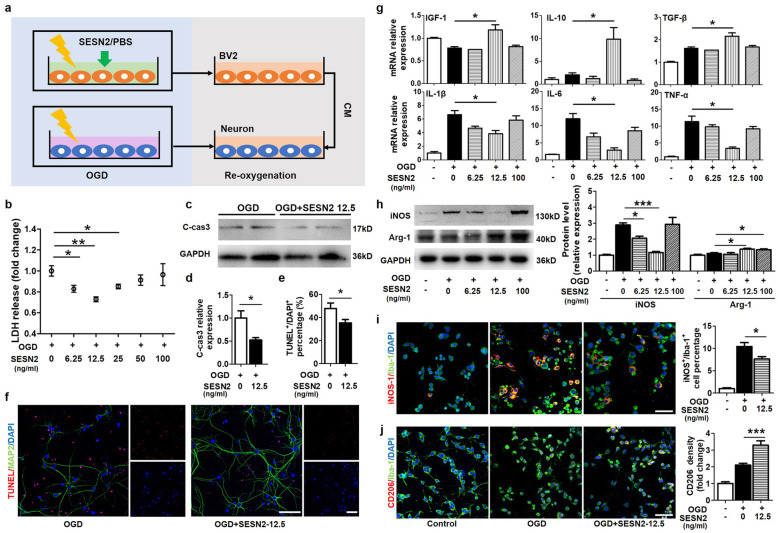
Methods: Adult male C57BL/6 mice (N = 108) underwent transient middle cerebral artery occlusion (tMCAO) and were treated with exogenous sestrin2. Neurological deficit scores and infarct volume were determined. Cell apoptosis was examined by TUNEL staining and Western blotting. The expression of inflammatory mediators, M1/M2-specific markers, and signaling pathways were detected by reverse transcription-polymerase chain reaction, immunostaining, and Western blotting. To explore the underlying mechanism, primary neurons were subjected to oxygen-glucose deprivation (OGD) and then treated with oxygenated condition medium of BV2 cells incubated with different doses of sestrin2.

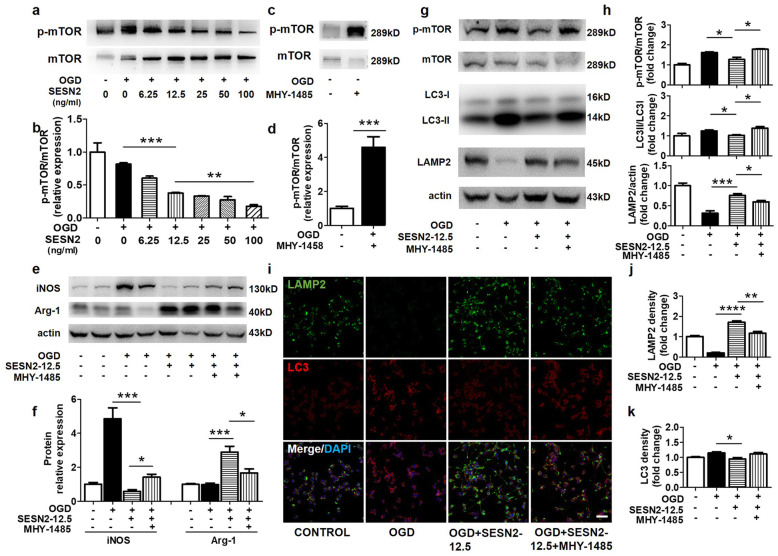
Results: Sestrin2 attenuated the neurological deficits, infarction volume, and cell apoptosis after tMCAO compared to those in the control (p < 0.05). Sestrin2 had an anti-inflammatory effect and could suppress M1 microglia polarization and promote M2 microglia polarization. Condition medium from BV2 cells cultured with sestrin2 reduced neuronal apoptosis after OGD in vitro. Furthermore, we demonstrated that sestrin2 drives microglia to the M2 phenotype by inhibiting the mammalian target of rapamycin (mTOR) signaling pathway and restoring autophagic flux.

Conclusions: Sestrin2 exhibited neuroprotection by shifting microglia polarization from the M1 to M2 phenotype in ischemic mouse brain, which may be due to suppression of the mTOR signaling pathway and the restoration of autophagic flux.

Keywords: Autophagic flux; Inflammation; Ischemia; Microglia; mTOR.


Conflict of interest statement

The authors declare no potential conflicts of interest in relation to this study.

Figures

Fig. 1
Fig. 1
Sestrin2 improved neurological functional recovery after tMCAO. a The timeline of the experimental protocol. b, c Bar graphs show the results of Clark and Longa neurological deficit scores at 1 day after tMCAO in Sham, NS, Sesn, and H-sesn groups. N = 10 per group. Data are presented as mean ± SEM, *p < 0.01, NS vs. Sesn. d Western blot and the quantification of FLAG-tagged sestrin2 expression in the Sesn-1dai and Sesn-3day groups. N = 3 per group. Data are presented as mean ± SEM, ***p < 0.001, NS vs. Sesn-1d, **p < 0.01, NS vs. Sesn-3d. e Representative images for cresyl violet staining of brain slices at 1day after tMCAO. f Quantification of adjusted infarction percentage based on the results of cresyl violet staining. N/A = not applicable. N = 10 per group. Data are presented as mean ± SEM, *p < 0.05, NS vs. Sesn, **p < 0.01, Sesn vs. H-Sesn
Fig. 2
Fig. 2
Sestrin2 reduced cell apoptosis after tMCAO. ac Western blot and quantification analysis show the expression of bax, bcl2, and cleaved caspase3 in Sham, NS, and Sesn group at 3 days after tMCAO. C-cas3 = cleaved caspase3. N = 4–5 per group. Data are presented as mean ± SEM, *p < 0.05, NS vs. Sesn. d, e TUNEL staining and bar graph show the number of TUNEL+ (red) cells in NS and Sesn groups 1 day after tMCAO. White arrows point at TUNEL+/DAPI+ cells. Scale bar = 100 μm. N = 5 per group. Data are presented as mean ± SEM, *p < 0.05, NS vs. Sesn. f Representative photos of TUNEL+/Neun+ cells in NS and Sesn groups. White arrows point at TUNEL+/Neun+ cells. Scale bar = 50 μm
Fig. 3
Fig. 3
Sestrin2 reduced microglia activation and promoted M2 phenotype polarization after tMCAO. a Representative images of Iba-1 in the ipsilateral hemisphere of NS and Sesn groups. Scale bar = 200 μm. b Schematic diagram illustrating the peri-infarct area (green) and the photographed region (boxed areas) of immunostaining images for Iba-1. Scale bar = 100 μm. c Quantification of Iba-1 relative density in NS and Sesn groups. N = 4 per group. d Western blot and quantification analysis show the expression of iNOS, CD206, and Arginase-1 in Sham, NS, and Sesn group at 3 days after tMCAO. N = 4–5 per group. Arg-1 = Arginase-1. e, f The results of the real-time PCR show mRNA levels of IL-1β, IL-6, TNF-α, IGF-1, IL-10, and TGF-β in Sham, NS, and Sesn groups at 1 day and 3 days after tMCAO. N = 4–6 per group. g Immunostaining images of CD16/32 in the ipsilateral hemisphere, white dotted lines show borderlines of ipsilateral hemisphere. V = ventricular. Scale bar = 400 μm. h Immunostaining images of CD16/32 (green) and Iba-1 (red) in NS and Sesn group. White arrows point at CD16/32+/Iba-1+ cells. Scale bar = 200 μm. i Quantification of CD16/32 fluorescent intensity and CD16/32+/Iba-1+ cell number in NS and Sesn groups. N = 4 per group. j Immunostaining images of Arginase-1 in ipsilateral hemisphere, white dotted lines show borderlines of ipsilateral hemisphere. V = ventricular. Arg-1 = Arginase 1. Scale bar = 400 μm. k Immunostaining of Arginase-1 (green) and Iba-1 (red) in NS and Sesn group. White arrows point at Arginase-1+/Iba-1+ cells. Scale bar = 50 μm. l Quantification of Arginase-1 fluorescent intensity and Arginase-1+/Iba-1+ cell number in NS and Sesn groups. Arg-1 = Arginase-1. Data are presented as mean ± SEM, *p < 0.05, **p < 0.01, ***p < 0.001
Fig. 4
Fig. 4
Sestrin2 promotes microglial polarization to M2 phenotype to exert neuroprotection after oxygen and glucose deprivation and re-oxygenation. a Diagram of the in vitro experimental design. SESN2 Sestrin2, PBS phosphate buffer saline, CM condition medium. b LDH assay showing death of neurons treated with conditioned medium from OGD-treated BV2 cells supplemented with different doses of sestrin2. c, d Western blot and quantification for cleaved caspase3 in neurons of two groups treated with conditioned medium from BV2 cells culture under OGD conditions or with conditioned medium from OGD-treated cells supplemented with 12.5 ng/ml sestrin2 (OGD + SESN 12.5). C-cas3 cleaved caspase3. e, f Immunostaining images of TUNEL (red), MAP2 (green), and DAPI (blue) in OGD and OGD + SESN 12.5 groups. Scale bar = 50 μm. The bar graph shows the percentage of TUNEL+ cells/ DAPI+ cells. g The results of the real-time PCR show the mRNA levels of the pro-inflammatory mediators IL-1β, IL-6, and TNF-α and anti-inflammatory mediators IGF-1, IL-10, and TGF-β in BV2 cells treated after OGD with 6.25–100 ng/ml sestrin2 and NS. h Western blot and quantification analysis show the expression of M1-related marker (iNOS) and M1-related marker (Arginase-1) in BV2 cells treated after OGD with 6.25–100 ng/ml sestrin2 and NS. i Immunostaining images of M1 related marker iNOS (red), Iba-1 (green), and DAPI (blue) in control, OGD and OGD + SESN 12.5 groups. Scale bar = 50 μm. Quantification of iNOS+ cell number and its percentage to Iba-1+ cell number in OGD and OGD+SESN 12.5 groups. j Immunostaining for the M2-related marker CD206 (red), Iba-1 (green) and DAPI (blue) of cells in control, OGD, and OGD + SESN 12.5 groups. Scale bar = 50 μm. Quantification of CD206+ cell number and its relative density in OGD and OGD + SESN 12.5 group. N = 4–6 per group. Data are presented as mean ± SEM, *p < 0.05, **p < 0.01, ***p < 0.001
Fig. 5
Fig. 5
Sestrin2 induced microglial M2 polarization by inhibiting mTOR signaling and restoring autophagic flux. a, b Western blot and the quantification for p-mTOR and mTOR in OGD/R treated BV2 cells supplemented with different doses of sestrin2. c, d Western blot and the quantification for p-mTOR and mTOR in OGD treated BV2 cells supplemented with or without MHY-1485. e, f Western blot and the quantification for iNOS and Arginase-1 in OGD treated BV2 cells supplemented with different doses of sestrin2 and MHY-1485. Arg-1 Arginase-1. g, h Western blot and the quantification for p-mTOR/mTOR, LC3II/LC3I, LAMP2/actin in control, OGD, OGD + SESN2, and OGD + SESN2 + MHY-1485 groups. i Immunostaining images for LAMP2 (green) and LC3 (red) of BV2 cells in control, OGD, OGD + SESN2, and OGD + SESN2 + MHY-1485 groups. Scale bar = 25 μm. j, k Quantification of LAMP2 and LC3 relative density in control, OGD, OGD + SESN2, and OGD + SESN2 + MHY-1485 groups. N = 4–6 per group. Data are presented as mean ± SEM, *p < 0.05, **p < 0.01, ***p < 0.001
Fig. 6
Fig. 6
Schematic of the neuroprotective role of sestrin2. After ischemia/hypoxia, sestrin2 promoted microglial polarization to M2 phenotype by restoring autophagic flux through mTOR pathway inhibition to prevent neuronal apoptosis

References

    1. He J, Gu D, Wu X, Reynolds K, Duan X, Yao C, et al. Major causes of death among men and women in China. N Engl J Med. 2005;353:1124–1134. doi: 10.1056/NEJMsa050467. - DOI - PubMed
    1. Zhou M, Wang H, Zhu J, Chen W, Wang L, Liu S, et al. Cause-specific mortality for 240 causes in China during 1990-2013: a systematic subnational analysis for the global burden of disease study 2013. Lancet. 2016;387:251–272. doi: 10.1016/S0140-6736(15)00551-6. - DOI - PubMed
    1. Gauberti M, Lapergue B, Martinez de Lizarrondo S, Vivien D, Richard S, Bracard S, et al. Ischemia-reperfusion injury after endovascular thrombectomy for ischemic stroke. Stroke. 2018;49:3071–3074. doi: 10.1161/STROKEAHA.118.022015. - DOI - PubMed
    1. Khatri R, McKinney AM, Swenson B, Janardhan V. Blood-brain barrier, reperfusion injury, and hemorrhagic transformation in acute ischemic stroke. Neurology. 2012;79:S52–S57. doi: 10.1212/WNL.0b013e3182697e70. - DOI - PubMed
    1. Rock KL, Latz E, Ontiveros F, Kono H. The sterile inflammatory response. Annu Rev Immunol. 2010;28:321–342. doi: 10.1146/annurev-immunol-030409-101311. - DOI - PMC - PubMed

MeSH terms

LinkOut - more resources