

Investigating transcriptome-wide sex dimorphism by multi-level analysis of single-cell RNA sequencing data in ten mouse cell types
- PMID: 33153500
- PMCID: PMC7643324
- DOI: 10.1186/s13293-020-00335-2
Investigating transcriptome-wide sex dimorphism by multi-level analysis of single-cell RNA sequencing data in ten mouse cell types
Abstract
Background: It is a long established fact that sex is an important factor that influences the transcriptional regulatory processes of an organism. However, understanding sex-based differences in gene expression has been limited because existing studies typically sequence and analyze bulk tissue from female or male individuals. Such analyses average cell-specific gene expression levels where cell-to-cell variation can easily be concealed. We therefore sought to utilize data generated by the rapidly developing single cell RNA sequencing (scRNA-seq) technology to explore sex dimorphism and its functional consequences at the single cell level.
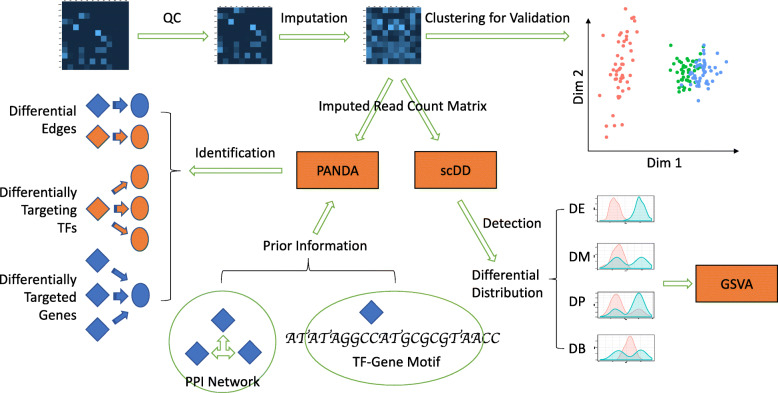
Methods: Our study included scRNA-seq data of ten well-defined cell types from the brain and heart of female and male young adult mice in the publicly available tissue atlas dataset, Tabula Muris. We combined standard differential expression analysis with the identification of differential distributions in single cell transcriptomes to test for sex-based gene expression differences in each cell type. The marker genes that had sex-specific inter-cellular changes in gene expression formed the basis for further characterization of the cellular functions that were differentially regulated between the female and male cells. We also inferred activities of transcription factor-driven gene regulatory networks by leveraging knowledge of multidimensional protein-to-genome and protein-to-protein interactions and analyzed pathways that were potential modulators of sex differentiation and dimorphism.
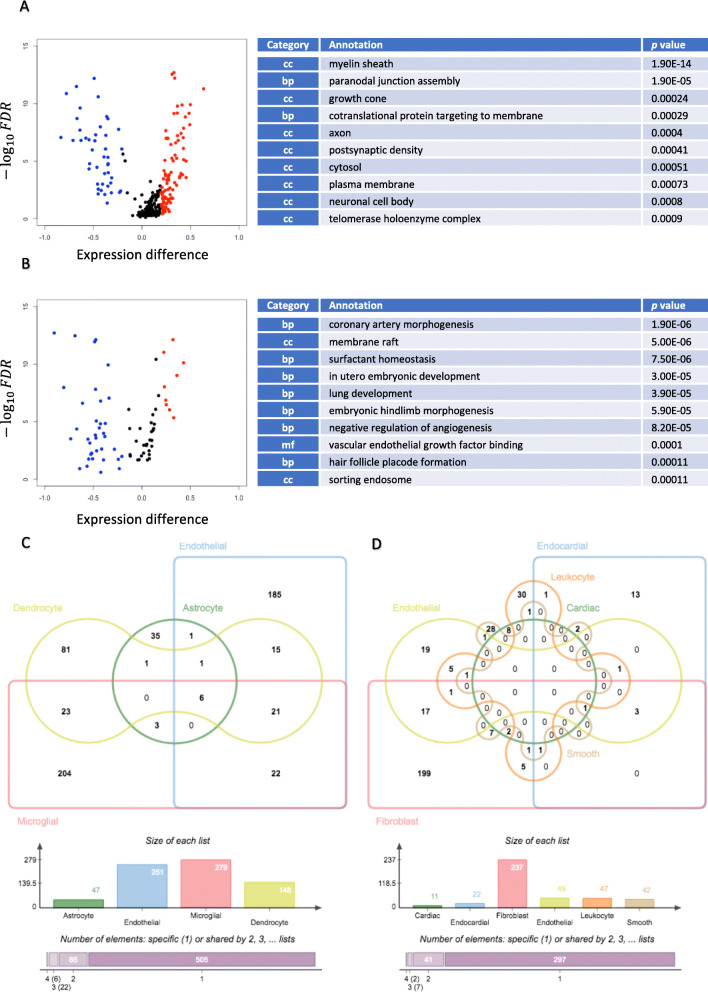
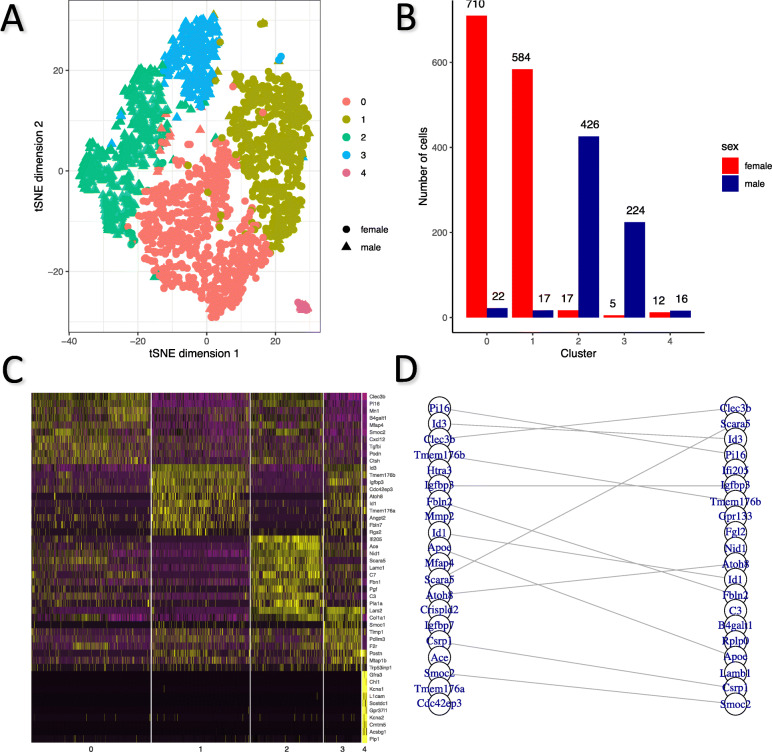
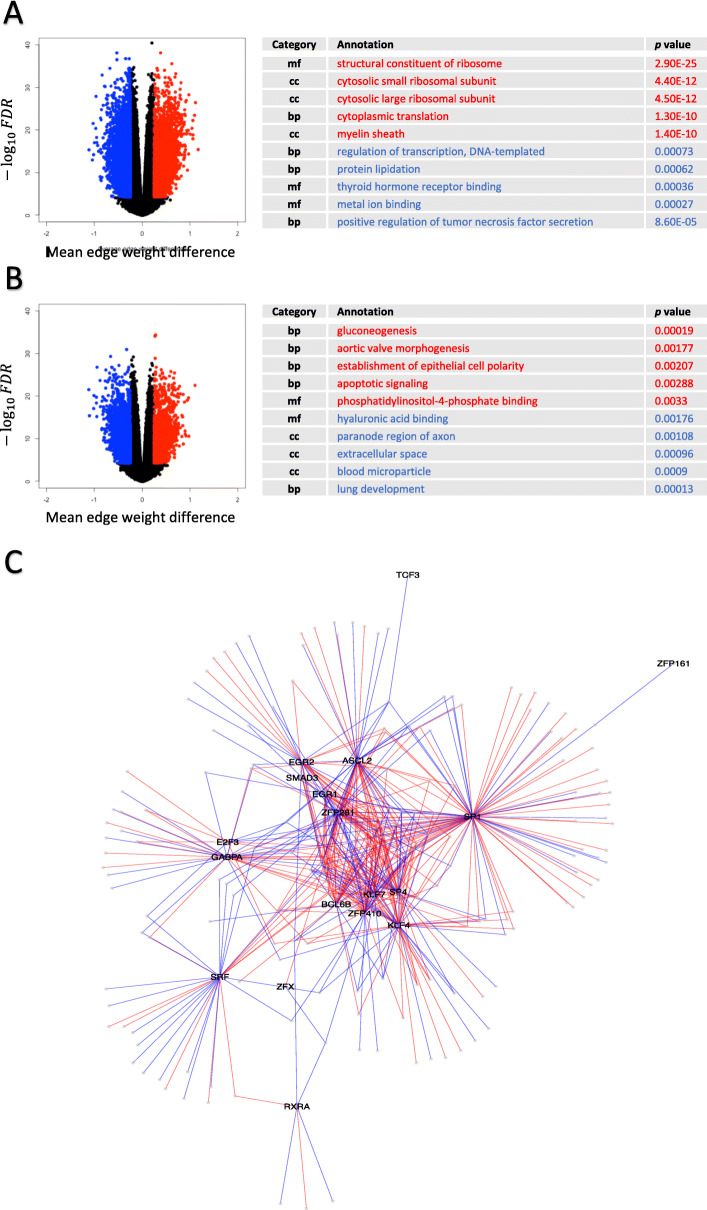
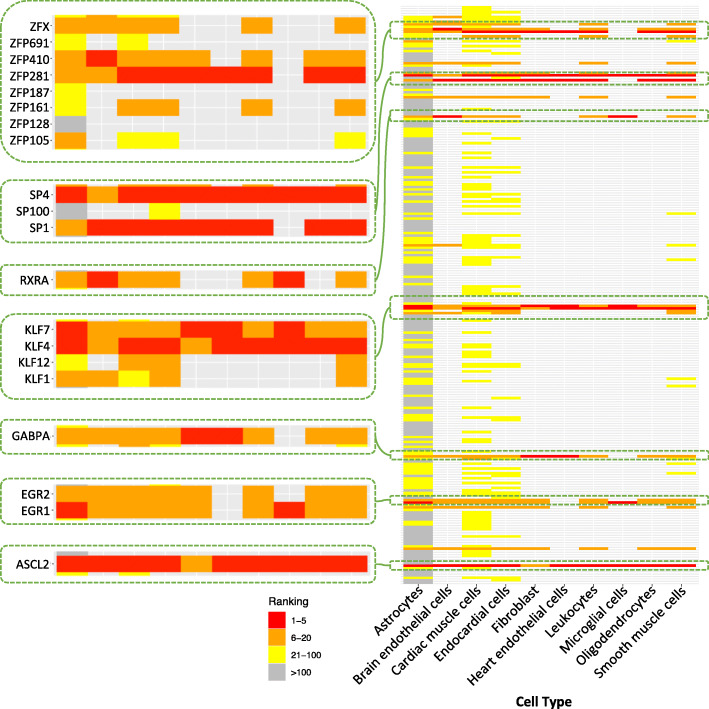
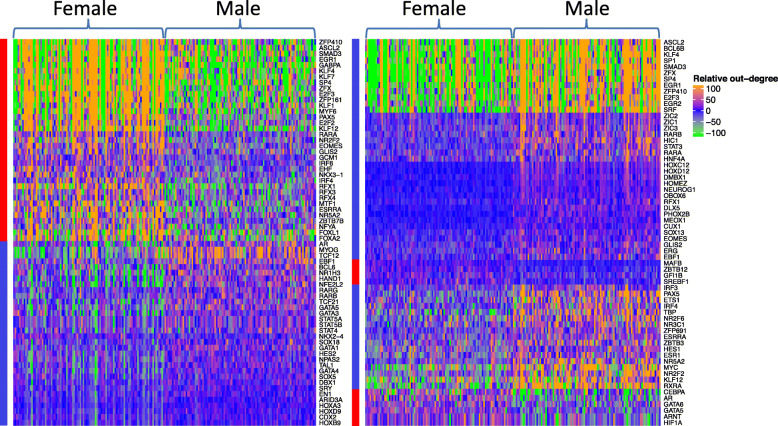
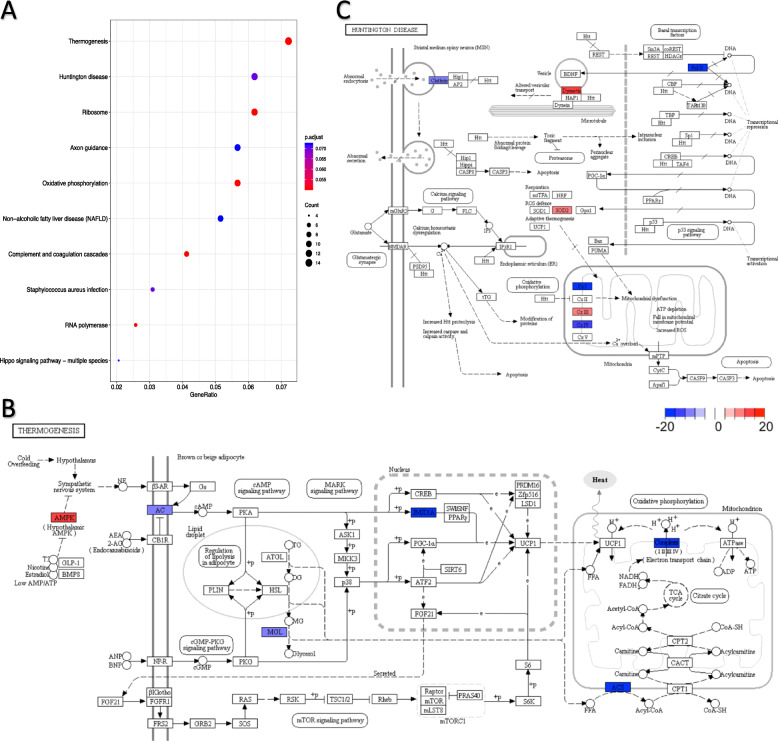
Results: For each cell type in this study, we identified marker genes with significantly different mean expression levels or inter-cellular distribution characteristics between female and male cells. These marker genes were enriched in pathways that were closely related to the biological functions of each cell type. We also identified sub-cell types that possibly carry out distinct biological functions that displayed discrepancies between female and male cells. Additionally, we found that while genes under differential transcriptional regulation exhibited strong cell type specificity, six core transcription factor families responsible for most sex-dimorphic transcriptional regulation activities were conserved across the cell types, including ASCL2, EGR, GABPA, KLF/SP, RXRα, and ZF.
Conclusions: We explored novel gene expression-based biomarkers, functional cell group compositions, and transcriptional regulatory networks associated with sex dimorphism with a novel computational pipeline. Our findings indicated that sex dimorphism might be widespread across the transcriptomes of cell types, cell type-specific, and impactful for regulating cellular activities.
Keywords: Cell cluster; Differential distribution; Differential expression; Pathway analysis; Sex dimorphism; Single cell RNA sequencing; Transcription regulatory network.
Conflict of interest statement
The authors declare that they have no competing interests.
Figures
Similar articles
-
Sex dimorphism and tissue specificity of gene expression changes in aging mice.Biol Sex Differ. 2024 Oct 31;15(1):89. doi: 10.1186/s13293-024-00666-4. Biol Sex Differ. 2024. PMID: 39482778 Free PMC article.
-
Single-Cell RNA Sequencing Unveils Unique Transcriptomic Signatures of Organ-Specific Endothelial Cells.Circulation. 2020 Nov 10;142(19):1848-1862. doi: 10.1161/CIRCULATIONAHA.119.041433. Epub 2020 Sep 15. Circulation. 2020. PMID: 32929989 Free PMC article.
-
Identification of KLF6/PSGs and NPY-Related USF2/CEACAM Transcriptional Regulatory Networks via Spinal Cord Bulk and Single-Cell RNA-Seq Analysis.Dis Markers. 2021 Nov 29;2021:2826609. doi: 10.1155/2021/2826609. eCollection 2021. Dis Markers. 2021. PMID: 34880956 Free PMC article.
-
Single-cell network biology for resolving cellular heterogeneity in human diseases.Exp Mol Med. 2020 Nov;52(11):1798-1808. doi: 10.1038/s12276-020-00528-0. Epub 2020 Nov 26. Exp Mol Med. 2020. PMID: 33244151 Free PMC article. Review.
-
A review on gene regulatory network reconstruction algorithms based on single cell RNA sequencing.Genes Genomics. 2024 Jan;46(1):1-11. doi: 10.1007/s13258-023-01473-8. Epub 2023 Nov 30. Genes Genomics. 2024. PMID: 38032470 Review.
Cited by
-
Single cell genomics as a transformative approach for aquaculture research and innovation.Rev Aquac. 2023 Sep;15(4):1618-1637. doi: 10.1111/raq.12806. Epub 2023 Mar 7. Rev Aquac. 2023. PMID: 38505116 Free PMC article. Review.
-
Matters of the heart: Cellular sex differences.J Mol Cell Cardiol. 2021 Nov;160:42-55. doi: 10.1016/j.yjmcc.2021.04.010. Epub 2021 Jun 22. J Mol Cell Cardiol. 2021. PMID: 34166708 Free PMC article. Review.
-
Deciphering the molecular landscape: evolutionary progression from gynecomastia to aggressive male breast cancer.Cell Oncol (Dordr). 2024 Oct;47(5):1831-1843. doi: 10.1007/s13402-024-00964-4. Epub 2024 Jun 18. Cell Oncol (Dordr). 2024. PMID: 38888848
-
Widespread sex dimorphism across single-cell transcriptomes of adult African turquoise killifish tissues.Cell Rep. 2023 Oct 31;42(10):113237. doi: 10.1016/j.celrep.2023.113237. Epub 2023 Oct 12. Cell Rep. 2023. PMID: 37837621 Free PMC article.
-
Sex-biased gene expression and gene-regulatory networks of sex-biased adverse event drug targets and drug metabolism genes.bioRxiv [Preprint]. 2023 Nov 15:2023.05.23.541950. doi: 10.1101/2023.05.23.541950. bioRxiv. 2023. Update in: BMC Pharmacol Toxicol. 2024 Jan 2;25(1):5. doi: 10.1186/s40360-023-00727-1. PMID: 37362157 Free PMC article. Updated. Preprint.
References
Publication types
MeSH terms
Grants and funding
LinkOut - more resources
Full Text Sources
