

Changing mortality trends in countries and cities of the UK: a population-based trend analysis
- PMID: 33154048
- PMCID: PMC7646340
- DOI: 10.1136/bmjopen-2020-038135
Changing mortality trends in countries and cities of the UK: a population-based trend analysis
Abstract
Objectives: Previously improving life expectancy and all-cause mortality in the UK has stalled since the early 2010s. National analyses have demonstrated changes in mortality rates for most age groups and causes of death, and with deprived populations most affected. The aims here were to establish whether similar changes have occurred across different parts of the UK (countries, cities), and to examine cause-specific trends in more detail.
Design: Population-based trend analysis.
Participants/setting: Whole populations of countries and selected cities of the UK.
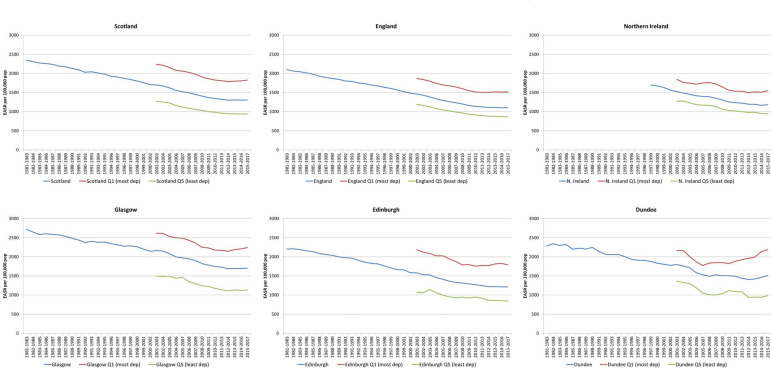
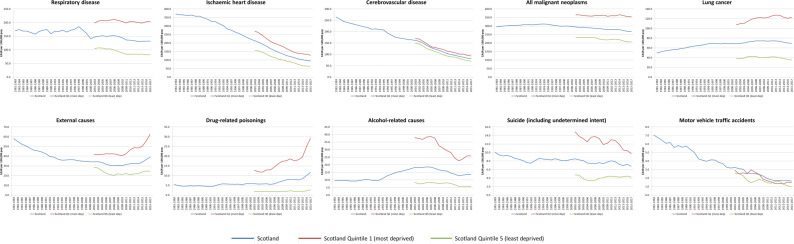
Primary and secondary outcome measures: European age-standardised mortality rates (calculated by cause of death, country, city, year (1981-2017), age group, sex and-for all countries and Scottish cities-deprivation quintiles); changes in rates between 5-year periods; summary measures of both relative (relative index of inequality) and absolute (slope index of inequality) inequalities.
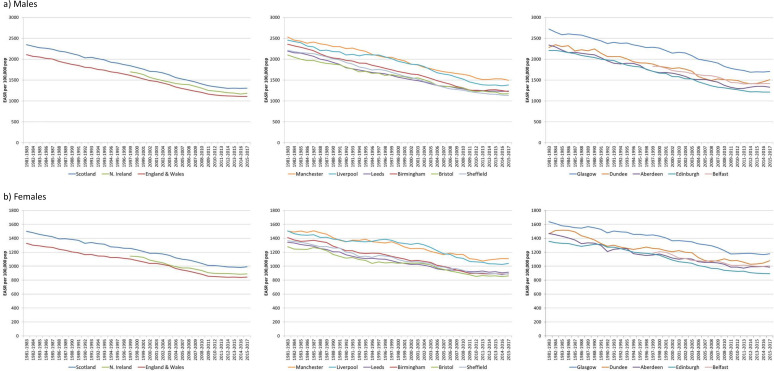
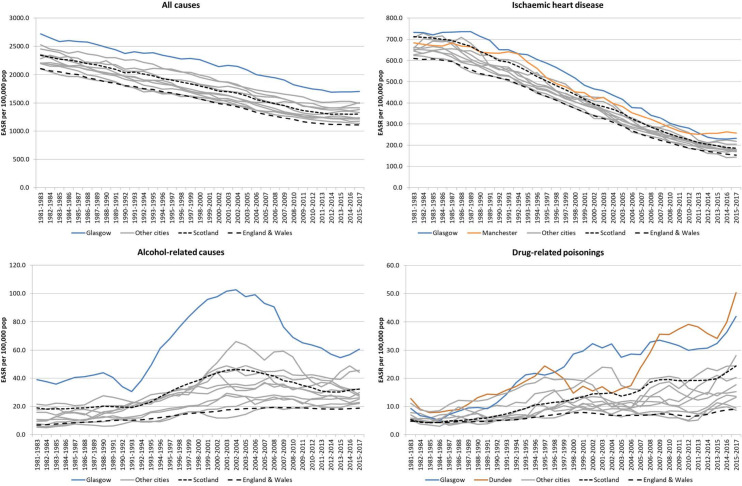
Results: Changes in mortality from around 2011/2013 were observed throughout the UK for all adult age groups. For example, all-age female rates decreased by approximately 4%-6% during the 1980s and 1990s, approximately 7%-9% during the 2000s, but by <1% between 2011/2013 and 2015/2017. Equivalent figures for men were 4%-7%, 8%-12% and 1%-3%, respectively. This later period saw increased mortality among the most deprived populations, something observed in all countries and cities analysed, and for most causes of death: absolute and relative inequalities therefore increased. Although similar trends were seen across all parts of the UK, particular issues apply in Scotland, for example, higher and increasing drug-related mortality (with the highest rates observed in Dundee and Glasgow).
Conclusions: The study presents further evidence of changing mortality in the UK. The timing, geography and socioeconomic gradients associated with the changes appear to support suggestions that they may result, at least in part, from UK Government 'austerity' measures which have disproportionately affected the poorest.
Keywords: epidemiology; public health; social medicine.
© Author(s) (or their employer(s)) 2020. Re-use permitted under CC BY-NC. No commercial re-use. See rights and permissions. Published by BMJ.
Conflict of interest statement
Competing interests: None declared.
Figures

References
-
- BBC Life expectancy progress in UK ‘stops for first time’, 2018. Available: https://www.bbc.co.uk/news/health-45638646
-
- BBC Scots’ life expectancy falls for first time in 35 years, 2018. Available: https://www.bbc.co.uk/news/uk-scotland-45636457
MeSH terms
LinkOut - more resources
Full Text Sources