

NAA is a Marker of Disability in Secondary-Progressive MS: A Proton MR Spectroscopic Imaging Study
- PMID: 33154071
- PMCID: PMC7963233
- DOI: 10.3174/ajnr.A6809
NAA is a Marker of Disability in Secondary-Progressive MS: A Proton MR Spectroscopic Imaging Study
Abstract
Background and purpose: The secondary progressive phase of multiple sclerosis is characterised by disability progression due to processes that lead to neurodegeneration. Surrogate markers such as those derived from MRI are beneficial in understanding the pathophysiology that drives disease progression and its relationship to clinical disability. We undertook a 1H-MRS imaging study in a large secondary progressive MS (SPMS) cohort, to examine whether metabolic markers of brain injury are associated with measures of disability, both physical and cognitive.
Materials and methods: A cross-sectional analysis of individuals with secondary-progressive MS was performed in 119 participants. They underwent 1H-MR spectroscopy to obtain estimated concentrations and ratios to total Cr for total NAA, mIns, Glx, and total Cho in normal-appearing WM and GM. Clinical outcome measures chosen were the following: Paced Auditory Serial Addition Test, Symbol Digit Modalities Test, Nine-Hole Peg Test, Timed 25-foot Walk Test, and the Expanded Disability Status Scale. The relationship between these neurometabolites and clinical disability measures was initially examined using Spearman rank correlations. Significant associations were then further analyzed in multiple regression models adjusting for age, sex, disease duration, T2 lesion load, normalized brain volume, and occurrence of relapses in 2 years preceding study entry.
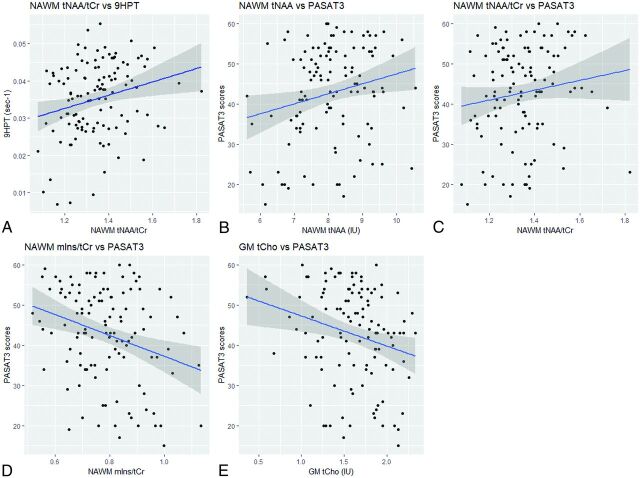
Results: Significant associations, which were then confirmed by multiple linear regression, were found in normal-appearing WM for total NAA (tNAA)/total Cr (tCr) and the Nine-Hole Peg Test (ρ = 0.23; 95% CI, 0.06-0.40); tNAA and tNAA/tCr and the Paced Auditory Serial Addition Test (ρ = 0.21; 95% CI, 0.03-0.38) (ρ = 0.19; 95% CI, 0.01-0.36); mIns/tCr and the Paced Auditory Serial Addition Test, (ρ = -0.23; 95% CI, -0.39 to -0.05); and in GM for tCho and the Paced Auditory Serial Addition Test (ρ = -0.24; 95% CI, -0.40 to -0.06). No other GM or normal-appearing WM relationships were found with any metabolite, with associations found during initial correlation testing losing significance after multiple linear regression analysis.
Conclusions: This study suggests that metabolic markers of neuroaxonal integrity and astrogliosis in normal-appearing WM and membrane turnover in GM may act as markers of disability in secondary-progressive MS.
© 2020 by American Journal of Neuroradiology.
Figures


References
Publication types
MeSH terms
Substances
Grants and funding
LinkOut - more resources
Full Text Sources
Medical