. 2020 Nov 6;370(6517):691-697.
doi: 10.1126/science.abd7672. Epub 2020 Sep 30.

Epidemiology and transmission dynamics of COVID-19 in two Indian states

Affiliations

Epidemiology and transmission dynamics of COVID-19 in two Indian states

Ramanan Laxminarayan et al. Science. .

Abstract

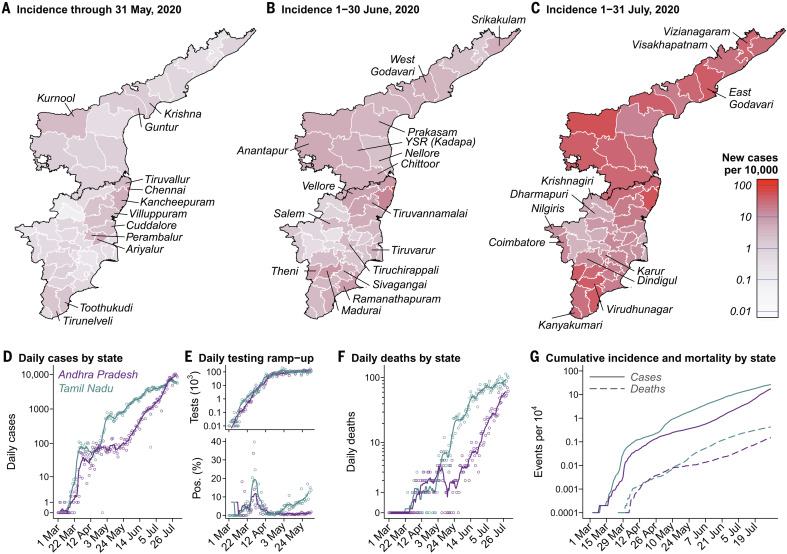
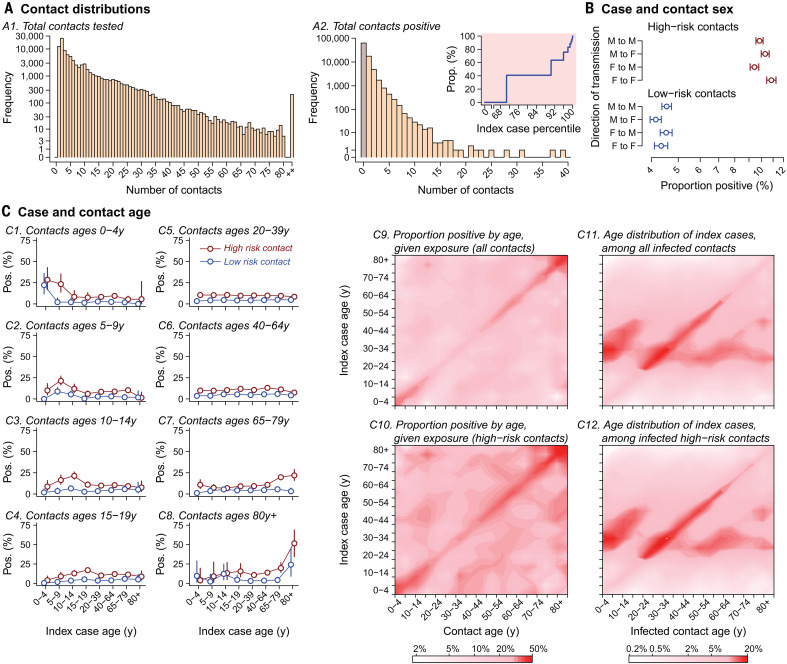
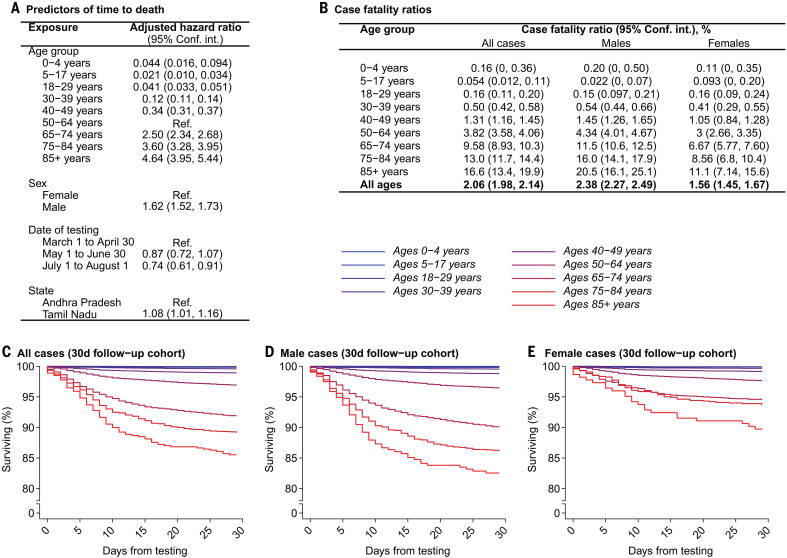
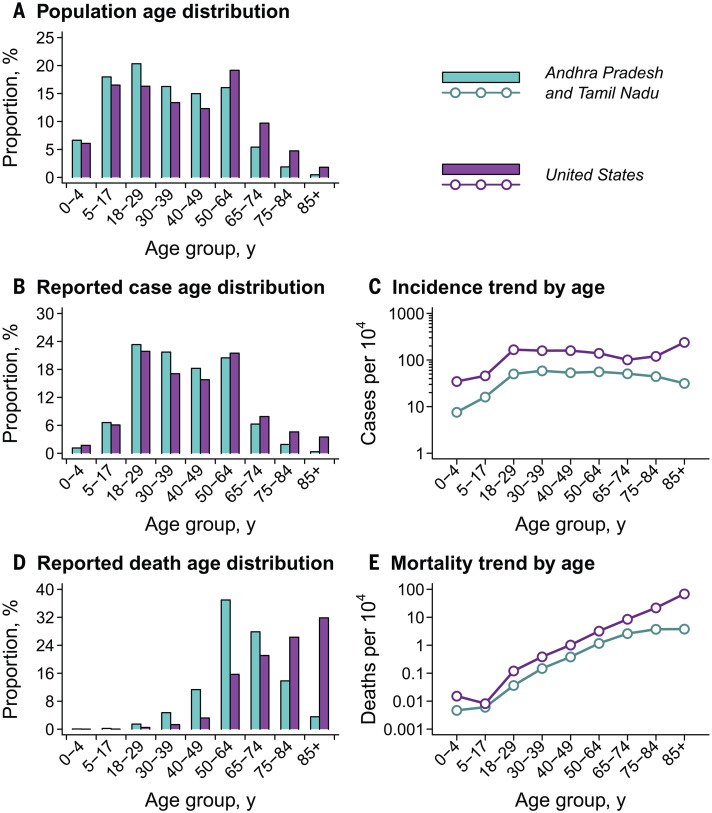
Although most cases of coronavirus disease 2019 (COVID-19) have occurred in low-resource countries, little is known about the epidemiology of the disease in such contexts. Data from the Indian states of Tamil Nadu and Andhra Pradesh provide a detailed view into severe acute respiratory syndrome coronavirus 2 (SARS-CoV-2) transmission pathways and mortality in a high-incidence setting. Reported cases and deaths have been concentrated in younger cohorts than would be expected from observations in higher-income countries, even after accounting for demographic differences across settings. Among 575,071 individuals exposed to 84,965 confirmed cases, infection probabilities ranged from 4.7 to 10.7% for low-risk and high-risk contact types, respectively. Same-age contacts were associated with the greatest infection risk. Case fatality ratios spanned 0.05% at ages of 5 to 17 years to 16.6% at ages of 85 years or more. Primary data from low-resource countries are urgently needed to guide control measures.


Figures

Fig. 1
Fig. 1. Incidence over time and across districts in Tamil Nadu and Andhra Pradesh.
(A to C) Red shading of regions on the choropleth map indicates higher incidence over each period: 1 March to 31 May 2020 (A), 1 to 30 June 2020 (B), and 1 to 31 July 2020 (C). Districts are plotted according to 2019 administrative boundaries and do not reflect the recent bifurcation of Tirunelveli, Villuppuram, Vellore, and Chengalpattu districts. (D) Cases detected each day in each state (points) and 7-day moving averages (lines). Cases are aggregated by testing date; data are plotted in blue and lavender for Tamil Nadu and Andhra Pradesh, respectively, for all figure panels. (E) Diagnostic tests conducted each day (top) and the proportion of tests yielding positive results (bottom) for the period March through May 2020, when districts reported comprehensive testing information to the state governments. Points and lines indicate daily counts and 7-day moving averages, respectively. The high proportion of positive tests from late March to mid-April, while case number remained relatively stable, may indicate a period during which cases were undercounted because of limited testing capacity. (F) Daily deaths in the two states. Points and lines indicate daily counts and 7-day moving averages, respectively. (G) Cumulative incidence (solid lines) and mortality (dashed lines) per 10,000 population.
Fig. 2
Fig. 2. Analyses of contact-tracing data for 575,071 tested contacts of 84,965 infected individuals from whom test results were available, together with individual-level detailed epidemiological data on exposed contacts and index cases.
(A) Left: Distribution of the number of contacts traced for each index case in Tamil Nadu and Andhra Pradesh, binning values ≥80 (0.2%). Right: Number of positive contacts traced from each index case. The inset shows the cumulative attributable proportion of secondary infections (y axis) associated with quantiles (x axis) of the distribution of the number of positive contacts traced per index case; percentiles 0 and 100 indicate index cases with the fewest and the most positive contacts identified, respectively. (B) Adjusted estimates from Poisson regression models addressing the proportion of female and male contacts with a positive result among those who were known to be exposed to female and male index cases; models further control for case and contact age groups (interacted) and for state. We stratify for high-risk and low-risk contacts, as defined in table S6. Points and lines indicate mean estimates and 95% confidence intervals. (C) Proportion of contacts with a positive test result stratified by case and contact age, for high-risk and low-risk contacts. At right, contour plots indicate the proportion of exposed contacts with a positive test result by case and contact age for all contacts and high-risk contacts on a choropleth scale; see table S8 for raw counts. Positive test results among tested, exposed contacts are interpreted as evidence of probable transmission from the index case. Also plotted are the age distributions of index cases for all infected contacts and for infected high-risk contacts.
Fig. 3
Fig. 3. Mortality among confirmed COVID-19 cases.
(A) Adjusted hazard ratios for mortality by 1 August 2020 estimated via Cox proportional hazards models including all confirmed cases. Exposures designated “Ref.” indicate the referent group for hazard ratio calculation. (B) Absolute case fatality risk estimates obtained via bootstrap resampling of individuals with confirmed infection by 1 July 2020. (C to E) Survival probabilities by age within this cohort over the 30-day period after testing, plotted for all cases (C), male cases (D), and female cases (E). Blue-to-red coloration aligns with younger-to-older age group, for strata as defined in the above tables. Age bins were selected on the basis of reporting of U.S. COVID-19 surveillance data (Fig. 4).
Fig. 4
Fig. 4. Demographic comparison of populations, cases, and deaths for Tamil Nadu and Andhra Pradesh versus the United States.
(A) Age distribution of the population of Tamil Nadu and Andhra Pradesh (blue) against that of the U.S. population (purple) for comparison; underlying data are shown in table S10. Estimates are census extrapolations for the year 2020 in both settings. (B) Age distribution of cases. (C) Cumulative incidence of COVID-19 by age. (D) Age distribution of deaths. (E) Cumulative COVID-19 mortality by age. Data for the United States include all cases and deaths reported by 21 August 2020 (35).

Comment in

References

    1. Li Q., Guan X., Wu P., Wang X., Zhou L., Tong Y., Ren R., Leung K. S. M., Lau E. H. Y., Wong J. Y., Xing X., Xiang N., Wu Y., Li C., Chen Q., Li D., Liu T., Zhao J., Liu M., Tu W., Chen C., Jin L., Yang R., Wang Q., Zhou S., Wang R., Liu H., Luo Y., Liu Y., Shao G., Li H., Tao Z., Yang Y., Deng Z., Liu B., Ma Z., Zhang Y., Shi G., Lam T. T. Y., Wu J. T., Gao G. F., Cowling B. J., Yang B., Leung G. M., Feng Z., Early transmission dynamics in Wuhan, China, of novel coronavirus–infected pneumonia. N. Engl. J. Med. 382, 1199–1207 (2020). 10.1056/NEJMoa2001316 - DOI - PMC - PubMed
    1. Zhou F., Yu T., Du R., Fan G., Liu Y., Liu Z., Xiang J., Wang Y., Song B., Gu X., Guan L., Wei Y., Li H., Wu X., Xu J., Tu S., Zhang Y., Chen H., Cao B., Clinical course and risk factors for mortality of adult inpatients with COVID-19 in Wuhan, China: A retrospective cohort study. Lancet 395, 1054–1062 (2020). 10.1016/S0140-6736(20)30566-3 - DOI - PMC - PubMed
    1. Guan W. J., Ni Z. Y., Hu Y., Liang W. H., Ou C. Q., He J. X., Liu L., Shan H., Lei C. L., Hui D. S. C., Du B., Li L. J., Zeng G., Yuen K.-Y., Chen R. C., Tang C. L., Wang T., Chen P. Y., Xiang J., Li S. Y., Wang J. L., Liang Z. J., Peng Y. X., Wei L., Liu Y., Hu Y. H., Peng P., Wang J. M., Liu J. Y., Chen Z., Li G., Zheng Z. J., Qiu S. Q., Luo J., Ye C. J., Zhu S. Y., Zhong N. S., Clinical characteristics of coronavirus disease 2019 in China. N. Engl. J. Med. 382, 1708–1720 (2020). 10.1056/NEJMoa2002032 - DOI - PMC - PubMed
    1. Grasselli G., Zangrillo A., Zanella A., Antonelli M., Cabrini L., Castelli A., Cereda D., Coluccello A., Foti G., Fumagalli R., Iotti G., Latronico N., Lorini L., Merler S., Natalini G., Piatti A., Ranieri M. V., Scandroglio A. M., Storti E., Cecconi M., Pesenti A., Baseline characteristics and outcomes of 1591 patients infected with SARS-CoV-2 admitted to ICUs of the Lombardy region, Italy. JAMA 323, 1574–1581 (2020). 10.1001/jama.2020.5394 - DOI - PMC - PubMed
    1. Docherty A. B., Harrison E. M., Green C. A., Hardwick H. E., Pius R., Norman L., Holden K. A., Read J. M., Dondelinger F., Carson G., Merson L., Lee J., Plotkin D., Sigfrid L., Halpin S., Jackson C., Gamble C., Horby P. W., Nguyen-Van-Tam J. S., Ho A., Russell C. D., Dunning J., Openshaw P. J. M., Baillie J. K., Semple M. G., Features of 20 133 UK patients in hospital with covid-19 using the ISARIC WHO Clinical Characterisation Protocol: Prospective observational cohort study. BMJ 369, m1985 (2020). 10.1136/bmj.m1985 - DOI - PMC - PubMed

Publication types

MeSH terms