. 2021 Jan;32(1):52-68.
doi: 10.1681/ASN.2020050597. Epub 2020 Nov 5.

Deep Learning-Based Segmentation and Quantification in Experimental Kidney Histopathology

Affiliations

Deep Learning-Based Segmentation and Quantification in Experimental Kidney Histopathology

Nassim Bouteldja et al. J Am Soc Nephrol. 2021 Jan.

Abstract

Background: Nephropathologic analyses provide important outcomes-related data in experiments with the animal models that are essential for understanding kidney disease pathophysiology. Precision medicine increases the demand for quantitative, unbiased, reproducible, and efficient histopathologic analyses, which will require novel high-throughput tools. A deep learning technique, the convolutional neural network, is increasingly applied in pathology because of its high performance in tasks like histology segmentation.

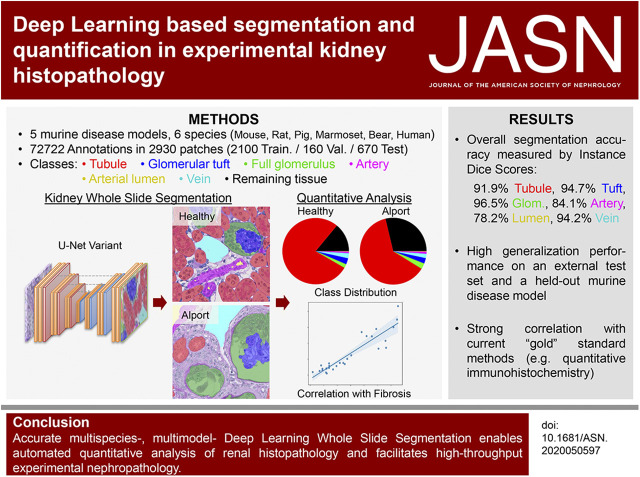
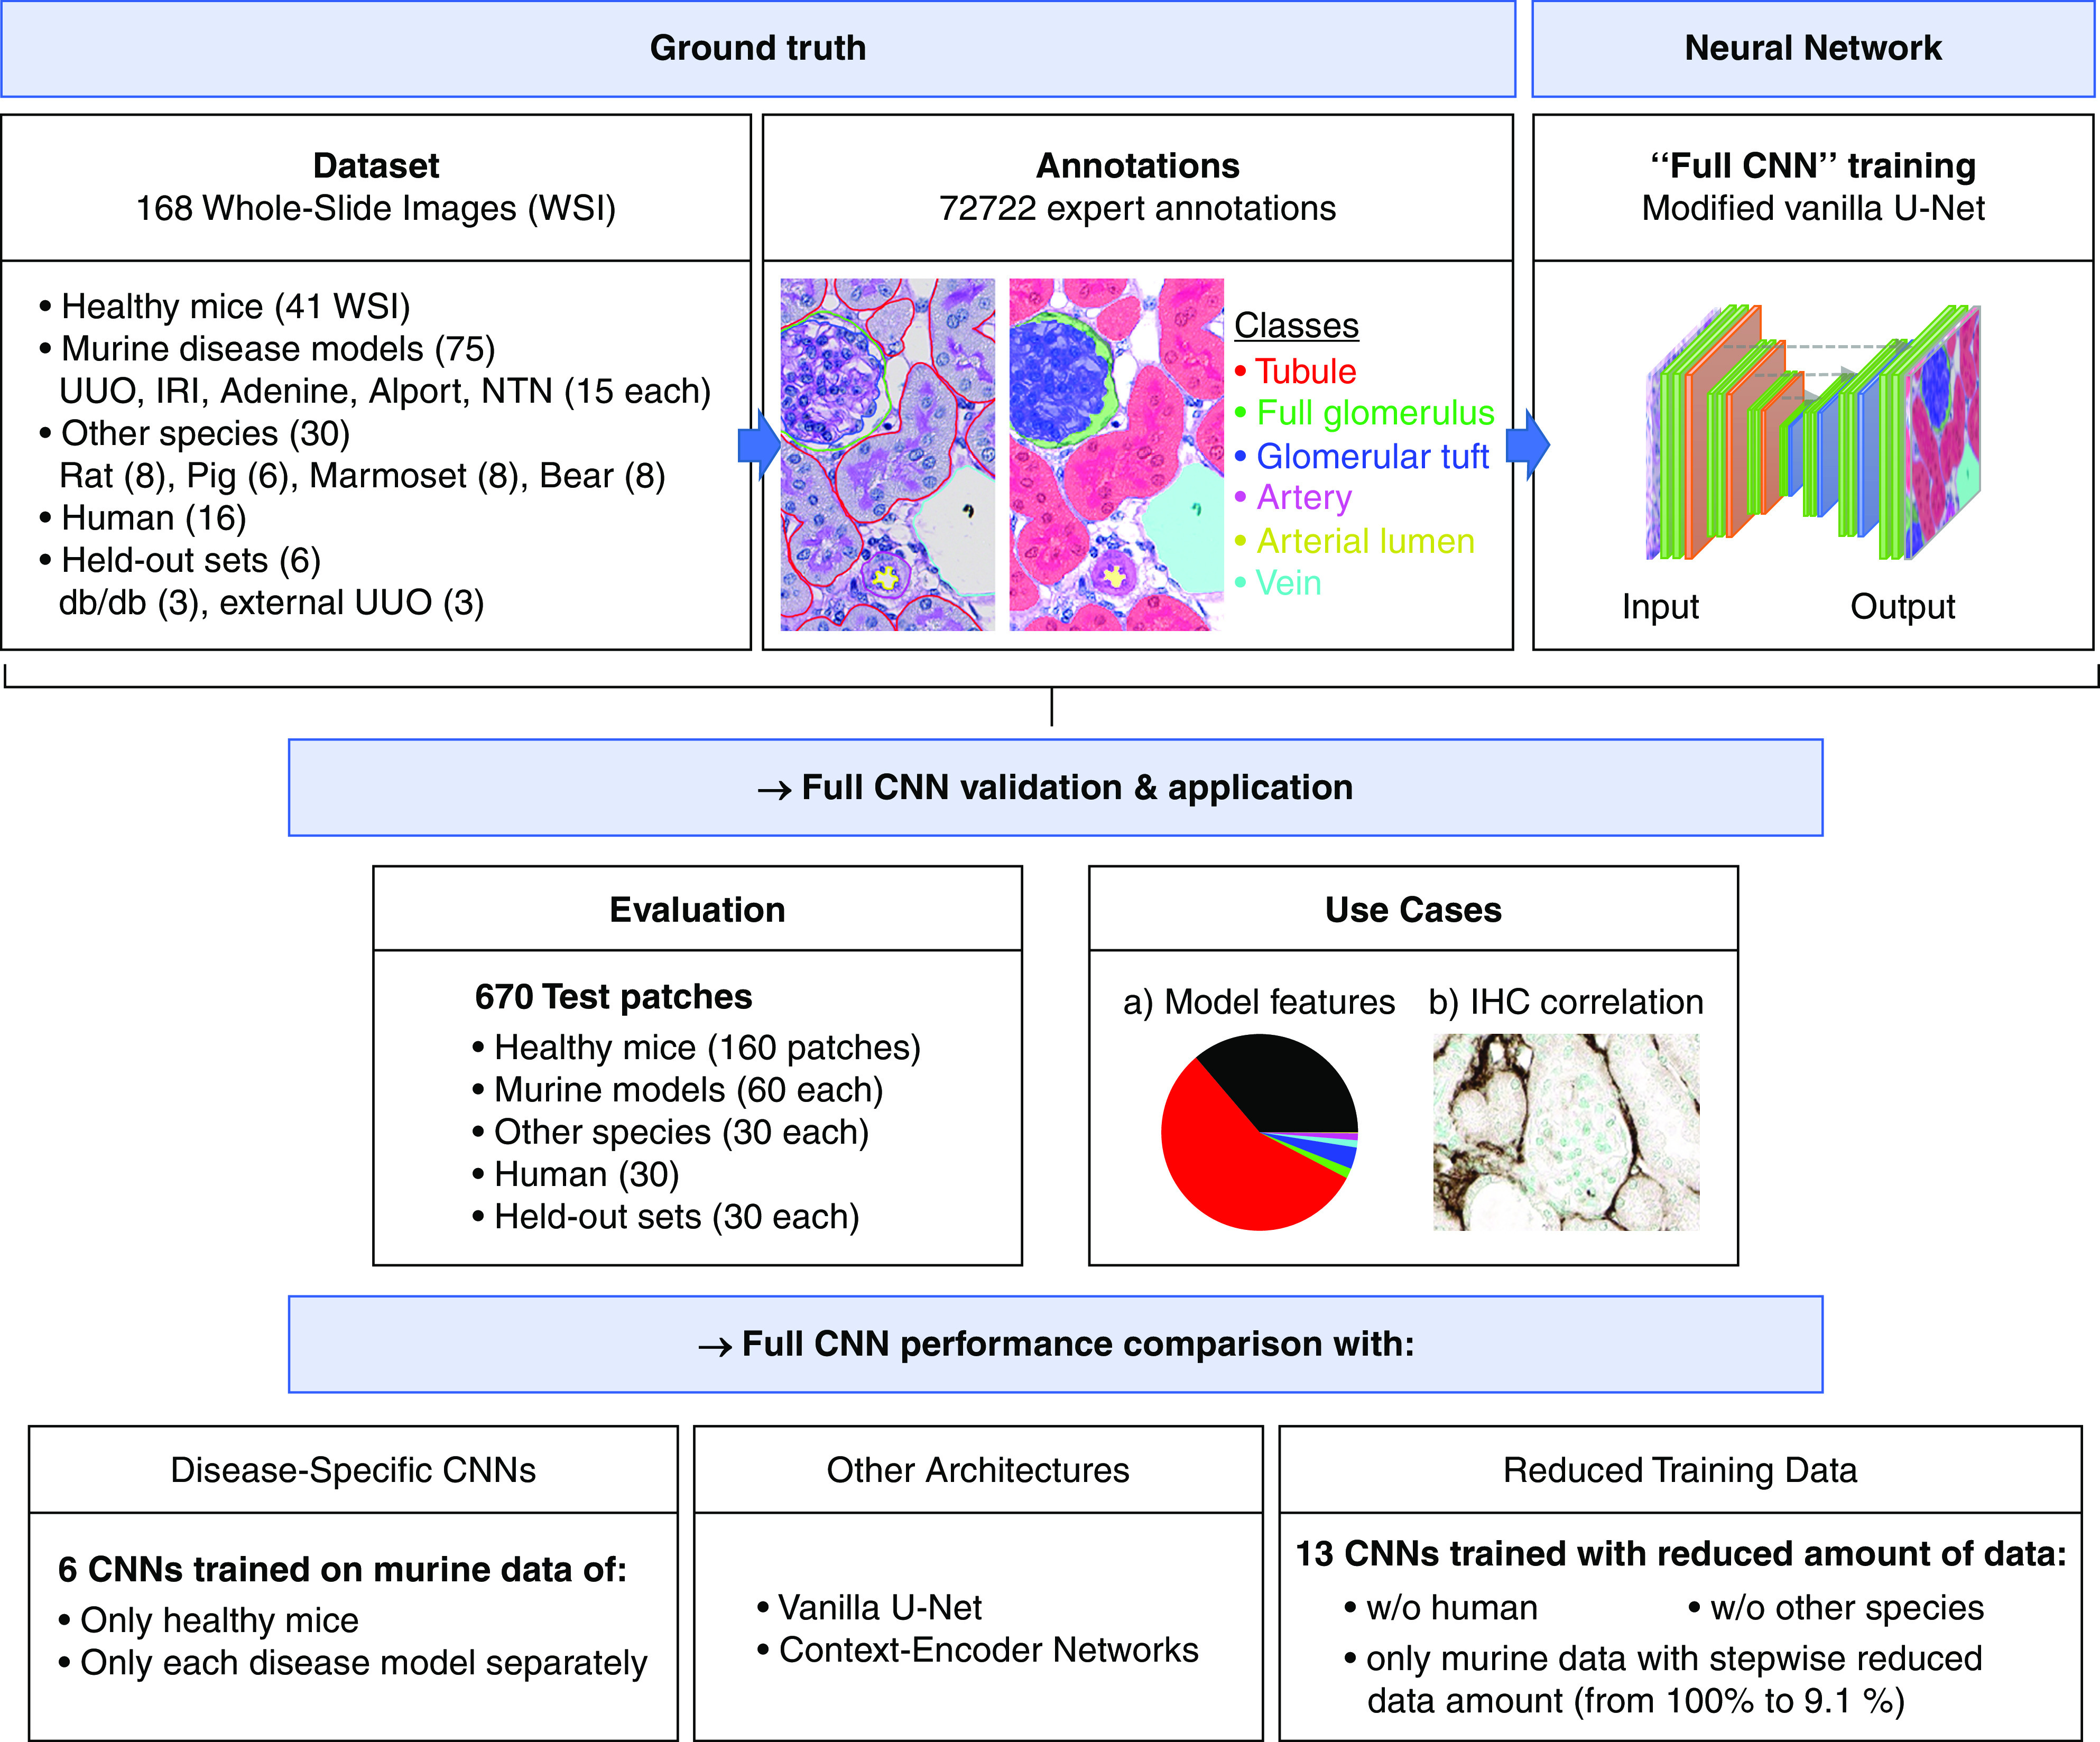
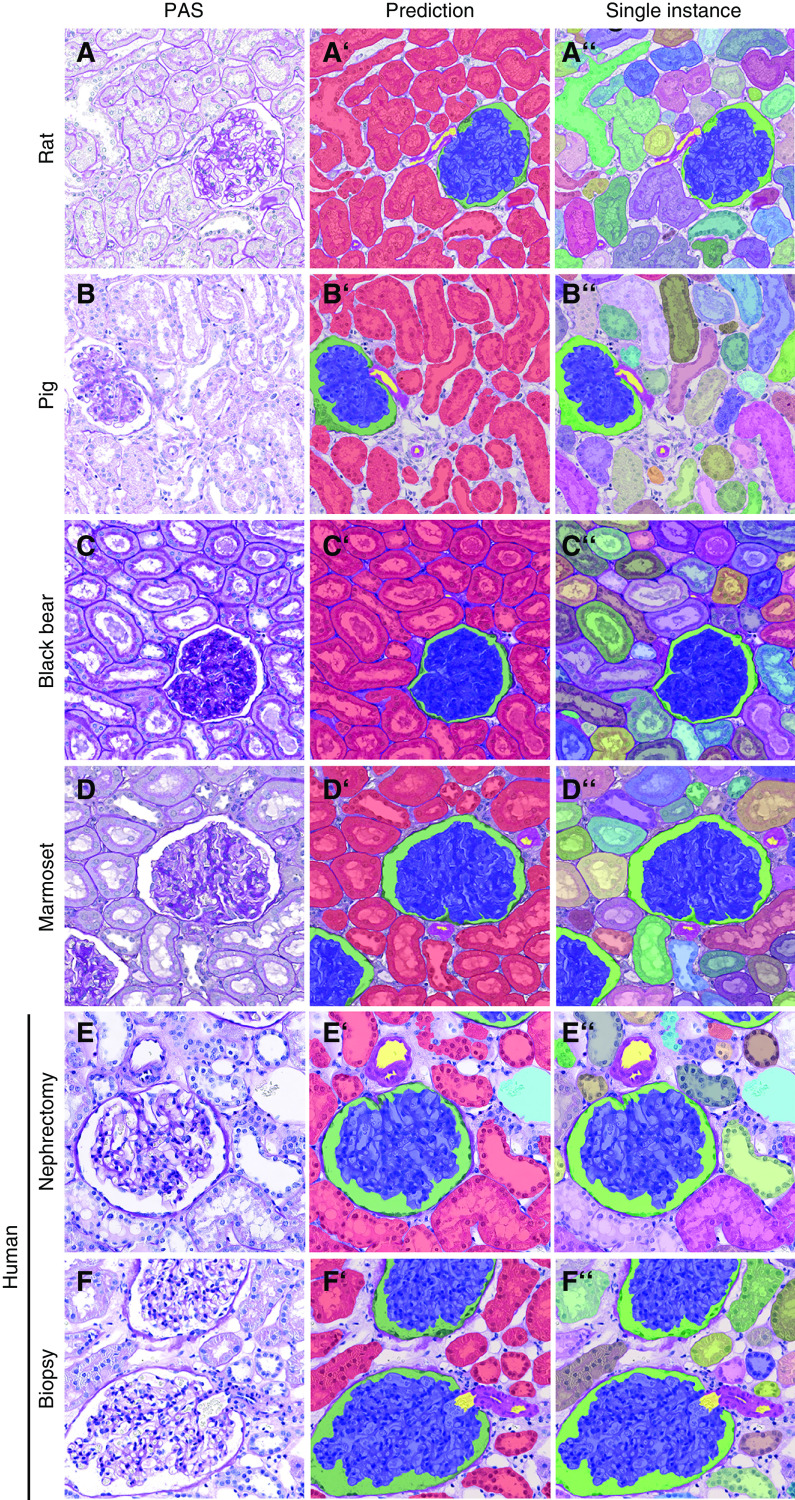
Methods: We investigated use of a convolutional neural network architecture for accurate segmentation of periodic acid-Schiff-stained kidney tissue from healthy mice and five murine disease models and from other species used in preclinical research. We trained the convolutional neural network to segment six major renal structures: glomerular tuft, glomerulus including Bowman's capsule, tubules, arteries, arterial lumina, and veins. To achieve high accuracy, we performed a large number of expert-based annotations, 72,722 in total.

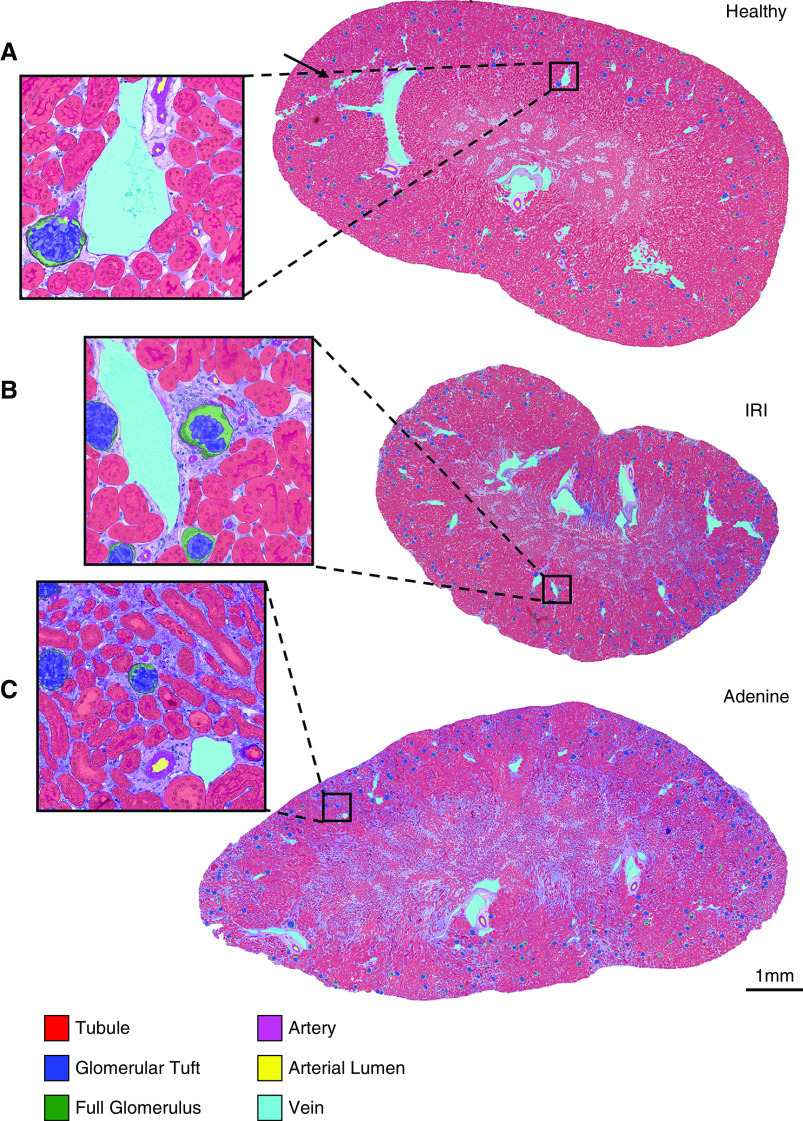
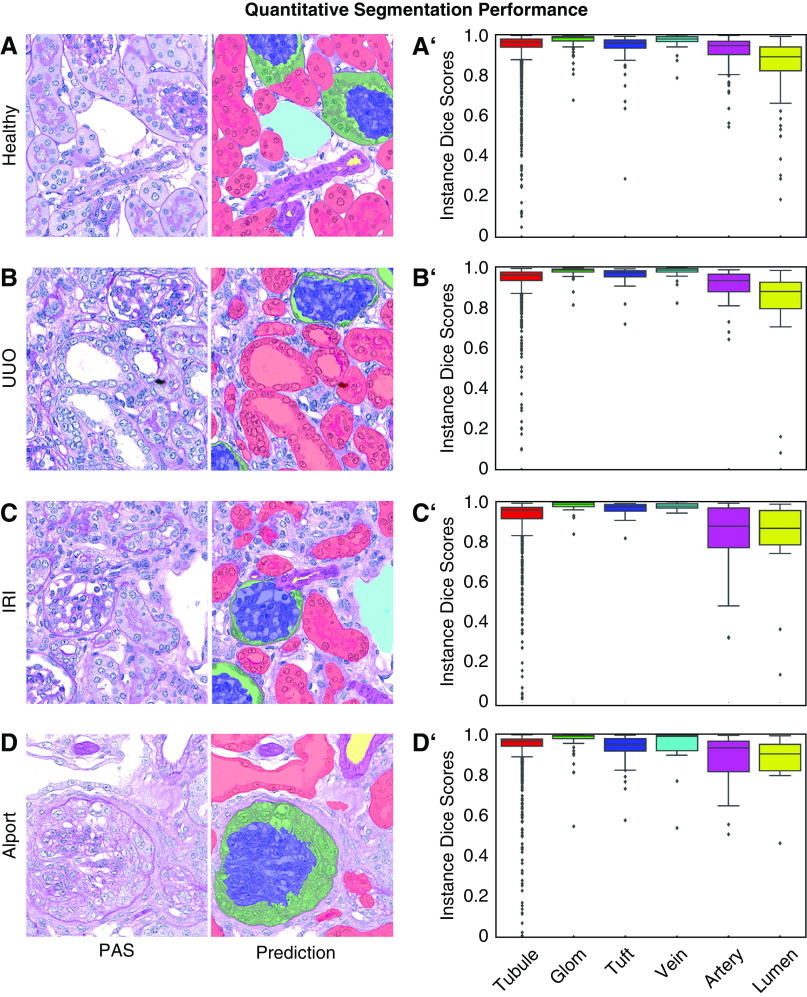
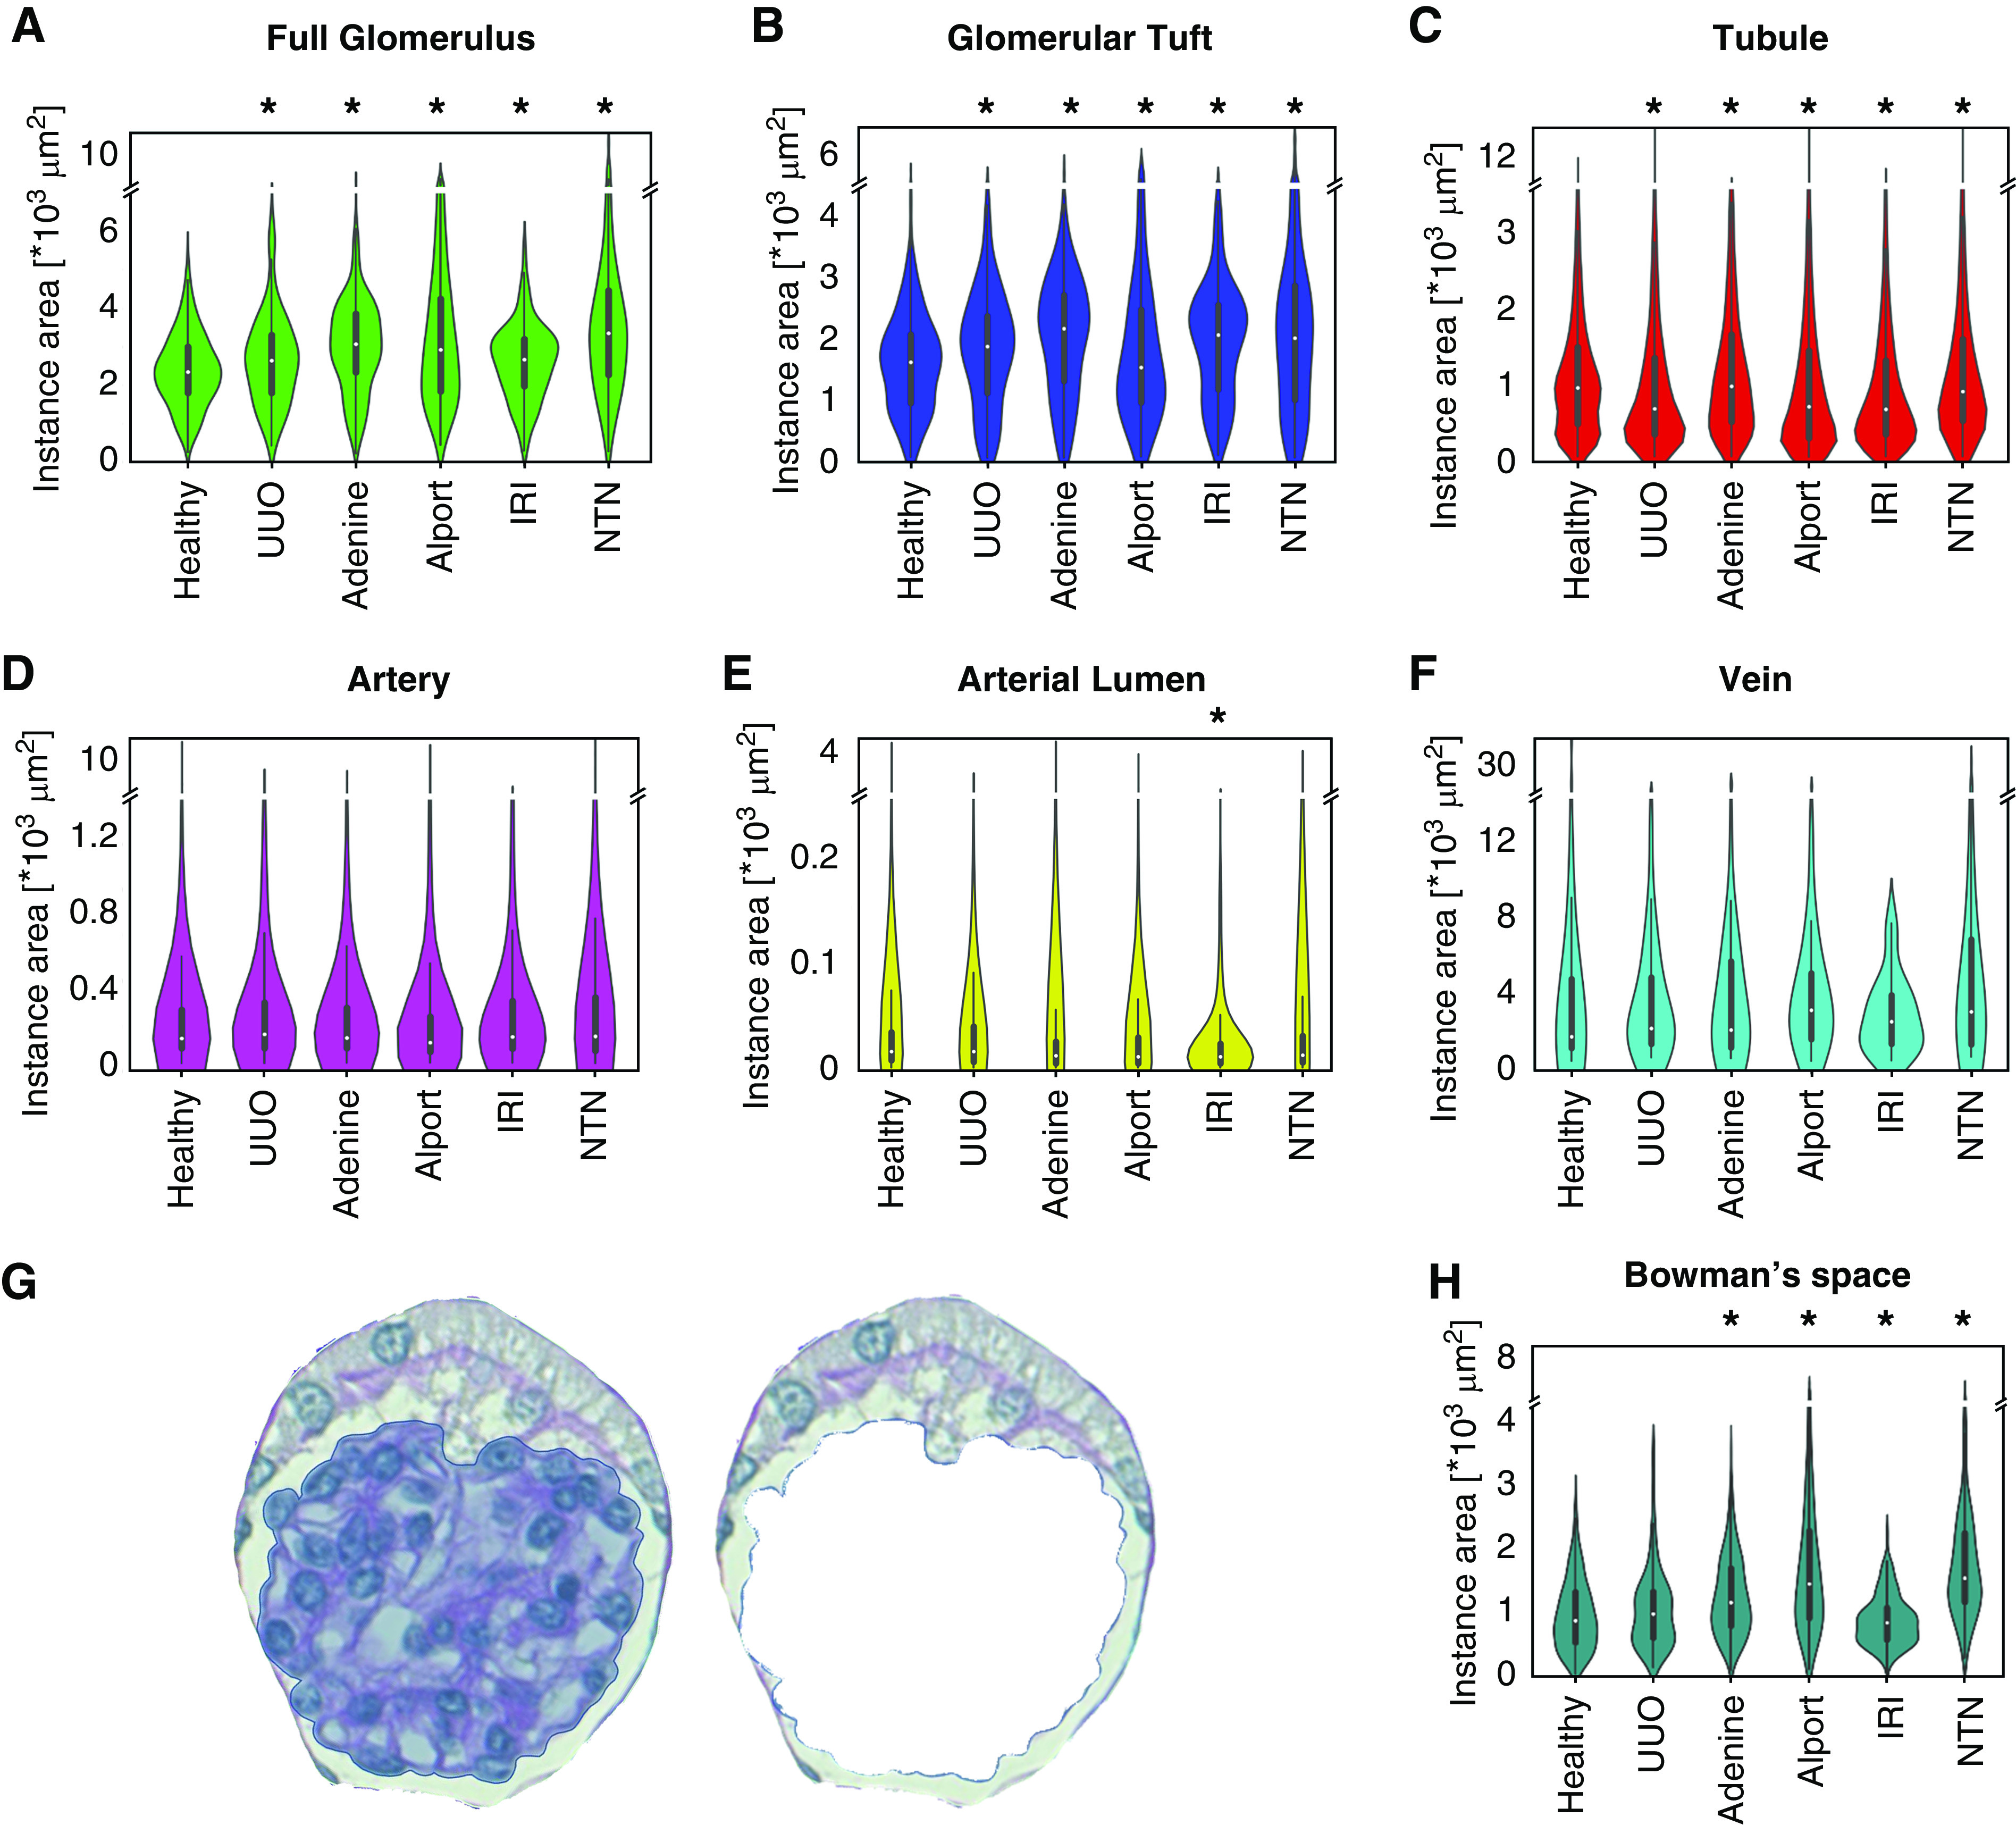
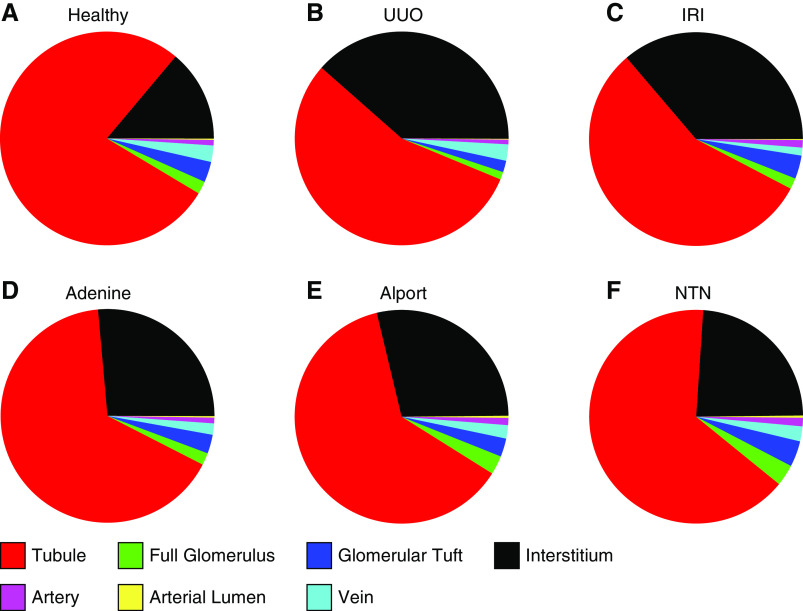
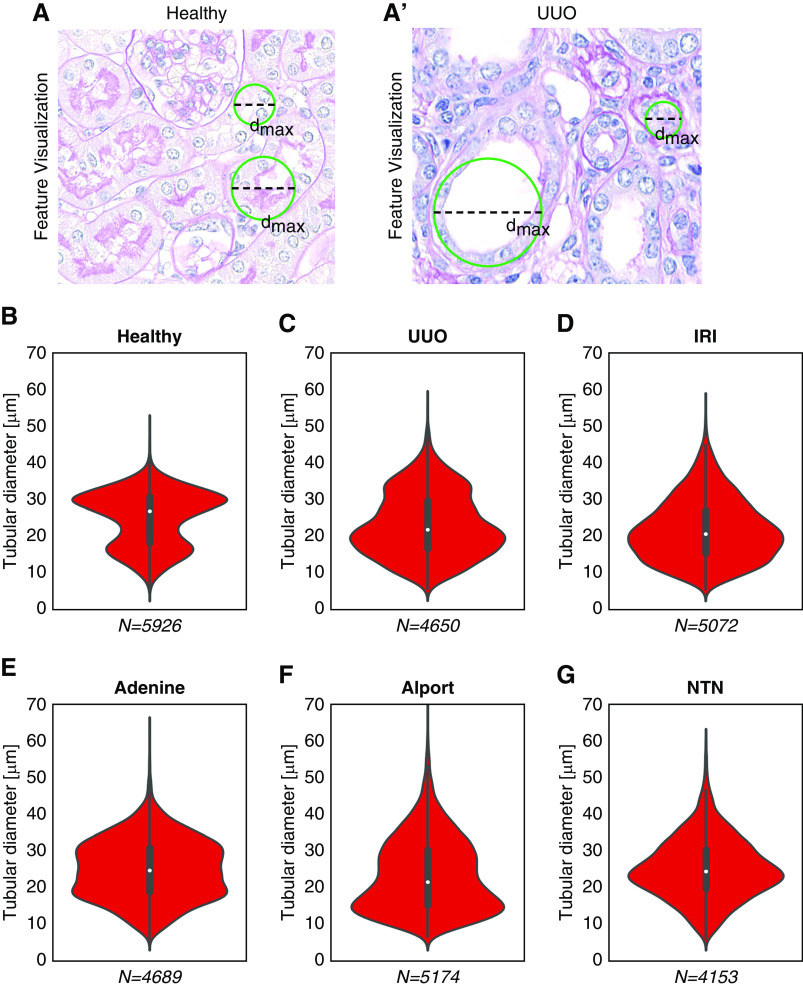
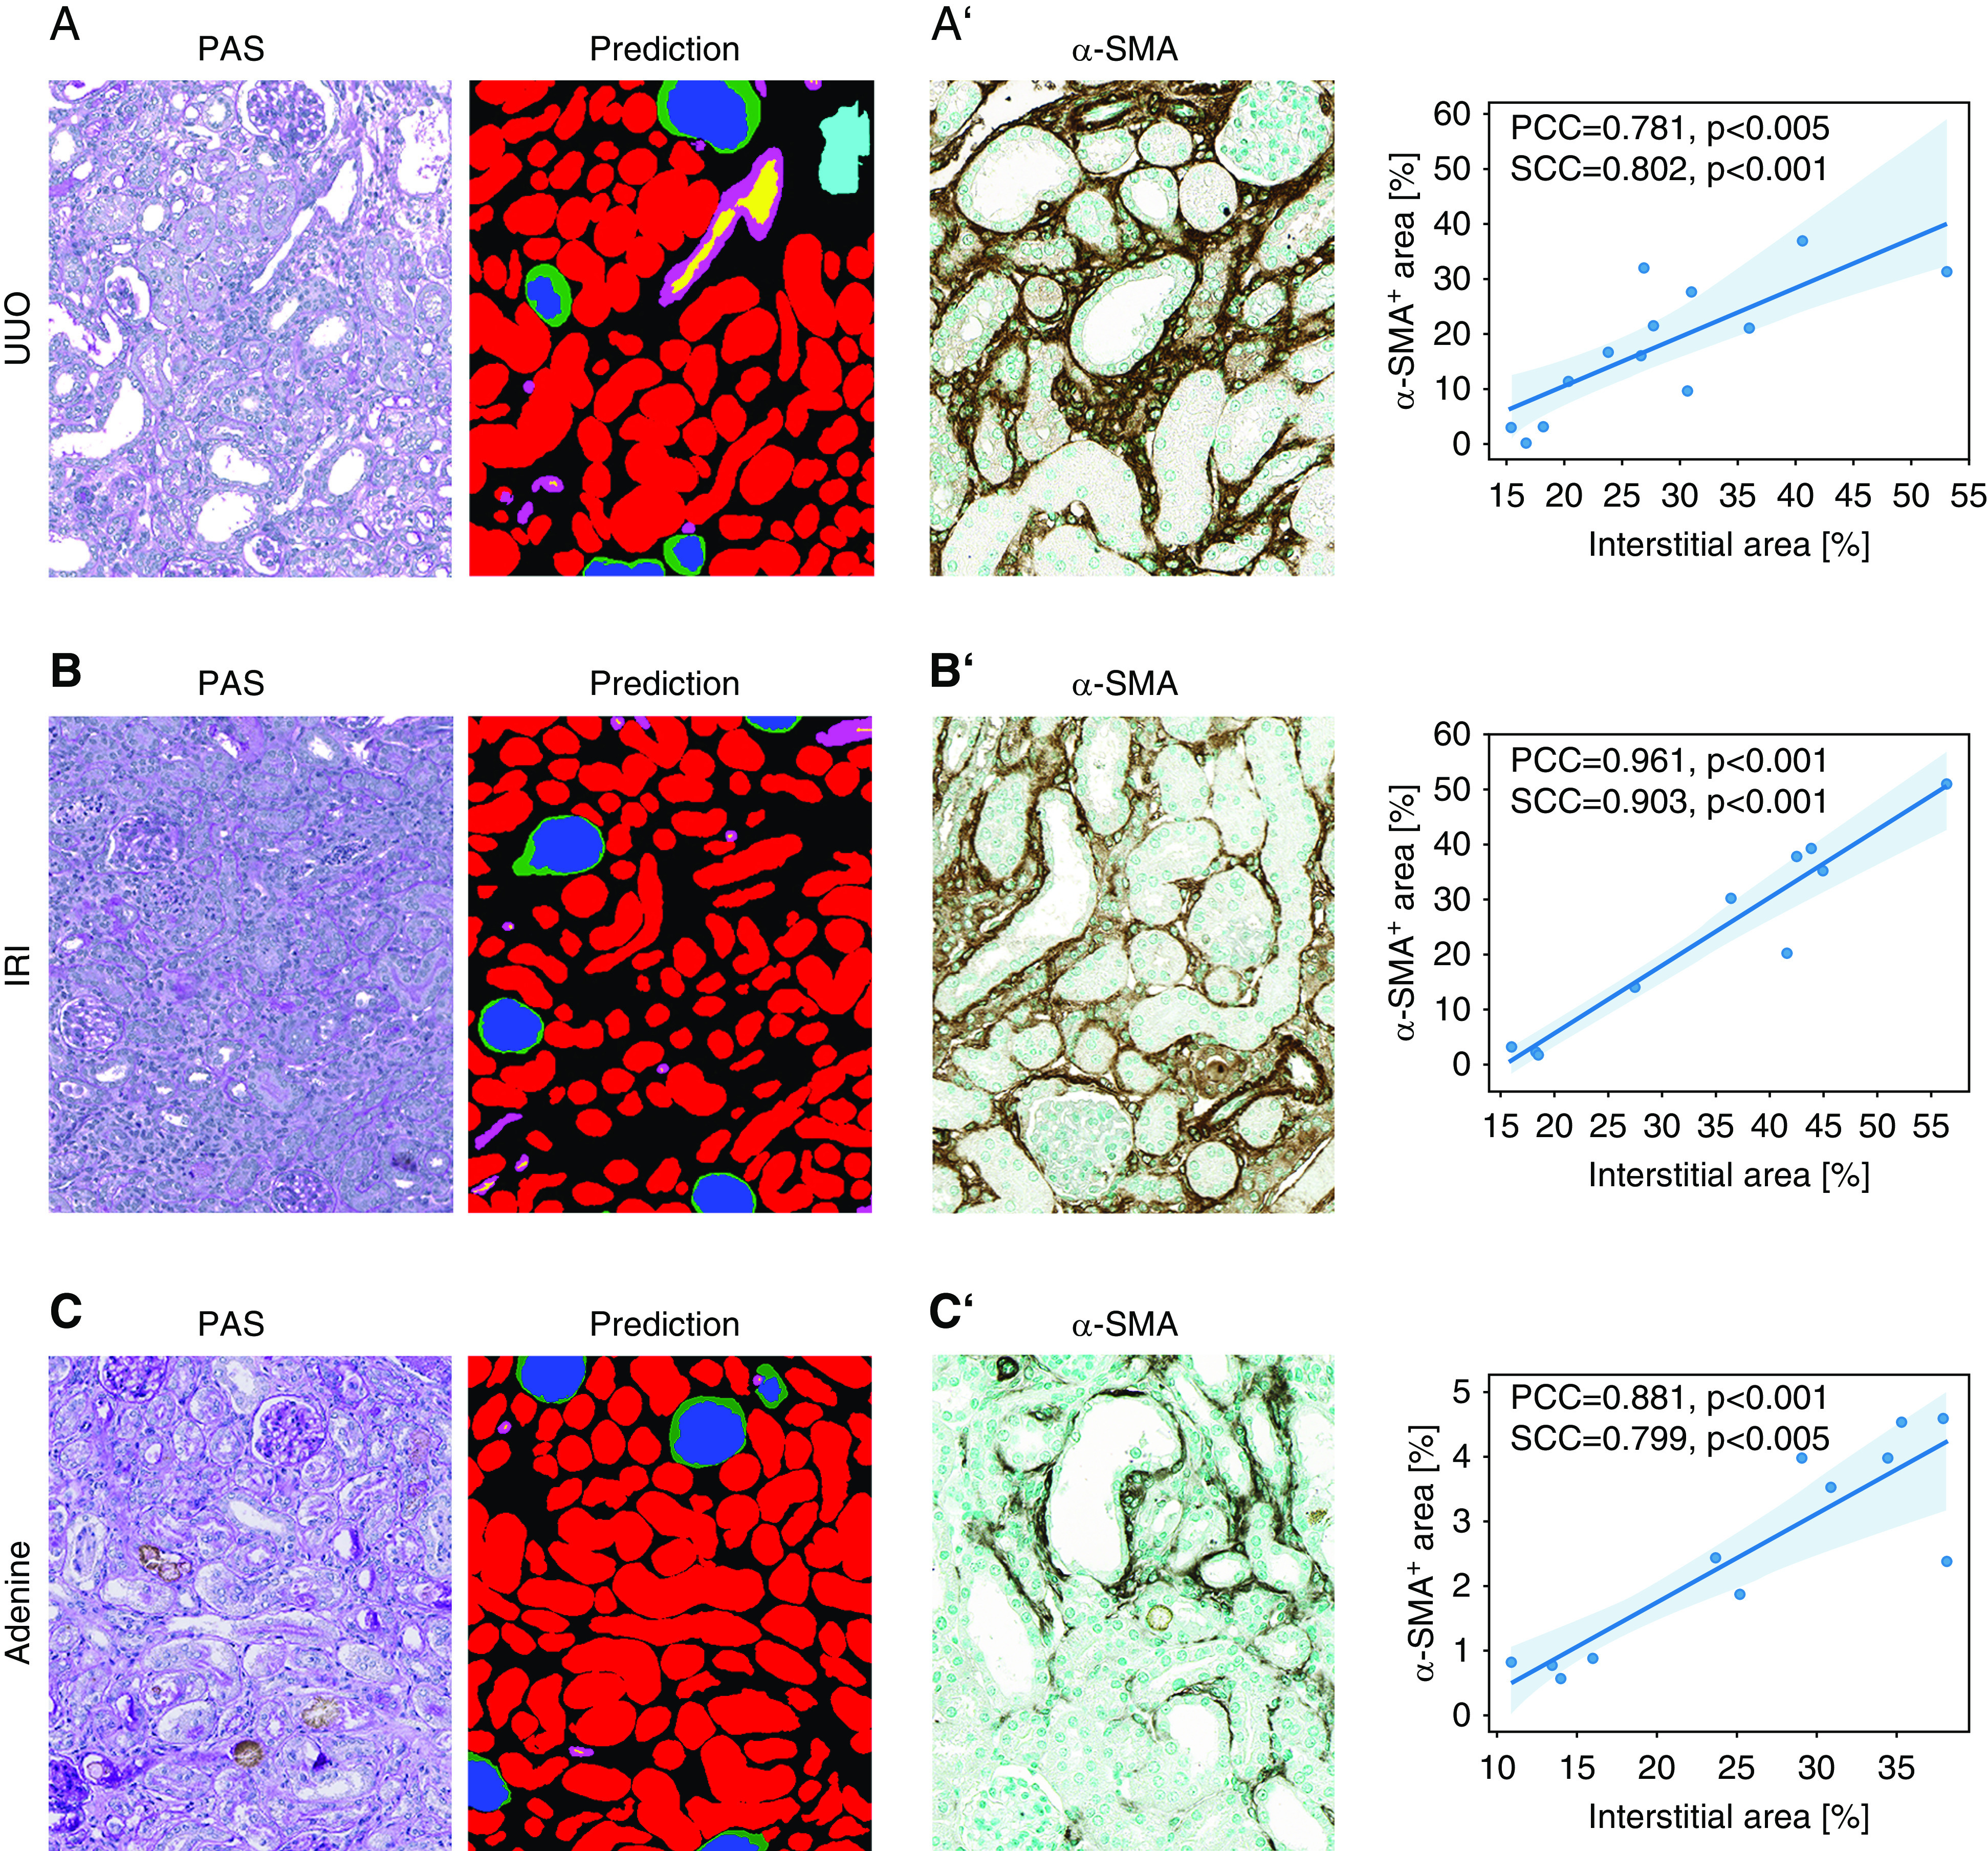
Results: Multiclass segmentation performance was very high in all disease models. The convolutional neural network allowed high-throughput and large-scale, quantitative and comparative analyses of various models. In disease models, computational feature extraction revealed interstitial expansion, tubular dilation and atrophy, and glomerular size variability. Validation showed a high correlation of findings with current standard morphometric analysis. The convolutional neural network also showed high performance in other species used in research-including rats, pigs, bears, and marmosets-as well as in humans, providing a translational bridge between preclinical and clinical studies.

Conclusions: We developed a deep learning algorithm for accurate multiclass segmentation of digital whole-slide images of periodic acid-Schiff-stained kidneys from various species and renal disease models. This enables reproducible quantitative histopathologic analyses in preclinical models that also might be applicable to clinical studies.

Keywords: animal model; digital pathology; histopathology; segmentation.


Figures

None
Graphical abstract
Figure 1.
Figure 1.
Overview of experimental design. Our DL model (here: Full CNN) was trained with annotations from healthy and diseased murine kidneys and with annotations from five different species including humans. A total of 72,722 single instance annotations comprised six different renal structures: “tubule,” “full glomerulus,” “glomerular tuft,” “artery,” “arterial lumen,” and “vein.” The model was tested on healthy and diseased murine kidneys, on five different other species, on a held-out murine disease model, and on an external UUO cohort. We used the automatically segmented kidneys to perform quantitative feature analysis and correlations with IHC. Further experiments included an ablation study on varying training dataset sizes to analyze its effect on model performance, and we also compared the full CNN with its variants solely trained on single murine models and with different state-of-the-art segmentation networks including the vanilla U-Net and context-encoder networks. IHC, immunohistochemistry; w/o, without.
Figure 2.
Figure 2.
Automated segmentation on WSIs of murine kidneys. (A) The CNN generates segmentation predictions on a WSI of a healthy mouse kidney. All six classes, i.e., tubule, glomerulus, glomerular tuft, artery, arterial lumen, and vein, are precisely segmented. Even tissue damage in the form of an artificial scratch (arrow) is correctly assigned to the vein class including the background. Similar segmentation predictions are generated for WSIs of (B) IRI and (C) adenine kidneys.
Figure 3.
Figure 3.
Quantitative segmentation performance in murine kidney disease models. Representative PAS pictures and corresponding segmentation predictions generated by the CNN for murine (A) healthy, (B) UUO, (C) IRI, and (D) Alport kidneys. Instance segmentation accuracy is shown by instance Dice scores for each class in all four models (A’–D’). Data are presented in box plots with median, quartiles, and whiskers. Glom, glomerulus; Tuft, glomerular tuft.
Figure 4.
Figure 4.
Instance sizes of each class. Violin plots show the distribution pattern of cross-sectional instance sizes for each of the six automatically segmented classes: (A) full glomerulus, (B) glomerular tuft, (C) tubule, (D) artery, (E) arterial lumen, and (F) vein in healthy, UUO, IRI, adenine, Alport, and NTN kidneys. In addition, we subtracted the glomerular tuft area from each glomerulus (G) to analyze size distribution of Bowman’s space (H). *P<0.05 versus healthy.
Figure 5.
Figure 5.
Relative area distributions of automatically segmented classes. The relative area distributions in percentages in (A) healthy, (B) UUO, (C) IRI, (D) adenine, (E) Alport, and (F) NTN kidneys additionally give information on the proportion of remaining nonclassified tubulointerstitial area (shown in black).
Figure 6.
Figure 6.
Quantitative analysis of tubular dilation. An exemplary illustration of automated analysis of tubular dilation in PAS stainings of (A) healthy and (A’) UUO mouse kidneys (top). The maximum tubular diameter is defined as the diameter of the maximum-sized circle that fits into a tubule segmentation. Violin plots show the distribution of the analyzed tubular diameter within each model, i.e., for (B) healthy, (C) UUO, (D) IRI, (E) adenine, (F) Alport mice, and (G) NTN. dmax, maximum diameter; N, number of analyzed tubule instances.
Figure 7.
Figure 7.
Correlation between segmentation and standard computer-assisted morphometric analyses. (A) Representative picture of the automated segmentation prediction in a murine UUO kidney section. The nonclassified remaining tissue (black) correlates with α-SMA+ area (A’) quantified in immunostainings of the same kidneys. (B) Representative picture of the automated segmentation prediction on a murine IRI kidney section. The nonclassified remaining tissue (black) correlates with α-SMA+ area (B’) quantified in immunostainings from the same kidneys. (C) Representative picture of the automated segmentation prediction on a murine adenine kidney section. The nonclassified remaining tissue (black) correlates with α-SMA+ area (C’) quantified in immunostainings from the same kidneys. PCC, Pearson correlation coefficient; SCC, Spearman correlation coefficient.
Figure 8.
Figure 8.
Automated segmentation of kidneys from various species. Representative pictures illustrate the segmentation quality of the CNN in kidney tissue from (A–A’’) rat, (B–B’’) pig, (C–C’’) black bear, and (D–D’’) marmoset. Predictions (A’–D’) depict different classes, whereas (A’’–D’’) display predictions on instance level for tubules. All classes are also correctly detected and segmented on human nephrectomy (E–E’’) and smaller human biopsy (F–F’’) specimens.

Similar articles

Cited by

References

    1. Robboy SJ, Weintraub S, Horvath AE, Jensen BW, Alexander CB, Fody EP, et al. .: Pathologist workforce in the United States: I. Development of a predictive model to examine factors influencing supply. Arch Pathol Lab Med 137: 1723–1732, 2013 - PubMed
    1. LeCun Y, Bengio Y, Hinton G: Deep learning. Nature 521: 436–444, 2015 - PubMed
    1. Boor P: Artificial intelligence in nephropathology. Nat Rev Nephrol 16: 4–6, 2020 - PubMed
    1. Sirinukunwattana K, Ahmed Raza SE, Yee-Wah Tsang, Snead DRJ, Cree IA, Rajpoot NM: Locality sensitive deep learning for detection and classification of nuclei in routine colon cancer histology images. IEEE Trans Med Imaging 35: 1196–1206, 2016 - PubMed
    1. Xu Y, Jia Z, Wang LB, Ai Y, Zhang F, Lai M, et al. .: Large scale tissue histopathology image classification, segmentation, and visualization via deep convolutional activation features. BMC Bioinformatics 18: 281, 2017 - PMC - PubMed

Publication types