. 2020 Nov 5;11(1):5587.
doi: 10.1038/s41467-020-19383-8.

Spatially and cell-type resolved quantitative proteomic atlas of healthy human skin

Affiliations

Spatially and cell-type resolved quantitative proteomic atlas of healthy human skin

Beatrice Dyring-Andersen et al. Nat Commun. .

Abstract

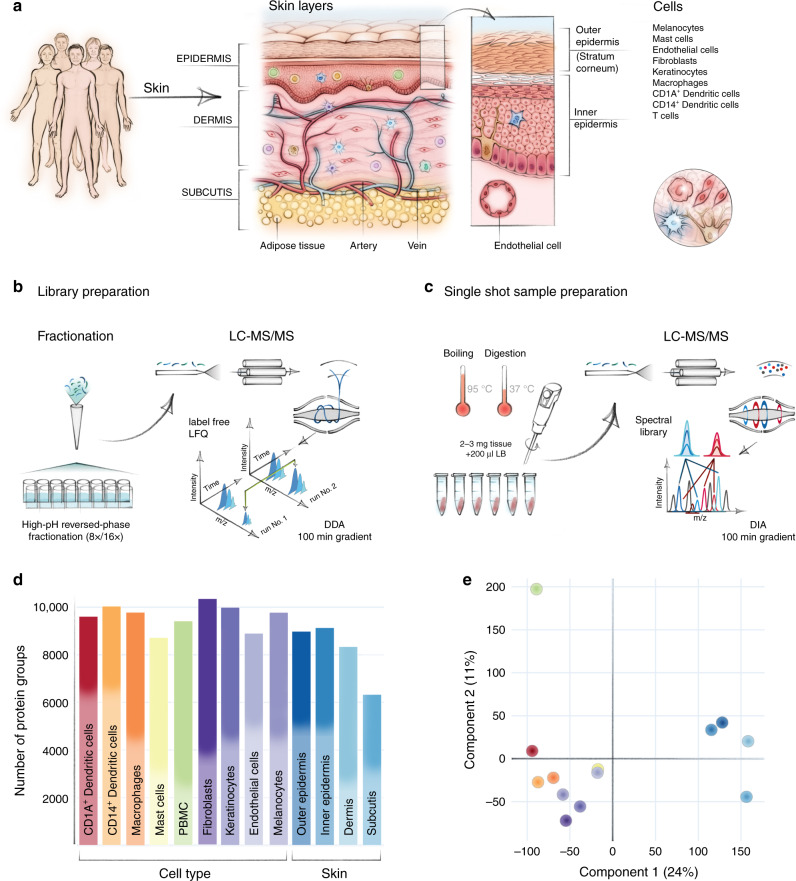
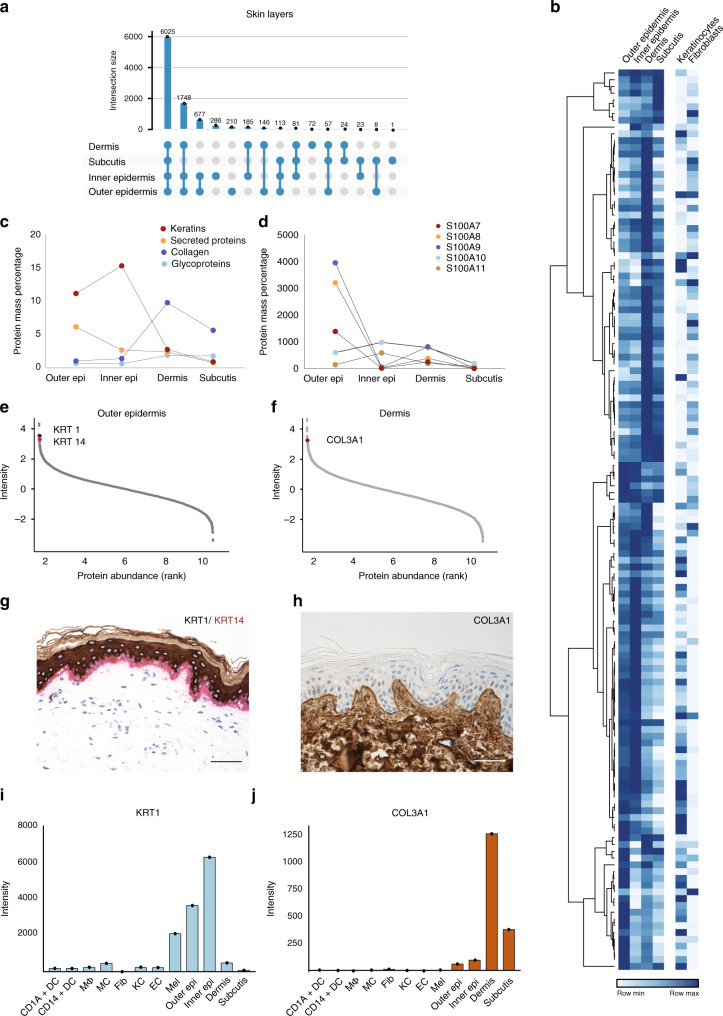
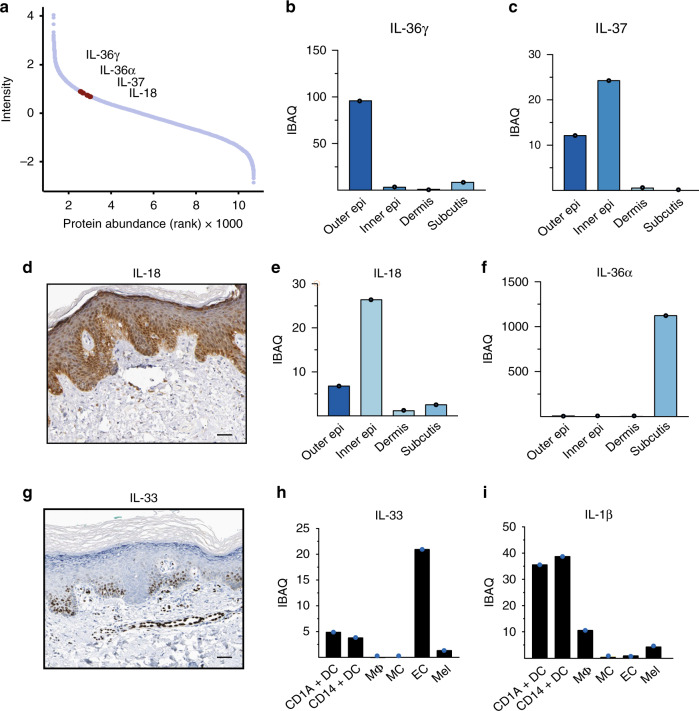
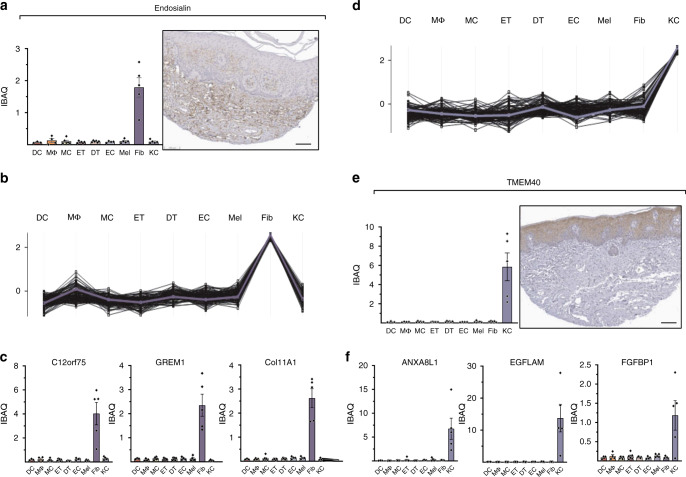
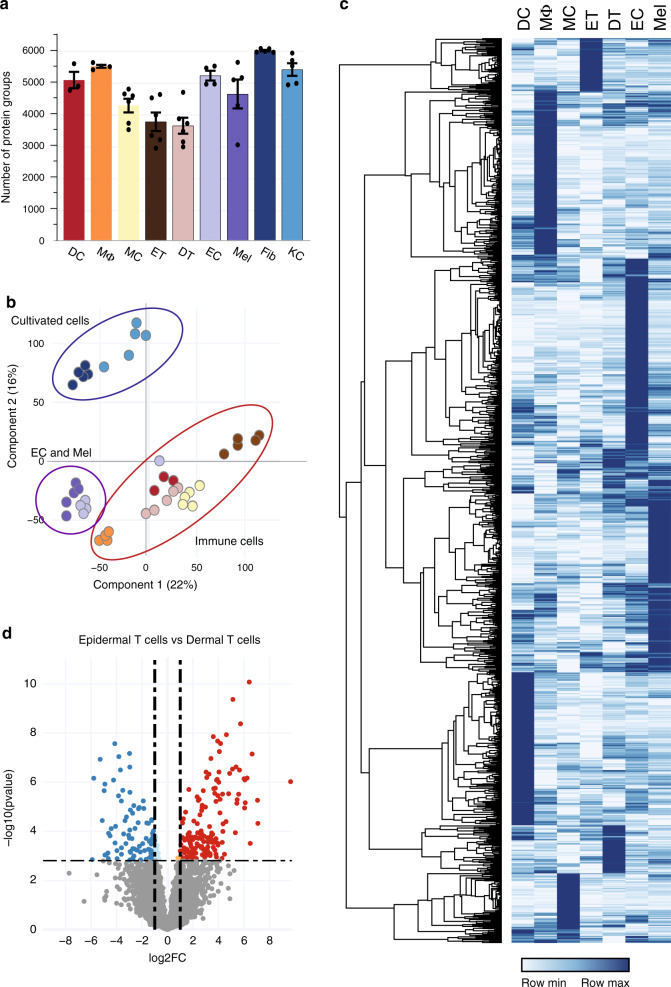
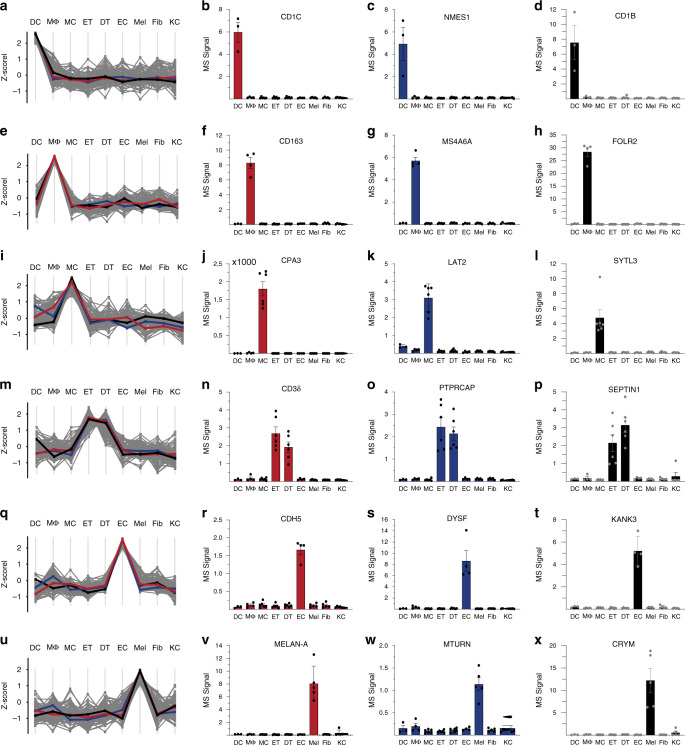
Human skin provides both physical integrity and immunological protection from the external environment using functionally distinct layers, cell types and extracellular matrix. Despite its central role in human health and disease, the constituent proteins of skin have not been systematically characterized. Here, we combine advanced tissue dissection methods, flow cytometry and state-of-the-art proteomics to describe a spatially-resolved quantitative proteomic atlas of human skin. We quantify 10,701 proteins as a function of their spatial location and cellular origin. The resulting protein atlas and our initial data analyses demonstrate the value of proteomics for understanding cell-type diversity within the skin. We describe the quantitative distribution of structural proteins, known and previously undescribed proteins specific to cellular subsets and those with specialized immunological functions such as cytokines and chemokines. We anticipate that this proteomic atlas of human skin will become an essential community resource for basic and translational research ( https://skin.science/ ).


Conflict of interest statement

The authors declare no competing interests.

Figures

Fig. 1
Fig. 1. In-depth MS-based proteomic analysis of skin layers and its cellular subsets.
a Workflow for measuring the skin proteome including skin layers, cultivated keratinocytes, and fibroblasts and FACS-sorted melanocytes, endothelial cells, and immune cells. b High-resolution MS analyses of fractionated, pooled samples in data-dependent acquisition mode (DDA) and subsequent (c) single-run analyses of three to six biological replicates in data-independent (DIA) acquisition mode. d Number of protein groups for each major cell subset and skin layers based on pooled samples (one independent experiment) for cell subsets and skin layers, respectively examined over one independent experiment (CD1A+dendritic cells (N = 3), CD14+ dendritic cells (N = 3), macrophages (N = 4), mast cells (N = 6), fibroblast (N = 5), keratinocytes (N = 5), endothelial cells (N = 4), melanocytes (N = 5), skin layers (N = 5). A total of 10,701 protein were identified. e Principal component analysis (PCA) of all proteomes from skin layers, primary cells and immune cell types. Color code from panel (d). The fractionated proteome of PBMC (green dot) was included as library for skin-associated T cells. Component 1 and 2 account for 24 and 11% of the total data variation, respectively.
Fig. 2
Fig. 2. Spatial proteomic gradient of human skin.
a Unique and overlapping protein groups in outer and inner epidermis, dermis and subcutis skin layers (UpSet plot) One independent experiment of pooled samples (N = 1) from five donors for each layer). b Relative expression levels of important structural and immunological proteins across skin layers and in primary keratinocytes and fibroblasts. Clustering is based on the log2 expression level of the proteins in skin layers (DDA). c Protein mass percentage of keratins, collagens, glycoproteins and secreted proteins across skin layers. Percentage was calculated by dividing the summed iBAQ intensities of the proteins of interest by all summed iBAQ intensities of all proteins (see Methods). d Expression profiles of the S100A family members of proteins across skin layers, illustrating their layer-specific, functional abundance. e, f Estimated protein abundance vs protein rank highlighting keratin 1 (KRT1), keratin 14 (KRT14), and collagen III (COL3A1) (upper panels) and (g, h) immunohistochemical stainings (KRT1, brown, KRT14, red, COL3A1, brown) (lower panels), scale bar: 50 µm. KRT1 is the protein with the 7th highest estimated abundance in outer epidermis, whereas KRT14 is the 6th most abundant. COL3A1 is the 19th most abundant protein in dermis, which is also reflected in the staining. i Estimated abundance of KRT1 and (j) COL3A1 across libraries based on pooled samples of skin layers and skin-derived cells examined over one independent experiment from pooled samples (N = number of pooled donor samples). (CD1A+dendritic cells (N = 3), CD14+ dendritic cells (N = 3), MΦ; macrophages (N = 4), MC; mast cells (N = 6), Fib; fibroblast (N = 5), KC; keratinocytes (N = 5), EC; endothelial cells (N = 4), Mel; melanocytes (N = 5), skin layers (Outer Epi, Inner Epi, Dermis, Subcutis) (N = 5). Source data are provided as a Source Data file.
Fig. 3
Fig. 3. Expression levels of interleukin 1 family members in the skin.
a Dynamic range plot illustrating the abundance of interleukin (IL) 1 family members in the skin. b, c Estimated intensity of the IL-1 family members IL-36γ and IL-37 throughout the skin. IL-36γ is primarily found to be expressed in the outer epidermal layer whereas IL-37 is both found to be expressed in the outer- and inner epidermal layer. d Immunohistochemical staining of healthy skin obtained from the Human Protein Atlas (Methods, Supplementary Data 17) showing IL-18 protein expression primarily in the inner epidermal layer (dark brown), scale bar: 50 µm. e, f Estimated intensity of the IL-1 family members IL-18 and IL-36α throughout the skin. IL-18 is mainly found in the inner- and outer epidermis whereas IL-36α is found in subcutis. g Immunohistochemical staining of IL-33 expression on healthy skin obtained from the Human Protein Atlas (Methods, Supplementary Data 17), scale bar: 50 µm. h Estimated intensity of recently discovered IL-33, here depicted in FACS-sorted skin-derived endothelial cells (EC), and to lesser extent in macrophages (MΦ) and dendritic cells (DC). i Estimated intensity of IL-1β expression in FACS-sorted cellular subsets from healthy skin. All barplots show estimated intensity (IBAQ, log2) based on one library of pooled samples (N = number of pooled samples) of skin layers (N = 5; b, c, e, f), CD1A+dendritic cells (N = 3; h, i), CD14+ dendritic cells (N = 3; h, i), MΦ; macrophages (N = 4; h, i), mast cells (N = 6; h, i), EC; endothelial cells (N = 4; h, i), Mel; melanocytes (N = 5; h, i). Source data are provided as a Source Data file.
Fig. 4
Fig. 4. The proteomes of cultivated fibroblasts and keratinocytes.
a MS-intensity (iBAQ) of endosialin across cell types (left upper panel) compared to its immunohistochemical staining obtained from the Human Protein Atlas (Scale bar: 100 µm, see Methods and Supplementary Data 17). b Protein abundance profiles of the top 100 proteins across cell types with the most similar fibroblast-enriched profile as endosialin (reference profile, blue line). Each line represents one protein. c MS-intensity of selected fibroblast-enriched proteins (GREM1, Col11A1, c12orf75,) across cell types. d Protein expression profiles of the top 100 proteins across cell types with the most similar keratinocyte-enriched profile as KLK10 (blue line). e iBAQ values of the keratinocyte-enriched protein TMEM40 across cell types and its immunohistochemical staining obtained from the Human Protein Atlas (Scale bar: 100 µm, see Methods and Supplementary Table 17). f MS-intensity of selected keratinocyte-enriched proteins (ANXA8L1, EGFLAM, FGFBP1) across cell types. All barplots show estimated intensity (data are presented as mean±SEM (IBAQ, log2)). DC; CD1A+dendritic cells (N = 3), MΦ; macrophages (N = 4), MC; mast cells (N = 6), DT; dermal T cells (N = 6), ET; epidermal T cells (N = 6), EC; endothelial cells (N = 4), Mel; melanocytes (N = 5), Fib; fibroblasts (N = 5), KC; keratinocytes (N = 5). Source data are provided as a Source Data file.
Fig. 5
Fig. 5. In-depth MS-based proteomic analysis of skin-associated cellular subsets.
a Single-run analyses of DC; CD1A+dendritic cells (N = 3), MΦ; macrophages (N = 4), MC; mast cells (N = 6), ET; epidermal T cells (N = 6), DT; dermal T cells (N = 6), EC; endothelial cells (N = 4), Mel; melanocytes (N = 5), Fib; fibroblasts (N = 5) and KC; keratinocytes (N = 5) using data-independent (DIA) acquisition. Data are presented as mean±SEM. N represents number of biologically independent samples. The number of quantified protein groups for each major cell lineage is roughly similar. Source data are provided as a Source Data file. b Principal component analysis (PCA) of all proteomes from cellular subsets. Color code from panel (a). The PCA separates cultivated fibroblast and keratinocytes from FACS-sorted endothelial cells (EC) and melanocytes (Mel) as well as from the immune cells, as indicated by enclosing ovals. c Heatmap of protein abundances of 1272 differentially expressed proteins (ANOVA, FDR < 0.01, FCH > 2) after unsupervised hierarchical clustering. d Differentially expressed proteins in epidermal T cells vs. dermal T cells (volcano plot, FDR < 0.05, FCH > 2).
Fig. 6
Fig. 6. The proteomes of cellular subsets from the skin reveal subset enriched proteins.
Protein expression profiles for the top 100 proteins across cell types using specific, well-characterized proteins as reference for each subset. a Protein expression profile of DCs using (b) CD1c as a reference (red line in (a)). Protein expression of selected proteins enriched in DCs (c) NMES1 and (d) CD1b across cell types. e Protein expression profile of MΦ using (f) CD163 as a reference profile (red line in (e)). Protein expression of selected proteins enriched in MΦ (g) MS4A6A and (h) FOLR2 across cell types. i Protein expression profile of MCs using (j) carboxypeptidase A (CPA3) as a reference profile (red line in (i)) and expression of selected proteins enriched in MCs (k) LAT2 and (l) SYTL3) across cell types. m Protein expression profile of ETs and DTs using (n) T-cell receptor chain CD3δ as a reference profile (red line in (m)). Protein expression of selected proteins enriched in ETs and DTs (o) PTPRCAP and (p) SEPTIN1 across cell types. q Protein expression profile of ECs using (r) adhesion molecule cadherin 5 (CDH5) as a reference profile (red line in (q)) and bar plots illustrating the expression of selected proteins enriched in ECs (s) DYSF and (t) KANK3 across cell types. u Protein expression profile of melanocytes (Mel) using (v) adhesion molecule melanogenesis pathway member Melan-A (MELAN-A) as a reference profile (red line in (u)) and bar plots illustrating the expression of selected proteins enriched in melanocytes (w) MTURN and (x) CRYM) across cell types. All barplots are presented as mean±SEM, (log2). DC; CD1A+dendritic cells (N = 3), MΦ; macrophages (N = 4), MC; mast cells (N = 6), DT; dermal T cells (N = 6), ET; epidermal T cells (N = 6), EC; endothelial cells (N = 4), Mel; melanocytes (N = 5), Fib; fibroblasts (N = 5), KC; keratinocytes (N = 5). N represents number of biologically independent samples. Source data are provided as a Source Data file.

References

    1. Wang X-N, et al. A three-dimensional atlas of human dermal leukocytes, lymphatics, and blood vessels. J. Invest. Dermatol. 2014;134:965–974. - PMC - PubMed
    1. Heath WR, Carbone FR. The skin-resident and migratory immune system in steady state and memory: innate lymphocytes, dendritic cells and T cells. Nat. Immunol. 2013;14:978–985. - PubMed
    1. Bos JD, et al. The skin immune system (SIS): distribution and immunophenotype of lymphocyte subpopulations in normal human skin. J. Invest. Dermatol. 1987;88:569–573. - PubMed
    1. Clark RA, et al. The vast majority of CLA+ T cells are resident in normal skin. J. Immunol. 2006;176:4431–4439. - PubMed
    1. Dengjel J, Bruckner-Tuderman L, Nyström A. Skin proteomics—analysis of the extracellular matrix in health and disease. Expert Rev. Proteomics. 2020;17:377–391. - PubMed

Publication types