. 2020 Nov 5;11(1):5610.
doi: 10.1038/s41467-020-19273-z.

Intraspecific host variation plays a key role in virus community assembly

Affiliations

Intraspecific host variation plays a key role in virus community assembly

Suvi Sallinen et al. Nat Commun. .

Abstract

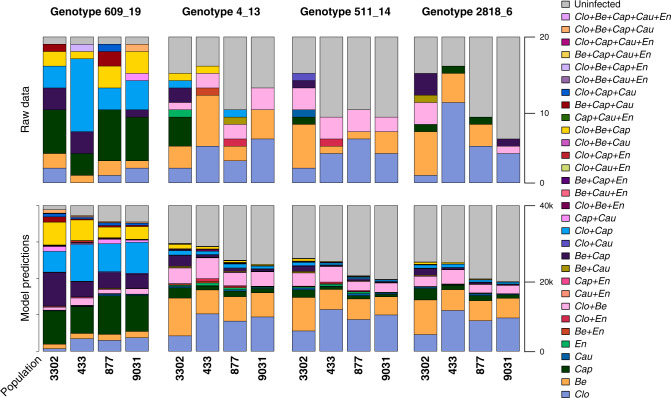
Infection by multiple pathogens of the same host is ubiquitous in both natural and managed habitats. While intraspecific variation in disease resistance is known to affect pathogen occurrence, how differences among host genotypes affect the assembly of pathogen communities remains untested. In our experiment using cloned replicates of naive Plantago lanceolata plants as sentinels during a seasonal virus epidemic, we find non-random co-occurrence patterns of five focal viruses. Using joint species distribution modelling, we attribute the non-random virus occurrence patterns primarily to differences among host genotypes and local population context. Our results show that intraspecific variation among host genotypes may play a large, previously unquantified role in pathogen community structure.


Conflict of interest statement

The authors declare no competing interests.

Figures

Fig. 1
Fig. 1. Virus infections in sentinel plants.
Infections are plotted by population (a) and genotype (b), and the locations of the study populations in the field experiment in the Åland Islands (c). The genotypes and populations are ordered from left to right according to decreasing overall number of infections. ‘Clo’ refers to Plantago closterovirus, ‘Be’ to Plantago betapartitivirus, ‘Cap’ to Plantago lanceolate latent virus, ‘Cau’ to Plantago latent caulimovirus, and ‘En’ refers to Plantago enamovirus.
Fig. 2
Fig. 2. (Co-)infections in the original data (upper panel) and predicted coinfections (lower panel) based on the model variant 2, ordered by host genotypes and population, as indicated by the X-axis.
Both the genotypes and populations are ordered with respect to frequency, so that the bars on the left-hand side show the population and genotype with the highest total amount of virus infection. ‘Clo’ refers to Plantago closterovirus, ‘Be’ to Plantago betapartitivirus, ‘Cap’ to Plantago lanceolate latent virus, ‘Cau’ to Plantago latent caulimovirus, and ‘En’ refers to Plantago enamovirus. The total number of plants in the upper panel is 20, whereas in the lower panel the total number is simulated plants is 20 (original number of plants) times 2000 (number of MCMC iterations used for the simulation), resulting in 40,000 simulated plants.
Fig. 3
Fig. 3. Co-occurrences between virus species.
Co-occurrences are shown either in the whole data set (left, with total number of sentinel plants 320), or per plant genotype (upper panels, 80 plants per genotype), or by population (lower panels, 80 plants per population) as denoted by the horizontal axis. The genotypes and populations are ordered from left to right according to decreasing the overall frequency of disease. The plus (and minus) signs denote the pairs, for which the observed values were higher (or lower, respectively) than what would be expected based on their overall frequencies, and for which the probability of this difference was <0.1. The line colours denote the true numbers of co-occurrences between the species, as shown in the legend. ‘Clo’ refers to Plantago closterovirus, ‘Be’ to Plantago betapartitivirus, ‘Cap’ to Plantago lanceolate latent virus, ‘Cau’ to Plantago latent caulimovirus, and ‘En’ refers to Plantago enamovirus. The exact probabilities for the focal pairs are provided in the Supplementary Table 3.
Fig. 4
Fig. 4. Partitioning of the variance explained by model variant 2 (Table 1).
The diagram overlays the average proportions (over species) of variance explained by different groups of explanatory variables (out of the total variation explained by the model) and the concept of the disease triangle. The legend labels denote the different variables for which the partitioning is calculated, and the percentages indicate the mean values for the whole community. The barplot gives these results separately for each virus: the horizontal axis shows the focal five viruses (ordered from left to right according to their decreasing overall infection rate) and the vertical axis shows the proportion of variance explained. ‘Clo’ refers to Plantago closterovirus, ‘Be’ to Plantago betapartitivirus, ‘Cap’ to Plantago lanceolate latent virus, ‘Cau’ to Plantago latent caulimovirus, and ‘En’ refers to Plantago enamovirus.

References

    1. Dobson A, Lafferty KD, Kuris AM, Hechinger RF, Jetz W. Homage to Linnaeus: How many parasites? How many hosts? Proc. Natl Acad. Sci. USA. 2008;105:11482–11489. - PMC - PubMed
    1. Kreuze JF, et al. Complete viral genome sequence and discovery of novel viruses by deep sequencing of small RNAs: a generic method for diagnosis, discovery and sequencing of viruses. Virology. 2009;388:1–7. - PubMed
    1. Prendeville HR, Ye X, Jack Morris T, Pilson D. Virus infections in wild plant populations are both frequent and often unapparent. Am. J. Bot. 2012;99:1033–1042. - PubMed
    1. Treena IB. Distribution and diversity of phytophthora across Australia distribution and diversity of phytophthora across Australia. Pac. Conserv. Biol. 2017;23:1–13.
    1. Anderson, R. M. & May, R. M. Infectious Diseases of Humans; Dynamics and Control (1991).

Publication types