. 2020 Nov 5;11(1):5604.
doi: 10.1038/s41467-020-19356-x.

Regionalized tissue fluidization is required for epithelial gap closure during insect gastrulation

Affiliations

Regionalized tissue fluidization is required for epithelial gap closure during insect gastrulation

Akanksha Jain et al. Nat Commun. .

Abstract

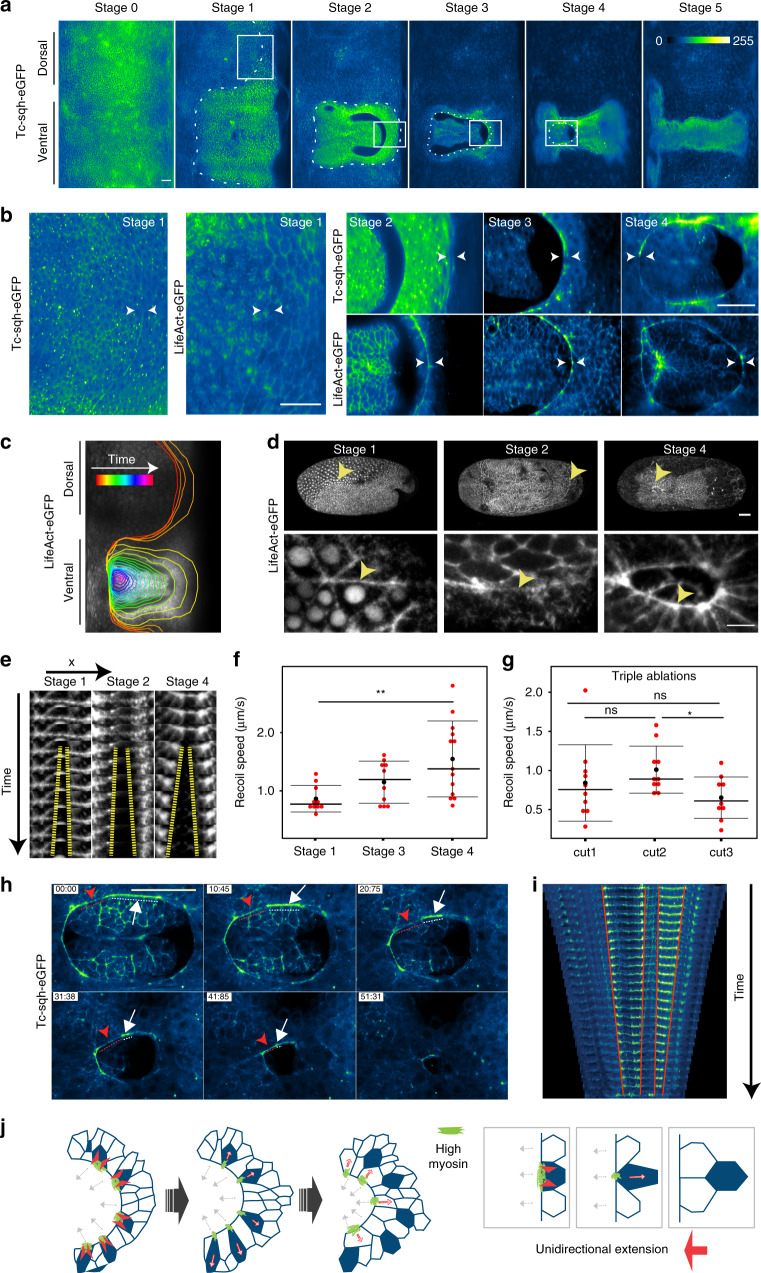
Many animal embryos pull and close an epithelial sheet around the ellipsoidal egg surface during a gastrulation process known as epiboly. The ovoidal geometry dictates that the epithelial sheet first expands and subsequently compacts. Moreover, the spreading epithelium is mechanically stressed and this stress needs to be released. Here we show that during extraembryonic tissue (serosa) epiboly in the insect Tribolium castaneum, the non-proliferative serosa becomes regionalized into a solid-like dorsal region with larger non-rearranging cells, and a more fluid-like ventral region surrounding the leading edge with smaller cells undergoing intercalations. Our results suggest that a heterogeneous actomyosin cable contributes to the fluidization of the leading edge by driving sequential eviction and intercalation of individual cells away from the serosa margin. Since this developmental solution utilized during epiboly resembles the mechanism of wound healing, we propose actomyosin cable-driven local tissue fluidization as a conserved morphogenetic module for closure of epithelial gaps.


Conflict of interest statement

The authors declare no competing interests.

Figures

Fig. 1
Fig. 1. Quantitative analysis of Tribolium serosa expansion.
a Schematic depiction of the geometric constraints experienced by a tissue expanding over a spherical yolk cell. The leading edge undergoes an area increase followed by an area decrease after it crosses the equator. b Illustrations of the stages of Tribolium embryogenesis from cellular blastoderm to serosa window closure. c 3D renderings of a Tribolium embryo expressing the fluorescent H2A-eGFP nuclear marker reconstructed from a multi-view time-lapse SPIM recording. The embryo is shown from the lateral and ventral views at the six reference stages corresponding to the schematics in b. All imaged embryos in this and other panels are shown with anterior to the left, and all time stamps are in hh:mm. Scale bar is 50 µm. N = 1 (2 datasets available). d 2D cartographic projections at reference stages of a 4D SPIM recording of a Tribolium embryo expressing EFA-nGFP. The extent of the serosal tissue is highlighted in turquoise. Scale bar is approximately 100 µm (see “Methods”). N = 1. e The area of the serosal tissue calculated from cartographic projections of 4D SPIM recordings. The data are normalized to the total serosa area at Stage 5 in each case. For every stage, the total serosa area is calculated for all time points between two consecutive stages in three different embryos and plotted as a distribution. Plots in this and all other panels indicate the median with a thick line, the mean with a black dot, and the standard deviation (s.d.) with the thin error bars. N = 3. f Comparison of the distributions of apical areas of cells sampled from confocal recordings of Tribolium embryos expressing the cortical LifeAct-eGFP actin marker at reference stages labeled according to b. The number of cells (n) and the number of embryos (N) sampled at different stages were in the dorsal region Stage 0 n = 58 and N = 6, Stage 1 n = 116 and N = 11, Stage 2 n = 66 and N = 9, Stage 3 n = 39 and N = 6, Stage 4 n = 76 and N = 10, and in the ventral region Stage 3 n = 52 and N = 7. The normal distribution of the data was tested using Shapiro–Wilk test. Distributions were compared using the non-parametric two-sided Wilcoxon Rank-Sum test (same in all figures unless stated otherwise). p Values between 0.05 and 0.01 are labeled with single asterisk (*), 0.009–0.001 are labeled with double asterisks (**), <0.001 with triple asterisks (***), and ns signifies a non-significant p value (same in all figures). g Cartographic projections at reference stages of a transgenic embryo labeled with LifeAct-eGFP and reconstructed from a multi-view SPIM recording. All serosal cell in each projection were segmented automatically, curated manually, and color coded according to their apical cell area. Red boxes indicate the approximate regions from which cells sampled in confocal datasets were quantified in f. N = 1.
Fig. 2
Fig. 2. Cell behaviors at the serosal edge during window closure.
a Schematic illustration of the putative mechanism of closing serosa window by reducing the number of cells at the leading edge of the window over time. b Plot of the total number of cells at the extraembryonic–embryonic boundary during serosa window closure counted at the five reference stages (N = 4). c Confocal images highlighting the cells (yellow asterisks) forming the leading edge of the serosa window at Stage 3 (top) and Stage 5 (bottom). Scale bars are 10 µm. N = 1 (2 datasets available). d Cartographic projections of an embryo expressing Histone-eGFP imaged with multi-view SPIM. Progressively deeper layers of the projections are color coded to distinguish between superficial (green) and internal (magenta) nuclei. The nuclei participating in closing of the serosa window were back-tracked to the uniform blastoderm stage to reveal their spatial origin. Tracks are color coded by time as indicated by the color scale. Scale bar is approximately 100 µm. N = 1 (3 datasets available). e Frames from a confocal recording of serosa window closure in embryos expressing LifeAct-eGFP. Selected tracked cells at the leading edge of the serosa window are outlined and colored to show that they shrink their serosa-window-facing edges and planarly intercalate into the serosal epithelium. Scale bar is 50 µm. N = 1 (2 datasets available). f Close-ups of the cells inside the red boxes in e. Scale bar is 10 µm. g Segmented cartographic projections as in Fig. 1g with serosal cells color coded according to their shape index values. White boxes indicate the approximate regions from which cells sampled in confocal datasets were quantified in i. N = 1. h Cartographic projections of an embryo injected with LifeAct-eGFP mRNA shown at the beginning (left) and toward the end (right) of serosa window closure. Indicated rows of cells were tracked over time and color coded to visualize the difference in the extent of neighbor exchange between the dorsal cells and ventral cells close to the leading edge of the serosa. Scale bar is approximately 100 µm. N = 1. i Distributions of shape indices of segmented cells in Stages 0–4 in transgenic LifeAct-eGFP embryos imaged with confocal microscopy. Numbers of cells and embryos are the same as in Fig. 1f.
Fig. 3
Fig. 3. Tension landscape in the expanding serosa.
a Tissue laser ablations in the dorsal serosa at different reference stages using a two-photon laser ablation set-up. Images show the serosal tissue before (top) and after (bottom) laser ablation in Stage 1 and Stage 3 embryos expressing LifeAct-eGFP and EFA-nGFP. Ablations were oriented perpendicular to the anterior–posterior axis of the embryo and yellow ellipses show the extent of the cut. The colored lines highlight the displacement of the severed cell edges. Time stamps are mm:ss. Scale bar is 50 µm. Stage 1 N = 1, Stage 3 N = 1. b Tissue laser ablations in the dorsal and ventral regions of the serosa using a UV laser ablation set-up. Images show the serosal tissue before (top) and after (bottom) laser ablation in Stage 3 embryos expressing LifeAct-eGFP. Ablations were oriented perpendicular to the anterior–posterior axis of the embryo. The position of the cuts in a and b are indicated with red boxes in the embryo illustrations below c, d yellow ellipses show the extent of the cut. Annotations are as in a. Time stamps are mm:ss. Scale bar is 50 µm. Dorsal Stage 3 N = 1, Ventral Stage 3 N = 1. c Graph showing the recoil velocities after laser ablations using a two-photon laser in Stage 1, 3, and 4 embryos. Each dot represents one cut in one embryo inflicted in the dorsal serosal region indicated by the red boxes in the reference illustrations below the graph. The number of embryos (N) sampled at different stages were as follows: Stage 1 N = 11, Stage 3 N = 6, Stage 4 N = 5. d Graph showing the recoil velocities after laser ablations using a UV laser of serosal cells in Stage 3 embryos. Each dot represents one cut in one embryo inflicted in the dorsal or ventral serosal region indicated by the red boxes in the reference illustrations below the graph. The number of embryos (N) sampled were as follows: Dorsal N = 15, Ventral N = 10. Distributions were compared using Welch’s unpaired t test. e Segmented cartographic projections as in Figs. 1g and 2g with serosal cells color coded according to their tissue fluidity values measured by subtracting the local solid-to-fluid transition shape index threshold (blue curve in f) from the cell shape index for each segmented cell (see “Methods” section “Shape index analysis”). Positive values indicate fluid-like and negative values solid-like properties. f Scatter plots of cell shape alignment index (x-axis) and shape index (y-axis) values of individual cells in the maps shown in e. The cells are color coded according to their distance from the center of the serosa window. The blue line indicates theoretically predicted threshold value of shape index signifying solid-to-fluid structural transition. Points below the line indicate solid-like cells and points above the line fluid-like cells (see “Methods” section “Shape index analysis”).
Fig. 4
Fig. 4. Cell eviction by a heterogeneous actomyosin cable at the serosal edge during window closure.
a Cartographic projections of Tribolium embryos injected with Tc-sqh-eGFP mRNA and imaged with multi-view SPIM. The accumulation of myosin at the extraembryonic–embryonic boundary is highlighted by the dotted line as it emerges around the egg circumference (Stage 1) and then during its progressive constriction on the ventral side of the embryo (Stages 2–5). Scale bar is approximately 50 µm. Intensity in all panels is color coded with the Green (high)–Blue (low) LUT. N = 1 (3 datasets available). b Insets show zoomed-in images of Tc-sqh-eGFP localization in the regions marked by white boxes in a and similar images from cartographic projections of an embryo injected with LifeAct-eGFP mRNA and imaged with multi-view SPIM (N = 1, 2 datasets available). Actomyosin enrichment is shown between the arrowheads. c The shape of the actomyosin cable in a map-projected LifeAct-eGFP SPIM recording is outlined over time as it emerges dorsally and closes on the ventral side of the embryo. The color of the outline corresponds to the time stamp of the frame from which it was traced. N = 1. d Maximum intensity projections of confocal stacks of embryos expressing LifeAct-eGFP from three different developmental stages. Arrowheads point to the regions of the cable that was ablated. Stage 1 images are lateral views and Stage 2 and 4 images ventral views. Bottom row shows close-ups of areas marked by arrows in the top row. Scale bars are 50 µm in top panels and 10 µm in bottom panels. Stage 1 N = 1, Stage 2 N = 1, Stage 4 N = 1. e Kymograph of the recoiling membrane edges (yellow hyphen) after laser ablation of the cells forming the actomyosin cable at the leading edge of the serosa window. Stage 1 N = 1, Stage 2 N = 1, Stage 4 N = 1. f The distributions of recoil velocities after ablation of the cable-forming cells at different stages. The number of embryos (N) sampled at different stages were as follows: Stage 1 N = 10, Stage 3 N = 10, Stage 4 N = 13. Distributions were compared using Welch’s unpaired t tests. g The distributions of recoil velocities after three successive laser ablations of three distinct cable-forming cell edges in a single cable at Stage 4. The number of embryos (N) and successive cuts (n) were as follows: N = 10, cut1 n = 10, cut2 n = 10, cut3 n = 10. Distributions were compared using Welch’s unpaired t tests. h Images from a time-lapse confocal recording of a Tc-sqh-eGFP transgenic embryo. Myosin localization at the cable varies between different cable-forming cells. A cell with high myosin accumulation is labeled with white arrow and its extent is highlighted with white dotted line. A cell with low myosin is labeled similarly but in red. Time stamps are mm:ss. Scale bar is 10 µm. N = 1 (5 datasets available). i Kymograph of myosin cable shown in h. The cable was segmented manually and straightened computationally in Fiji. j Illustration shows the differential contraction of the serosa-window-facing cell edges depending on the amount of myosin. This leads to T1 transitions in the serosa (right). As a result, the leading edge of serosa extends unidirectionally (gray arrows) and at the same time undergoes structural rearrangement. Green color depicts the myosin enriched in the contracting cells (red arrowheads).
Fig. 5
Fig. 5. Cell and tissue dynamics in Tc-zen1 knock-down embryos.
a Maximum intensity projections of a parental Tc-zen1RNAi embryo labeled with LifeAct-eGFP and imaged with confocal microscopy. Arrows point to the open serosa window in the head and the posterior region. Time stamps are hh:mm. Scale bar is 50 µm. N = 1 (2 datasets available). b Selected maximum intensity projection images from wild-type (top) and parental Tc-zen1RNAi (bottom) embryos at Stage 3. Insets show the cable in wild-type embryos (arrow) and absence of the cable in the knock-down (*). Scale bars are 50 µm. Wild type N = 1, Tc-zen1RNAi N = 1. c Distribution of apical cell areas in wild-type (left) and embryonic Tc-zen1RNAi (right) embryos sampled from confocal datasets in the dorsal serosa at Stage 3. The number of cells (n) and embryos (N) sampled are n = 39 and N = 6 wild-type embryos and n = 55 and N = 7 Tc-zen1RNAi embryos. d Distribution of apical cell areas in wild-type (left) and embryonic Tc-zen1RNAi (right) embryos sampled from confocal datasets in the ventral serosa at Stage 3. The number of embryos (N) and cells (n) sampled are n = 52 and N = 7 in wild-type and n = 38 and N = 7 in Tc-zen1RNAi embryos. e Cartographic projections of embryonic Tc-zen1RNAi embryo injected with Gap43-eYFP mRNA reconstructed from a multi-view SPIM recording. Time stamps are hh:mm. Scale bar is approximately 100 µm. N = 1. f Cartographic projections shown in e overlaid with outlines of serosal cells. Serosal cell in each projection were segmented automatically, curated manually, and color coded according to their apical cell area. N = 1. g Segmented cartographic projections as in f color coded according to the shape index of the segmented serosal cells. h Distribution of shape indices in wild-type and Tc-zen1RNAi embryos sampled from confocal datasets in the dorsal serosa at Stage 3. Numbers of cells and embryos are the same as in c. i Distribution of shape indices in wild-type and Tc-zen1RNAi embryos sampled from confocal datasets in the ventral serosa at Stage 3. Numbers of cells and embryos are the same as in d. j Segmented cartographic projections as in f, g color coded according to the tissue fluidity values of the segmented serosal cells (see “Methods” section “Shape index analysis”).

References

    1. Solnica-Krezel L. Conserved patterns of cell movements during vertebrate gastrulation. Curr. Biol. 2005;15:R213–R228. doi: 10.1016/j.cub.2005.03.016. - DOI - PubMed
    1. Keller RE, Trinkaus JP. Rearrangement of enveloping layer cells without disruption of the epithelial permeability barrier as a factor in fundulus epiboly. Dev. Biol. 1987;120:12–24. doi: 10.1016/0012-1606(87)90099-6. - DOI - PubMed
    1. Köppen M. Coordinated cell-shape changes control epithelial movement in zebrafish and Drosophila. Development. 2006;133:2671–2681. doi: 10.1242/dev.02439. - DOI - PubMed
    1. Campinho P, et al. Tension-oriented cell divisions limit anisotropic tissue tension in epithelial spreading during zebrafish epiboly. Nat. Cell Biol. 2013;15:1405–1414. doi: 10.1038/ncb2869. - DOI - PubMed
    1. Behrndt M, et al. Forces driving epithelial spreading in zebrafish gastrulation. Science. 2012;338:257–260. doi: 10.1126/science.1224143. - DOI - PubMed

Publication types