. 2020 Nov 5;11(1):5614.
doi: 10.1038/s41467-020-19436-y.

Protrudin functions from the endoplasmic reticulum to support axon regeneration in the adult CNS

Affiliations

Protrudin functions from the endoplasmic reticulum to support axon regeneration in the adult CNS

Veselina Petrova et al. Nat Commun. .

Abstract

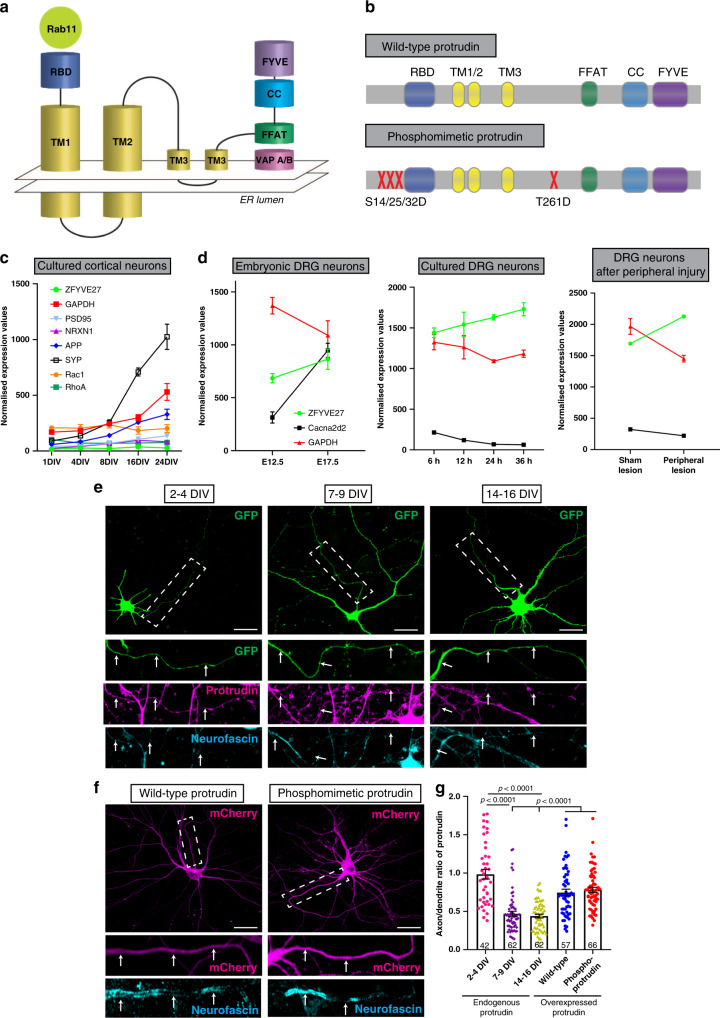
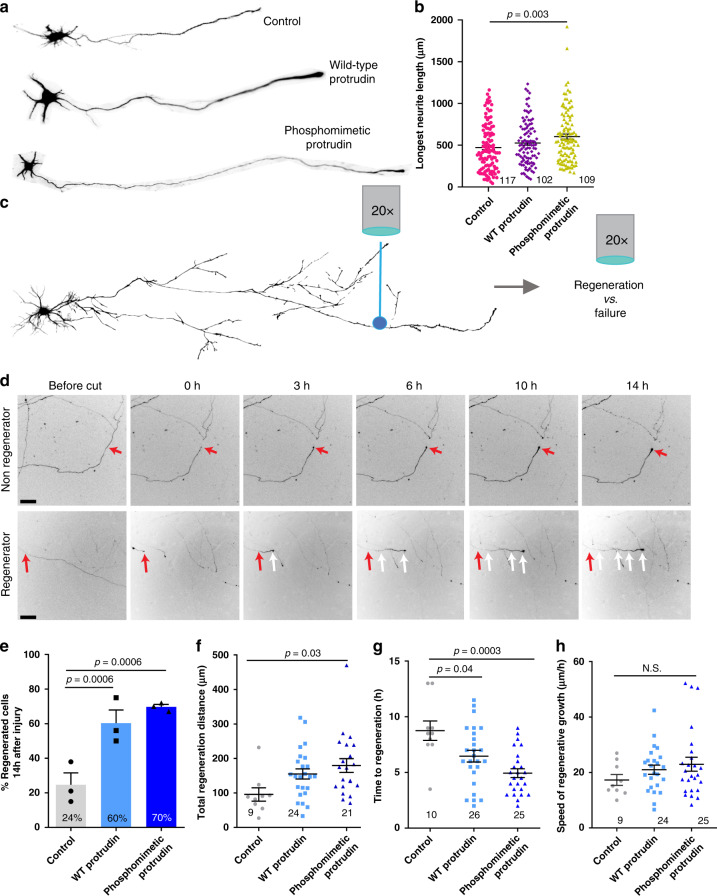
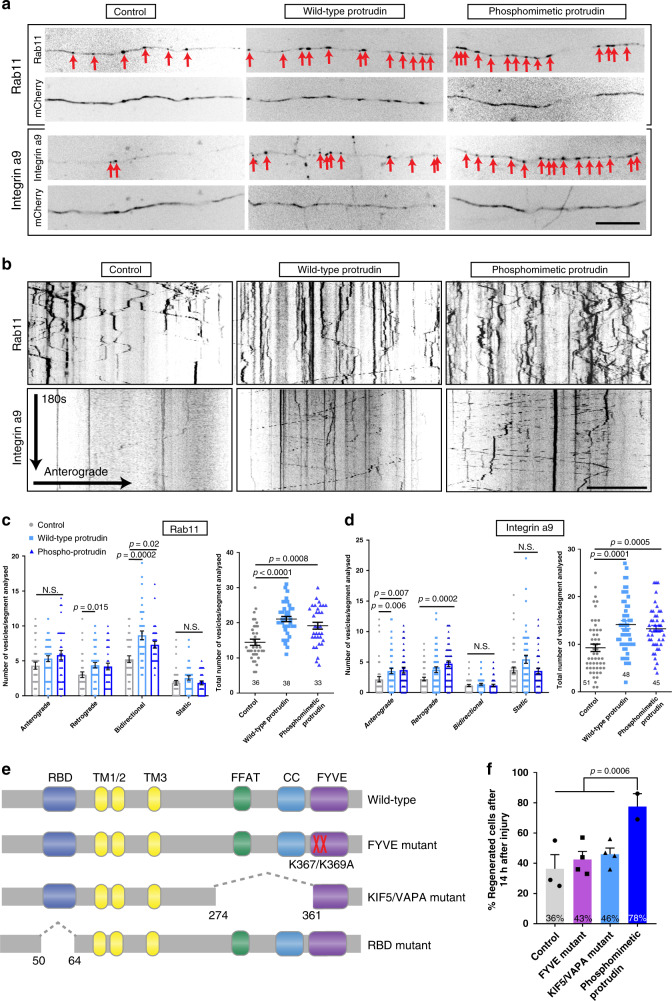
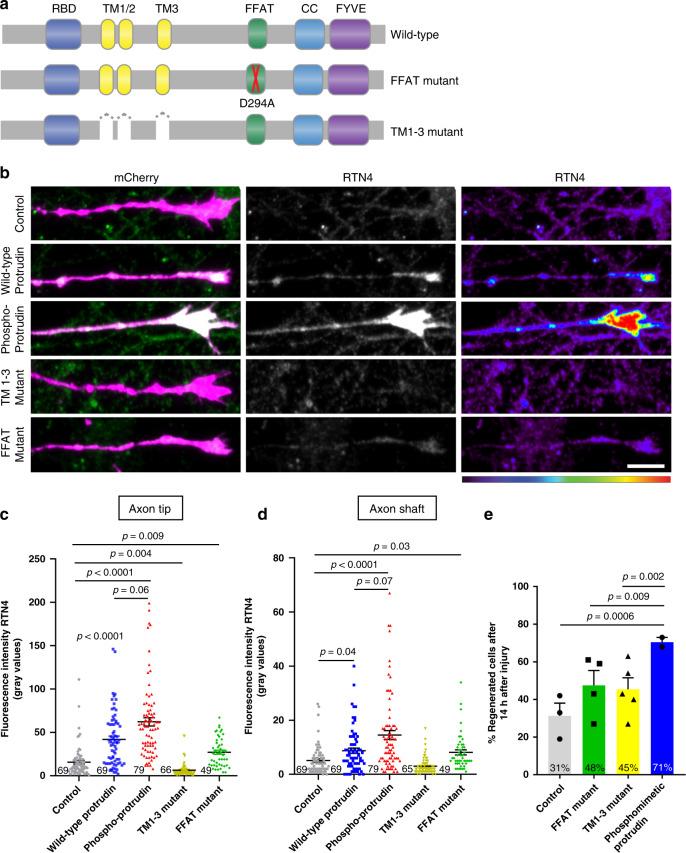
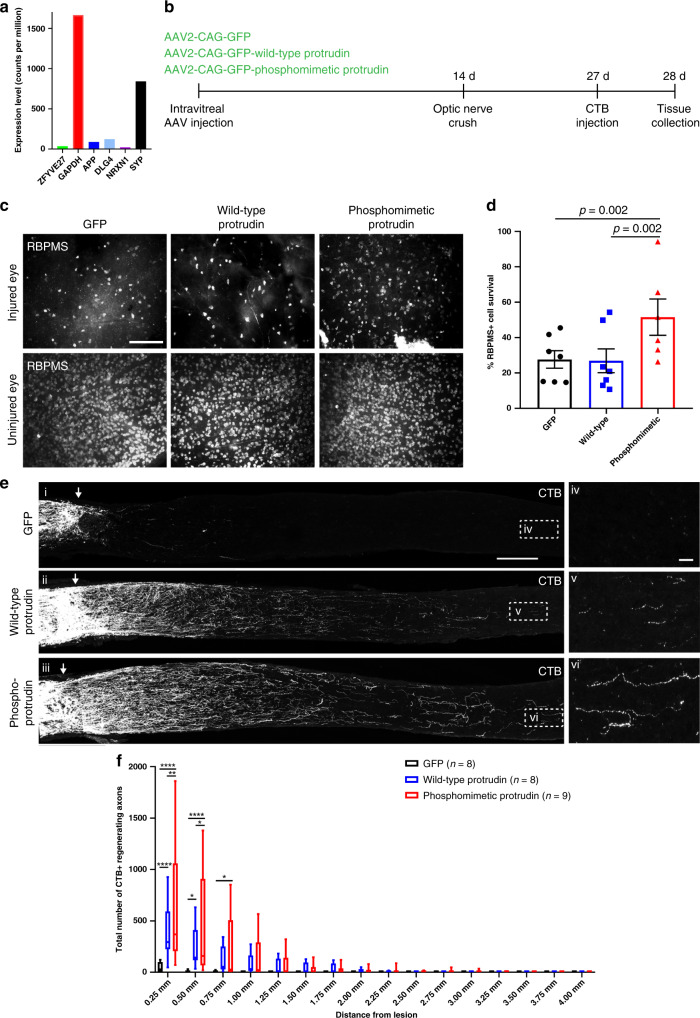
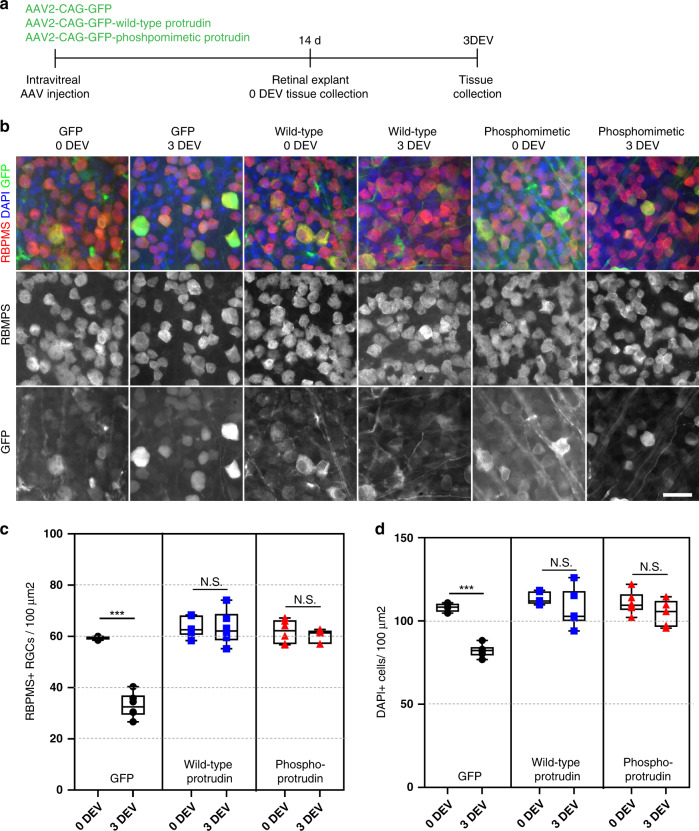
Adult mammalian central nervous system axons have intrinsically poor regenerative capacity, so axonal injury has permanent consequences. One approach to enhancing regeneration is to increase the axonal supply of growth molecules and organelles. We achieved this by expressing the adaptor molecule Protrudin which is normally found at low levels in non-regenerative neurons. Elevated Protrudin expression enabled robust central nervous system regeneration both in vitro in primary cortical neurons and in vivo in the injured adult optic nerve. Protrudin overexpression facilitated the accumulation of endoplasmic reticulum, integrins and Rab11 endosomes in the distal axon, whilst removing Protrudin's endoplasmic reticulum localization, kinesin-binding or phosphoinositide-binding properties abrogated the regenerative effects. These results demonstrate that Protrudin promotes regeneration by functioning as a scaffold to link axonal organelles, motors and membranes, establishing important roles for these cellular components in mediating regeneration in the adult central nervous system.


Conflict of interest statement

Authors declared no competing interests.

Figures

Fig. 1
Fig. 1. Protrudin is expressed at low levels in mature axons and overexpression restores this deficit.
a Schematic diagram of Protrudin’s domains and structure. b Schematic of wild-type and phosphomimetic Protrudin mutagenesis sites. c mRNA expression levels of six neuronal genes (including Zfyve27—the Protrudin gene) from different stages of development in primary rat cortical neurons in vitro (n = 5–6 samples). d Normalized expression levels of Protrudin and other related genes during embryonic development in the mouse (n = 3 animals for each timepoint), after plating DRG neurons in vitro (n = 3 animals for each timepoint) or after peripheral nerve injury in DRG cells (n = 3 animals for sham and injured samples). e Immunofluorescent images of Protrudin in the proximal axons (white dotted line box) of neurons at different stages of development in culture. Scale bars are 20 µm. The white arrows follow the course of the proximal axon. f Immunofluorescent images of overexpressed, mCherry-tagged wild-type or phosphomimetic Protrudin (magenta) and staining for the axon initial segment marker—neurofascin (cyan). Scale bars are 20 µm. g The axon-to-dendrite ratio of Protrudin at different developmental stages or after overexpression at 14–16 DIV (n = 4 independent experiments for each condition, n numbers on graph show the number of analysed cells) (Kruskal–Wallis with Dunn’s multiple comparison test, p < 0.0001, Kruskal–Wallis statistic = 101.6). Error bars represent mean ± SEM.
Fig. 2
Fig. 2. Protrudin overexpression has a modest effect on initial neurite outgrowth but is a strong promoter of axon regeneration after laser axotomy.
a Example neurons at 4 DIV overexpressing control construct, wild-type or phosphomimetic Protrudin. b The average length of the longest neurite in each condition (n = 3 independent experiments; 117 control, 102 WT and 109 phosphomimetic Protrudin cells were analysed, p = 0.006, Kruskal–Wallis with Dunn’s multiple comparison test, Kruskal–Wallis statistic = 10.34). Error bars represent mean ± SEM. c Diagram of the laser axotomy method. d Representative images show a regenerating and a non-regenerating axon over 14 h post laser axotomy. The red arrows at 0 h post injury shows the point of injury. The white arrows trace the path of a regenerating axon. Scale bars are 50 µm. e Percentage of regenerating axons overexpressing either mCherry control (n = 3 independent experiments, 45 neurons), mCherry wild-type Protrudin (n = 3 independent experiments, 45 neurons) or mCherry phosphomimetic Protrudin (n = 3 independent experiments, 39 neurons) (Fisher’s exact test with analysis of stack of p values and Bonferroni–Dunn multiple comparison test). Error bars represent mean ± SEM. f Quantification of regeneration distance 14 h after injury of control (n = 9 cells), WT (n = 24 cells) and phosphomimetic Protrudin (n = 21 cells) axons (n = 3 independent experiments, One-way ANOVA, p = 0.04, F statistic = 3.618). Error bars represent mean ± SEM. g Quantification of regeneration initiation time of control (n = 10 cells), WT (n = 26 cells) and phosphomimetic Protrudin (n = 25 cells) axons (n = 3 independent experiments, One-way ANOVA, p = 0.0004, F statistic = 9.076). Error bars represent mean ± SEM. h Quantification of the speed of regeneration of control (n = 9 cells), WT (n = 24 cells) and phosphomimetic Protrudin (n = 25 cells) axons (n = 3 independent experiments One-way ANOVA, p = 0.348, F statistic = 1.078). Error bars represent mean ± SEM.
Fig. 3
Fig. 3. Protrudin enhances the transport of growth machinery and receptors in the distal axon, and its involvement in axon transport is required for axon regeneration.
a Representative distal axon sections of neurons expressing integrin α9-GFP or Rab11-GFP, together with either mCherry (control), mCherry-wild-type Protrudin or mCherry-phosphomimetic Protrudin. Scale bar is 20 µm. b Kymographs showing the dynamics of integrin α9-GFP and Rab11-GFP in distal axons of co-transfected neurons. Scale bar is 10 µm. c Quantification of Rab11-GFP axon vesicle dynamics and total number of Rab11 GFP vesicles in distal axon sections (n = 3 independent experiments) (for transport, Kruskal–Wallis with Dunn’s multiple comparison test was used; anterograde—p = 0.175, Kruskal–Wallis statistic = 3.489; retrograde—p = 0.02, Kruskal–Wallis statistic = 8.197, bidirectional—p = 0.0002, Kruskal–Wallis statistic = 16.60, static—p = 0.105, Kruskal–Wallis statistic = 4.499; for total number of vesicles, one-way ANOVA was used—p < 0.0001, F statistic = 15.68). Error bars represent mean ± SEM. d Quantification of integrin α9-GFP axon vesicle dynamics and total number of integrin α9-GFP vesicles in distal axon sections (n = 3 independent experiments) (for transport, Kruskal–Wallis with Dunn’s multiple comparison test was used; anterograde—p = 0.002, Kruskal–Wallis statistic = 12.57; retrograde—p = 0.0003, Kruskal–Wallis statistic = 16.64, bidirectional—p = 0.271, Kruskal–Wallis statistic = 2.610, static—p = 0.051, Kruskal–Wallis statistic = 5.951; for total number of vesicles—p < 0.0001, Kruskal–Wallis statistic = 21.81). Error bars represent mean ± SEM. e Schematic representation of Protrudin transport domain mutants. f Percentage of regenerating axons in neurons expressing mCherry-Protrudin domain mutants—FYVE (n = 4 independent experiments, 56 neurons) and KIF5/VAPA (n = 4 independent experiments, 56 neurons) compared to phospho-Protrudin as a positive control (n = 2 independent experiments, 24 neurons), and mCherry as a negative control (n = 3 independent experiments, 42 neurons) (Fisher’s exact test with analysis of stack of p values and Bonferroni–Dunn multiple comparison test). Error bars represent mean ± SEM.
Fig. 4
Fig. 4. Protrudin overexpression enhances ER presence at growth cones and this interaction is required for successful axon regeneration.
a Schematic representation of Protrudin endoplasmic reticulum domain mutants. b Representative images of RTN4 immunofluorescence (green) in the distal axon of neurons expressing the indicated m-Cherry Protrudin constructs (magenta). Scale bar is 10 μm. c, d Quantification of RTN4 fluorescence intensity at the axon tip and shaft (p < 0.0001, Kruskal–Wallis with Dunn’s multiple comparisons test). Error bars represent mean ± SEM. e Percentage of regenerating axons in neurons expressing mCherry-Protrudin domain mutants—FFAT (n = 4 independent experiments, 60 neurons) and TM1-3 (n = 5 independent experiments, 45 neurons) compared to phosphomimetic Protrudin as a positive control (n = 2 independent experiments, 21 neurons), and mCherry as a negative control (n = 3 independent experiments, 41 neurons). Error bars represent mean ± SEM.
Fig. 5
Fig. 5. Protrudin enhances regeneration of RGC axons following optic nerve crush.
a Protrudin mRNA levels during the progression of glaucoma in comparison to other neuronal markers. b Experimental timeline for optic nerve crush. c Representative images of retinal wholemounts stained for RBPMS (white) to label retinal ganglion cells in the uninjured and injured for each condition 2 weeks after optic nerve crush. Scale bars are 100 µm. d Quantification of RGC survival 2 weeks post crush. Eyes injected with phosphomimetic Protrudin have a higher percentage of RGC survival (n = 5 animals) compared to control (n = 7 animals, p = 0.007) or wild-type Protrudin (n = 7 animals, p = 0.002) (Fisher’s exact test with analysis of stack of p values and Bonferroni–Dunn multiple comparison test). Error bars represent mean ± SEM. e CTB-labelled axons in the optic nerves of mice transduced with viruses for wild-type Protrudin, phosphomimetic Protrudin and GFP control. Arrows indicate lesion site. Insets (iv-vi) show regenerating axons in the distal optic nerve. Scale bar is 200 μm and on inset is 20 μm (n = 8–9 animals/group). f Quantification of regenerating axons at increasing distances distal to the lesion site, displayed as mean ± SEM. Statistical significance was determined by two-way ANOVA with Bonferroni post hoc test for multiple comparisons. **p < 0.005, ***p < 0.001, ****p < 0.0001. Individual p values are as follows: p < 0.0001 for GFP vs. WT and GFP vs. phosphomimetic Protrudin at 0.25 mm, p = 0.003 for WT vs. phosphomimetic Protrudin at 0.25 mm, p = 0.01 for GFP vs. WT at 0.5 mm, p < 0.001 for GFP vs. phosphomimetic Protrudin at 0.5 mm, p = 0.02 for WT vs. phosphomimetic Protrudin at 0.5 mm and p = 0.01 for GFP vs. phosphomimetic Protrudin at 0.75 mm. The box plots show the first and third quartiles (the box limits), the median (horizontal line), and the minimum and maximum values (whiskers).
Fig. 6
Fig. 6. Protrudin is neuroprotective to RGCs and other cell types in the retina after a retinal explant.
a Experimental timeline for retinal explant experiment. b Representative images of RGCs (red for RBPMS) 0 and 3 days ex vivo (DEV) in eyes injected with control virus, wild-type Protrudin or phosphomimetic Protrudin (green for GFP) and stained for DAPI (blue). Scale bar is 20 µm. c Quantification of RGC survival in retinal explant (n = 4–6 animals for each condition) (Two-tailed Student’s t-test). **p < 0.005, ***p < 0.001, ****p < 0.0001. Individual p values are as follows: p < 0.0001 for GFP, p = 0.945 for WT and p = 0.439 for phosphomimetic Protrudin when compared at 0 DEV to 3 DEV. The box plots show the first and third quartiles (the box limits), the median (horizontal line), and the minimum and maximum values (whiskers). The circles, squares and rectangles represent individual data points. d Quantification of DAPI-positive cell survival in retinal explant (n = 4–6 animals for each condition) (Two-tailed Student’s t-test). **p < 0.005, ***p < 0.001, ****p < 0.0001. Individual p values are as follows: p < 0.0001 for GFP, p = 0.234 for WT and p = 0.189 for phosphomimetic Protrudin when compared at 0 DEV to 3 DEV. The box plots show the first and third quartiles (the box limits), the median (horizontal line), and the minimum and maximum values (whiskers). The circles, squares and rectangles represent individual data points.

References

    1. Huebner EA, Strittmatter SM. Axon regeneration in the peripheral and central nervous systems. Results Probl. Cell Differ. 2009;48:339–351. - PMC - PubMed
    1. Nicholls J, Saunders N. Regeneration of immature mammalian spinal cord after injury. Trends Neurosci. 1996;19:229–234. doi: 10.1016/0166-2236(96)10021-7. - DOI - PubMed
    1. Bradke F, Marín O. Editorial overview: development and regeneration: Nervous system development and regeneration. Curr. Opin. Neurobiol. 2014;27:iv–vi. doi: 10.1016/j.conb.2014.05.007. - DOI - PubMed
    1. Tedeschi A, Bradke F. Spatial and temporal arrangement of neuronal intrinsic and extrinsic mechanisms controlling axon regeneration. Curr. Opin. Neurobiol. 2017;42:118–127. doi: 10.1016/j.conb.2016.12.005. - DOI - PubMed
    1. He Z, Jin Y. Intrinsic control of axon regeneration. Neuron. 2016;90:437–451. doi: 10.1016/j.neuron.2016.04.022. - DOI - PubMed

Publication types

MeSH terms