. 2020 Nov 5;10(1):19107.
doi: 10.1038/s41598-020-75847-3.

A multi-disciplinary comparison of great ape gut microbiota in a central African forest and European zoo

Affiliations

A multi-disciplinary comparison of great ape gut microbiota in a central African forest and European zoo

Victor Narat et al. Sci Rep. .

Abstract

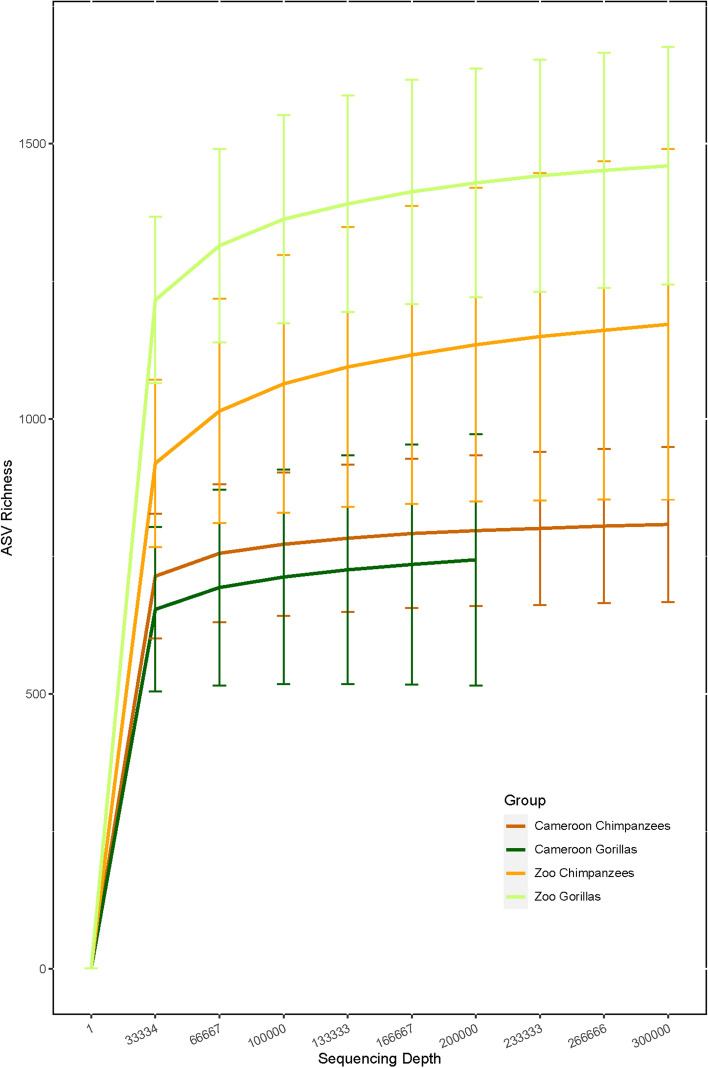
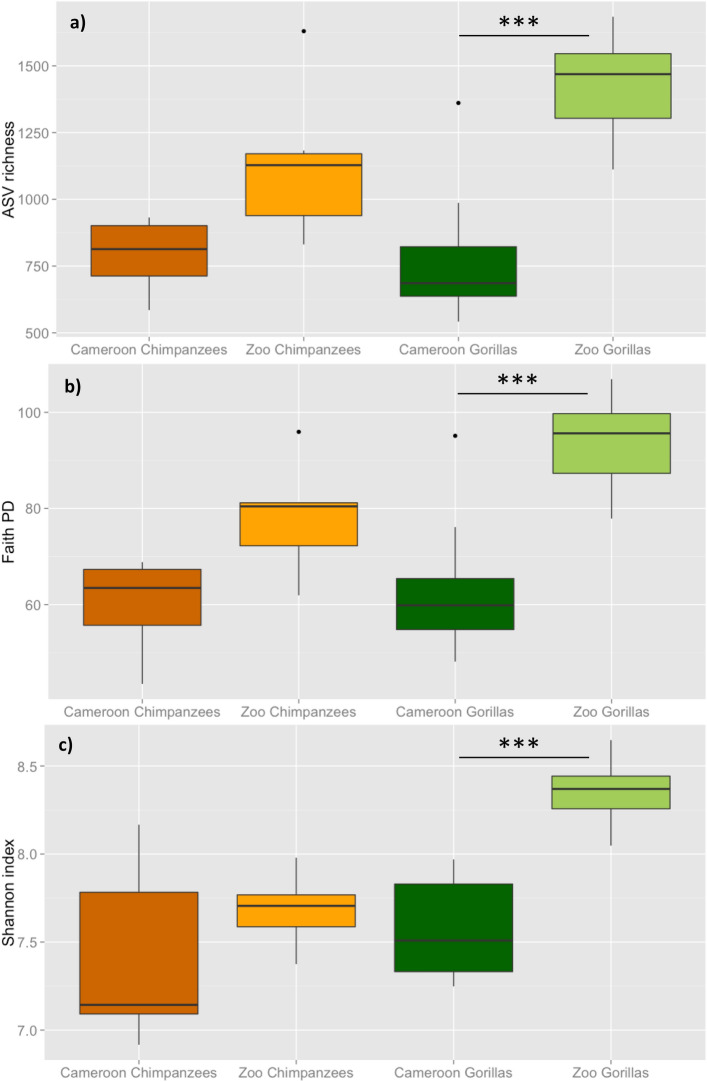
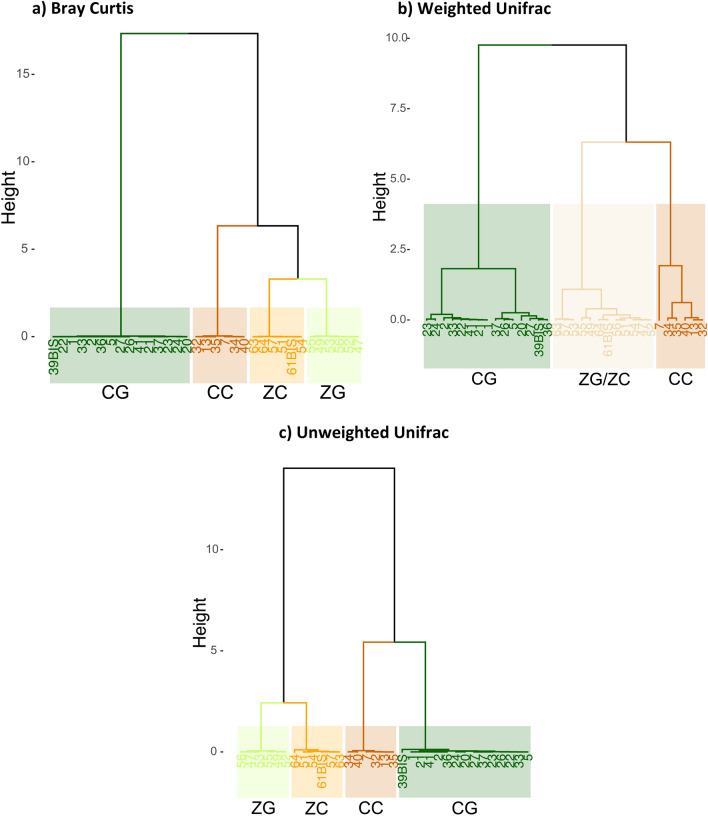
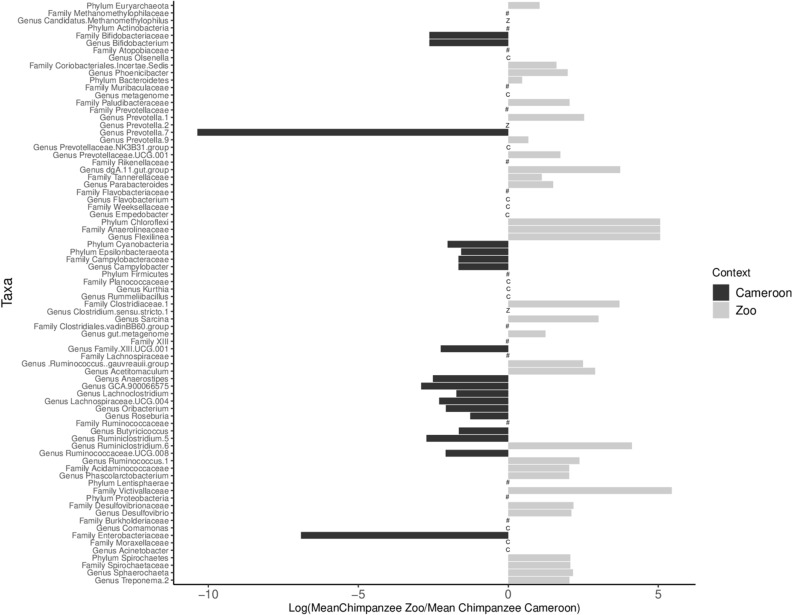
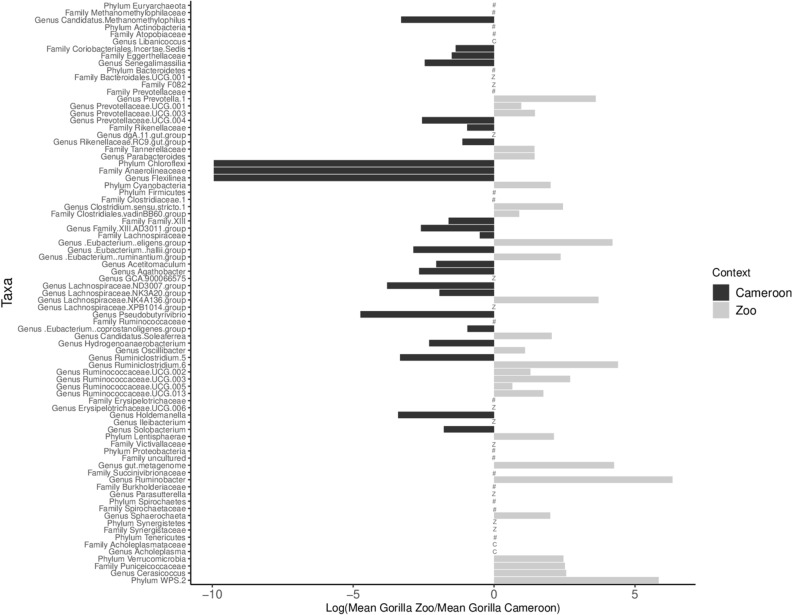
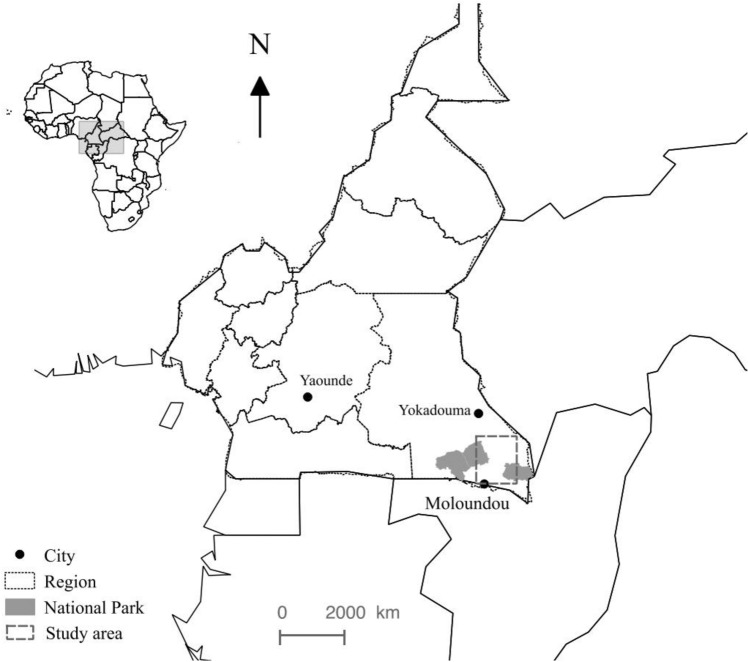
Comparisons of mammalian gut microbiota across different environmental conditions shed light on the diversity and composition of gut bacteriome and suggest consequences for human and animal health. Gut bacteriome comparisons across different environments diverge in their results, showing no generalizable patterns linking habitat and dietary degradation with bacterial diversity. The challenge in drawing general conclusions from such studies lies in the broad terms describing diverse habitats ("wild", "captive", "pristine"). We conducted 16S ribosomal RNA gene sequencing to characterize intestinal microbiota of free-ranging sympatric chimpanzees and gorillas in southeastern Cameroon and sympatric chimpanzees and gorillas in a European zoo. We conducted participant-observation and semi-structured interviews among people living near these great apes to understand better their feeding habits and habitats. Unexpectedly, bacterial diversity (ASV, Faith PD and Shannon) was higher among zoo gorillas than among those in the Cameroonian forest, but zoo and Cameroonian chimpanzees showed no difference. Phylogeny was a strong driver of species-specific microbial composition. Surprisingly, zoo gorilla microbiota more closely resembled that of zoo chimpanzees than of Cameroonian gorillas. Zoo living conditions and dietary similarities may explain these results. We encourage multidisciplinary approach integrating environmental sampling and anthropological evaluation to characterize better diverse environmental conditions of such investigations.


Conflict of interest statement

The authors declare no competing interests.

Figures

Figure 1
Figure 1
Mean rarefaction curves for each group (species/site). Error bars represent standard deviation.
Figure 2
Figure 2
Boxplots of mean alpha diversity among Cameroon and zoo chimpanzees and gorillas for (a) ASV richness, (b) Faith PD index and (c) Shannon index. Pairwise comparisons were performed with Mann–Whitney U test and Bonferroni correction for multiple testing. P < 0.001 (***).
Figure 3
Figure 3
Dendrogram of Principal Component Analysis between samples based on: (a) Bray Curtis distance, (b) Weighted Unifrac distance and (c) Unweighted Unifrac distance. CG, Cameroon gorillas; CC, Cameroon chimpanzees; ZG, zoo gorillas; ZC, zoo chimpanzees.
Figure 4
Figure 4
Phyla, families and genera with significant differences in relative abundance (corrected p-value < 0.05) between zoo (grey) and Cameroon (black) chimpanzees. The horizontal bars represent the ratio transformed in log10. C indicates the presence of taxa found only in Cameroon (absent in the zoo); Z indicates the presence of taxa found only in the zoo (absent in Cameroon); the # indicates no significant difference and the shows only phylum and family of corresponding genera.
Figure 5
Figure 5
Phyla, families and genera with significant differences in relative abundance (corrected p-value < 0.05) between zoo (grey) and Cameroon (black) gorillas. The horizontal bars represent the ratio transformed in log10. C indicates the presence of taxa found only in Cameroon (absent in the zoo); Z indicates the presence of taxa found only in the zoo (absent in Cameroon); the # indicates no significant difference and the shows only phylum and family of corresponding genera.
Figure 6
Figure 6
Location of the study area, southeastern Cameroon. The map was developed with QGIS software v. 3.4.3 (https://qgis.org/fr/site/). Sources of layers: www.wri.org (cities and regions); www.protectedplanet.net (protected areas).

References

    1. Gilbert JA, et al. Current understanding of the human microbiome. Nat. Med. 2018;24:392–400. - PMC - PubMed
    1. Clayton JB, et al. Captivity humanizes the primate microbiome. Proc. Natl. Acad. Sci. USA. 2016;113:10376–10381. - PMC - PubMed
    1. Francino MP. Antibiotics and the human gut microbiome: dysbioses and accumulation of resistances. Front. Microbiol. 2016;6:1543. - PMC - PubMed
    1. Knowles SCL, Eccles RM, Baltrūnaitė L. Species identity dominates over environment in shaping the microbiota of small mammals. Ecol. Lett. 2019;22:826–837. - PubMed
    1. Maurice CF, et al. Marked seasonal variation in the wild mouse gut microbiota. ISME J. 2015;9:2423–2434. - PMC - PubMed

Publication types

Substances