. 2021 Jan;22(1):25-31.
doi: 10.1038/s41590-020-00826-9. Epub 2020 Nov 5.

Distinct antibody responses to SARS-CoV-2 in children and adults across the COVID-19 clinical spectrum

Affiliations

Distinct antibody responses to SARS-CoV-2 in children and adults across the COVID-19 clinical spectrum

Stuart P Weisberg et al. Nat Immunol. 2021 Jan.

Abstract

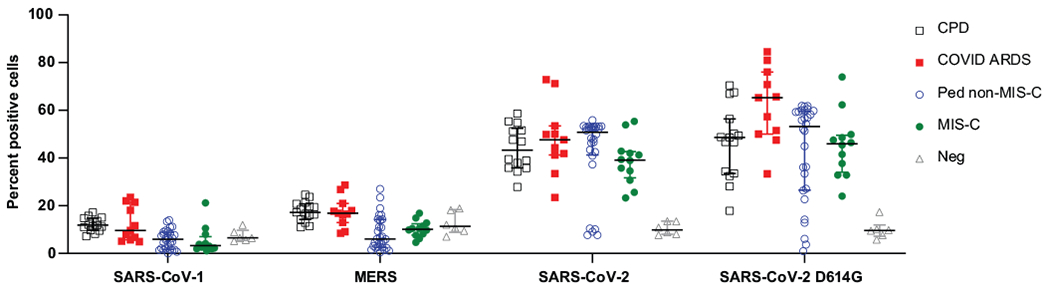
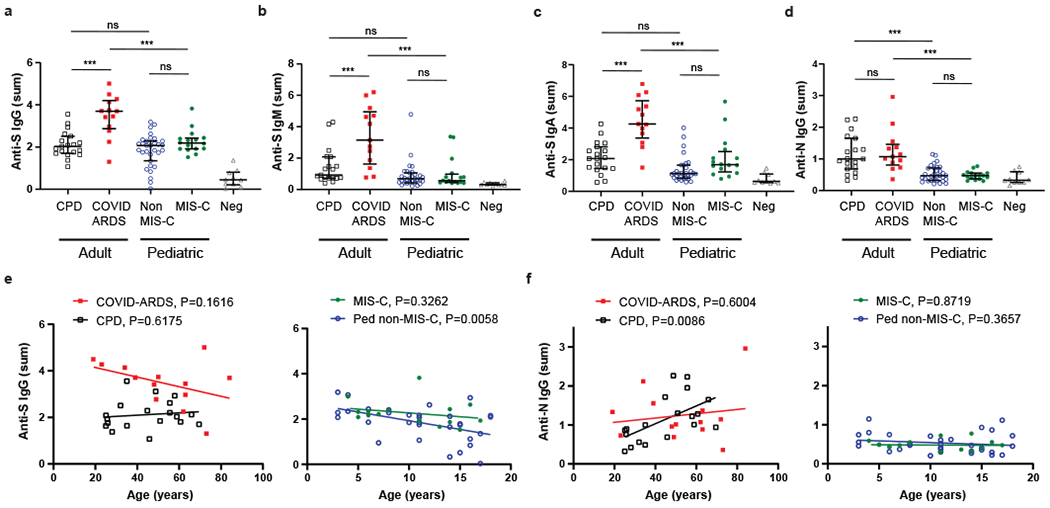
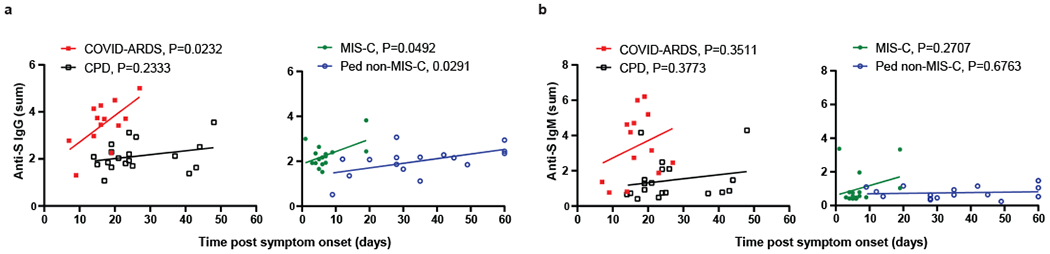
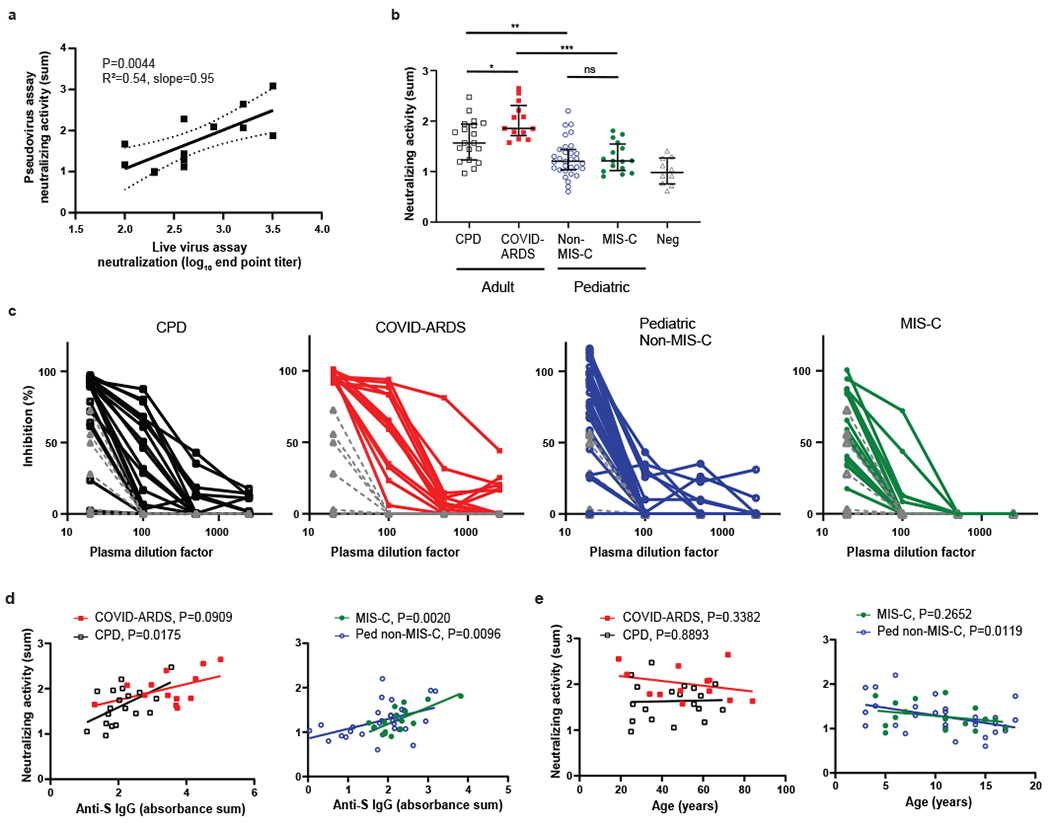
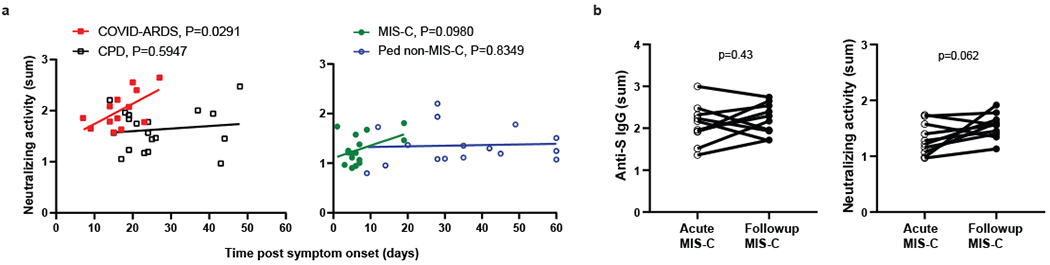
Clinical manifestations of COVID-19 caused by the new coronavirus SARS-CoV-2 are associated with age1,2. Adults develop respiratory symptoms, which can progress to acute respiratory distress syndrome (ARDS) in the most severe form, while children are largely spared from respiratory illness but can develop a life-threatening multisystem inflammatory syndrome (MIS-C)3-5. Here, we show distinct antibody responses in children and adults after SARS-CoV-2 infection. Adult COVID-19 cohorts had anti-spike (S) IgG, IgM and IgA antibodies, as well as anti-nucleocapsid (N) IgG antibody, while children with and without MIS-C had reduced breadth of anti-SARS-CoV-2-specific antibodies, predominantly generating IgG antibodies specific for the S protein but not the N protein. Moreover, children with and without MIS-C had reduced neutralizing activity as compared to both adult COVID-19 cohorts, indicating a reduced protective serological response. These results suggest a distinct infection course and immune response in children independent of whether they develop MIS-C, with implications for developing age-targeted strategies for testing and protecting the population.


Conflict of interest statement

Competing Interests statement

The authors have no conflicts with regard to this work.

Figures

Extended Data Fig. 1
Extended Data Fig. 1. Specificity of subjects’ antibodies for SARS-CoV-2 S protein.
The specificity of antibodies for SARS-CoV-2 S protein compared to SARS-CoV-1 and MERS S protein was assayed in a cell-based IgG binding assay. HEK293T cells were transfected with S protein and its common variants from the indicated coronaviruses. The transfected cells were then incubated with human plasma from the indicated study groups and bound human IgG was detected using fluorescently tagged protein G (Methods). Shown are the percentage of the S protein transfected cells that are positive for human IgG in each patient group: CPD, black squares, n = 19; COVID-ARDS, red squares, n = 13; pediatric non-MIS-C, n = 28; MIS-C, green circles, n = 16; and control plasma from pre-pandemic donors (grey triangles; Neg, n = 6). Black bar indicates the median+interquartile range. P values were calculated by one-way ANOVA with Dunnett’s multiple comparisons test (CPD, SARS-CoV-2 vs. SARS-CoV-1: P = 0, SARS-CoV-2 vs. MERS: P = 0; COVID-ARDS, SARS-CoV-2 vs. SARS-CoV-1: P = 0, SARS-CoV-2 vs. MERS: P = 0; Ped non-MIS-C, SARS-CoV-2 vs. SARS-CoV-1: P = 0, SARS-CoV-2 vs. MERS: P = 0; MIS-C, SARS-CoV-2 vs. SARS-CoV-1: P = 0, SARS-CoV-2 vs. MERS: P = 0; Negative control, SARS-CoV-2 vs. SARS-CoV-1: P = 0.32, SARS-CoV-2 vs. MERS: P = 0.52).
Figure 1.
Figure 1.. Children with and without MIS-C exhibit distinct SARS-CoV-2 antibody profiles compared to adults with COVID-19.
Levels of antibodies to SARS-CoV-2 spike (S) and nucleocapsid (N) proteins were measured using serial dilutions of patient plasma in an indirect ELISA assay to detect anti-S IgG (a), anti-S IgM (b), anti-S Ig A (c) and anti-N IgG (d). Shown is the absorbance sum across 6 serial 1:4 plasma dilutions from adult convalescent plasma donors (CPD, open black squares, n=19); adult patients with COVID-19 induced acute respiratory distress syndrome (COVID-ARDS, closed red squares, n=13); pediatric patients with a history of SARS-CoV-2 infection but not MIS-C (Non-MIS-C, open blue circles, n=31); patients with MIS-C (MIS-C, closed green circles, n=16); and control plasma from pre-pandemic donors (Neg, grey triangles, n=10). Black bar indicates the median+interquartile range. P values were calculated by one-way ANOVA with Sidak’s multiple comparisons test. Anti-S IgG (a), CPD vs. COVID ARDS: P=1.32x10⁻⁴, CPD vs. Ped non-MIS-C: P=0.59, COVID ARDS vs. MIS-C: P=8.53x10⁻⁶, Ped non-MIS-C vs. MIS-C: P=0.24. Anti-S IgM (b), CPD vs. COVID ARDS: P=6.93x10⁻⁵, CPD vs. Ped non-MIS-C: P=0.33, COVID ARDS vs. MIS-C: P=2.54x10⁻⁶, Ped non-MIS-C vs. MIS-C: P=0.99. Anti-S IgA (c), CPD vs. COVID ARDS: P=3.82x10⁻⁷, CPD vs. Ped non-MIS-C: P=0.08, COVID ARDS vs. MIS-C: P=9.06x10⁻⁷, Ped non-MIS-C vs. MIS-C: P=0.11. Anti-N IgG (d), CPD vs. COVID ARDS: P=0.93, CPD vs. Ped non-MIS-C: P=3.31x10⁻⁵, COVID ARDS vs. MIS-C: P=3.88x10⁻⁵, Ped non-MIS-C vs. MIS-C: P=0.99. Significance is indicated as *P < 0.05, **P < 0.01, ***P < 0.001 or P>0.05 (ns). For anti-S IgG (e) and anti-N IgG (f), subject antibody levels are also plotted against patient age within the adult (left) and pediatric cohorts (right) with the best fit lines and P values calculated using simple linear regression. Anti-S IgG vs. Age (Ped non-MIS-C: R2=0.23, slope=−0.077, y-int=2.70). Anti-N IgG vs. Age (CPD: R2=0.34, slope=0.023, y-int=0.12).
Figure 2.
Figure 2.. Relationship of anti-S IgG and IgM levels with time post symptom onset for pediatric and adult cohorts.
Levels of anti-S IgG (a), and IgM (b) were plotted against the time post symptom onset for those subjects that were symptomatic either with COVID-19 or MIS-C. The adult groups, CPD (open black squares, n=19) and COVID-ARDS closed red squares, n=13) are plotted on the left and the pediatric groups, MIS-C (closed green circles, n=16) and non-MIS-C (open blue circles, n=16) are plotted on the right with the best fit line and P value, reported to 4 decimal places, was calculated using simple linear regression. Anti-S IgG vs. Time post symptom onset (COVID-ARDS: R2=0.39, slope=0.11, y-int=1.59; MIS-C: R2=0.25, slope=0.055, y-int=1.87; Ped non-MIS-C: R2=0.30, slope=0.021, y-int=1.29).
Figure 3.
Figure 3.. Reduced SARS-CoV-2 neutralizing activity in children with and without MIS-C compared to adults with mild and severe COVID-19.
a, Plasma neutralizing activity in the pseudovirus assay was correlated with the end point titers in a live virus microneutralization assay based on inhibition of cytopathic effect (n=13, see methods), b, Neutralizing activity for SARS-CoV-2-specific antibodies was determined using the pseudovirus assay (see methods). Neutralizing activity is shown from adult convalescent plasma donors (CPD, open black squares, n=19); adult patients with COVID-19 induced acute respiratory distress syndrome (COVID-ARDS, closed red squares, n=13); pediatric patients with a history of SARS-CoV-2 infection but not MIS-C (Non-MIS-C, open blue circles, n=31); patients with MIS-C (MIS-C, closed green circles, n=16); and control plasma from pre-pandemic donors (Neg, grey triangles, n=10). Black bar indicates the median+interquartile range. The P values were calculated by one-way ANOVA with Sidak’s multiple comparisons test (CPD vs. COVID ARDS: P=0.019, CPD vs. Ped non-MIS-C: P=0.0031, COVID ARDS vs. MIS-C: P=3.35x10⁻⁶, Ped non-MIS-C vs. MIS-C: P=1.0). Significance is indicated as *P < 0.05, **P < 0.01, ***P < 0.001 or P>0.05 (ns). Shown (c) are the percent inhibition values of S-protein mediated pseudoviral replication plotted against the plasma dilution factors for all subjects in each group. Neutralizing activity is plotted against anti-S IgG levels (d) and patient age (e) within the adult (left) and pediatric cohorts (right). The best fit lines and P values (reported to 4 decimal places), were calculated using simple linear regression. Neutralizing activity vs. anti-S IgG (CPD: R2=0.29, slope=0.36, y-int=0.88; MIS-C: R2=0.51, slope=0.38, y-int=0.43; Ped non-MIS-C: R2=0.21, slope=0.22, y-int=0.86). Neutralizing activity vs. age (Ped non-MIS-C: R2=0.20, slope=−0.034, y-int=1.64).
Figure 4.
Figure 4.. Relationship of anti-SARS-CoV-2 neutralizing activity with time post symptom onset.
a, Levels of neutralization activity were plotted against the time post symptom onset for those subjects that were symptomatic either with COVID-19 or MIS-C. The adult groups, CPD (open black squares, n=19) and COVID-ARDS closed red squares, n=13) are plotted on the left and the pediatric groups, MIS-C (closed green circles, n=16) and non-MIS-C (open blue circles, n=16) are plotted on the right with the best fit line and P value calculated using simple linear regression (COVID-ARDS: R2=0.36, slope=0.040, y-int=1.34). b, The anti-S IgG levels (left) and neutralizing activity (right) of MIS-C subjects (n=10) during the acute phase of illness and at a follow-up visit 2–4 weeks after hospital discharge. The P values were calculated by two way paired t-test.

Update of

References

    1. Dong Y, et al. Epidemiology of COVID-19 Among Children in China. Pediatrics 145(2020). - PubMed
    1. Wu Z & McGoogan JM Characteristics of and Important Lessons From the Coronavirus Disease 2019 (COVID-19) Outbreak in China: Summary of a Report of 72314 Cases From the Chinese Center for Disease Control and Prevention. JAMA 323, 1239–1242 (2020). - PubMed
    1. Cheung EW, et al. Multisystem Inflammatory Syndrome Related to COVID-19 in Previously Healthy Children and Adolescents in New York City. JAMA 324, 294–296 (2020). - PMC - PubMed
    1. Feldstein LR, et al. Multisystem Inflammatory Syndrome in U.S. Children and Adolescents. N Engl J Med 383, 334–346 (2020). - PMC - PubMed
    1. Whittaker E, et al. Clinical Characteristics of 58 Children With a Pediatric Inflammatory Multisystem Syndrome Temporally Associated With SARS-CoV-2. JAMA 324, 259–269 (2020). - PMC - PubMed

Methods-only References

    1. Ranieri VM, et al. Acute respiratory distress syndrome: the Berlin Definition. JAMA 307, 2526–2533 (2012). - PubMed
    1. Khemani RG, Smith LS, Zimmerman JJ, Erickson S & Pediatric Acute Lung Injury Consensus Conference, G. Pediatric acute respiratory distress syndrome: definition, incidence, and epidemiology: proceedings from the Pediatric Acute Lung Injury Consensus Conference. Pediatr Crit Care Med 16, S23–40 (2015). - PubMed
    1. CDC. Multisystem Inflammatory Syndrome in Children (MIS-C) Associated with Coronavirus Disease 2019 (COVID-19). Vol. 2020 Health Alert Network (Health and Human Services, 2020).
    1. Singer M, et al. The Third International Consensus Definitions for Sepsis and Septic Shock (Sepsis-3). JAMA 315, 801–810 (2016). - PMC - PubMed
    1. Matics TJ & Sanchez-Pinto LN Adaptation and Validation of a Pediatric Sequential Organ Failure Assessment Score and Evaluation of the Sepsis-3 Definitions in Critically Ill Children. JAMA Pediatr 171, e172352 (2017). - PMC - PubMed

Publication types

MeSH terms

Grants and funding