Monitoring land surface albedo and vegetation dynamics using high spatial and temporal resolution synthetic time series from Landsat and the MODIS BRDF/NBAR/albedo product
- PMID: 33154713
- PMCID: PMC7641169
- DOI: 10.1016/j.jag.2017.03.008
Monitoring land surface albedo and vegetation dynamics using high spatial and temporal resolution synthetic time series from Landsat and the MODIS BRDF/NBAR/albedo product
Abstract
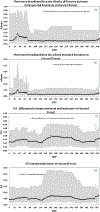
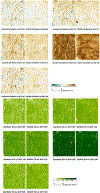
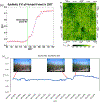
Seasonal vegetation phenology can significantly alter surface albedo which in turn affects the global energy balance and the albedo warming/cooling feedbacks that impact climate change. To monitor and quantify the surface dynamics of heterogeneous landscapes, high temporal and spatial resolution synthetic time series of albedo and the enhanced vegetation index (EVI) were generated from the 500 m Moderate Resolution Imaging Spectroradiometer (MODIS) operational Collection V006 daily BRDF/NBAR/albedo products and 30 m Landsat 5 albedo and near-nadir reflectance data through the use of the Spatial and Temporal Adaptive Reflectance Fusion Model (STARFM). The traditional Landsat Albedo (Shuai et al., 2011) makes use of the MODIS BRDF/Albedo products (MCD43) by assigning appropriate BRDFs from coincident MODIS products to each Landsat image to generate a 30 m Landsat albedo product for that acquisition date. The available cloud free Landsat 5 albedos (due to clouds, generated every 16 days at best) were used in conjunction with the daily MODIS albedos to determine the appropriate 30 m albedos for the intervening daily time steps in this study. These enhanced daily 30 m spatial resolution synthetic time series were then used to track albedo and vegetation phenology dynamics over three Ameriflux tower sites (Harvard Forest in 2007, Santa Rita in 2011 and Walker Branch in 2005). These Ameriflux sites were chosen as they are all quite nearby new towers coming on line for the National Ecological Observatory Network (NEON), and thus represent locations which will be served by spatially paired albedo measures in the near future. The availability of data from the NEON towers will greatly expand the sources of tower albedometer data available for evaluation of satellite products. At these three Ameriflux tower sites the synthetic time series of broadband shortwave albedos were evaluated using the tower albedo measurements with a Root Mean Square Error (RMSE) less than 0.013 and a bias within the range of ±0.006. These synthetic time series provide much greater spatial detail than the 500 m gridded MODIS data, especially over more heterogeneous surfaces, which improves the efforts to characterize and monitor the spatial variation across species and communities. The mean of the difference between maximum and minimum synthetic time series of albedo within the MODIS pixels over a subset of satellite data of Harvard Forest (16 km by 14 km) was as high as 0.2 during the snow-covered period and reduced to around 0.1 during the snow-free period. Similarly, we have used STARFM to also couple MODIS Nadir BRDF Adjusted Reflectances (NBAR) values with Landsat 5 reflectances to generate daily synthetic times series of NBAR and thus Enhanced Vegetation Index (NBAR-EVI) at a 30 m resolution. While normally STARFM is used with directional reflectances, the use of the view angle corrected daily MODIS NBAR values will provide more consistent time series. These synthetic times series of EVI are shown to capture seasonal vegetation dynamics with finer spatial and temporal details, especially over heterogeneous land surfaces.
Keywords: Albedo; Data fusion; Phenology; Remote sensing; Vegetation Index.
Figures


References
-
- Baldocchi D, Falge E, Wilson K, 2001. A spectral analysis of biosphere - atmosphere trace gas flux densities and meteorological variables across hour to multi-year time scales. Agric. For. Meteorol 107, 1–27, 10.1016/S0168-1923(00)00228-8. - DOI
-
- Campagnolo ML, Sun Q, Liu Y, Schaaf C, Wang Z, Román MO, 2016. Estimating the effective spatial resolution of the operational BRDF, albedo, and nadir reflectance products from MODIS and VIIRS. Remote Sens. Environ 175, 52–64, 10.1016/j.rse.2015.12.033. - DOI
-
- Carroll SS, Cressie N, 1996. A comparison of geostatistical methodologies used to estimate snow water equivalent. Water Resour. Bull 32, 267–278, 10.1111/j.1752-1688.1996.tb03450.x. - DOI
-
- Churkina G, Schimel D, Braswell BH, Xiao XM, 2005. Spatial analysis of growing season length control over net ecosystem exchange. Glob. Change Biol 11, 1777–1787, 10.1111/j.1365-2486.2005.01012.x. - DOI
Grants and funding
LinkOut - more resources
Full Text Sources
