

Mechano-Regulation of Trabecular Bone Adaptation Is Controlled by the Local in vivo Environment and Logarithmically Dependent on Loading Frequency
- PMID: 33154964
- PMCID: PMC7591723
- DOI: 10.3389/fbioe.2020.566346
Mechano-Regulation of Trabecular Bone Adaptation Is Controlled by the Local in vivo Environment and Logarithmically Dependent on Loading Frequency
Abstract
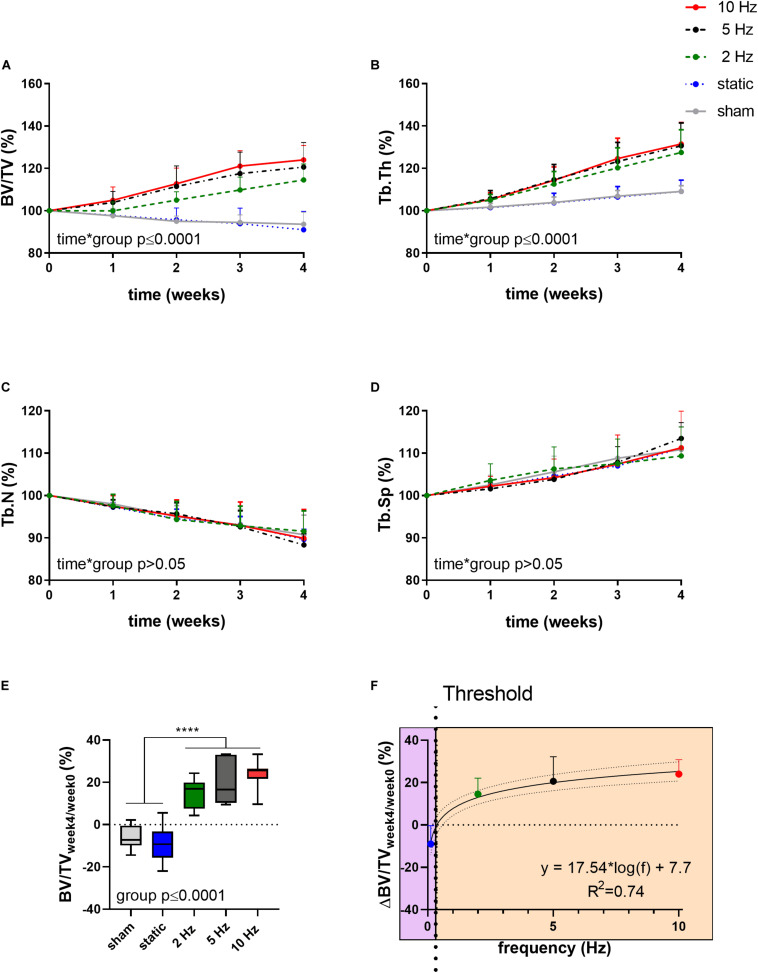
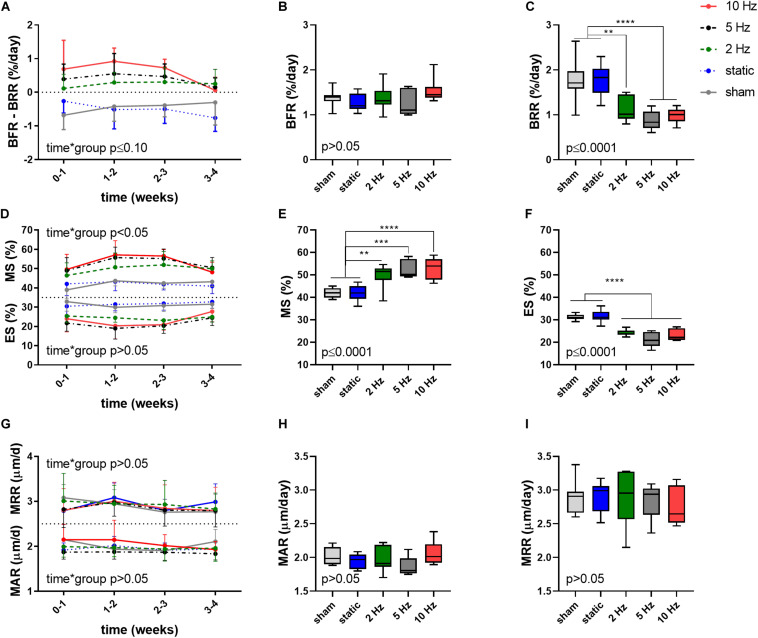
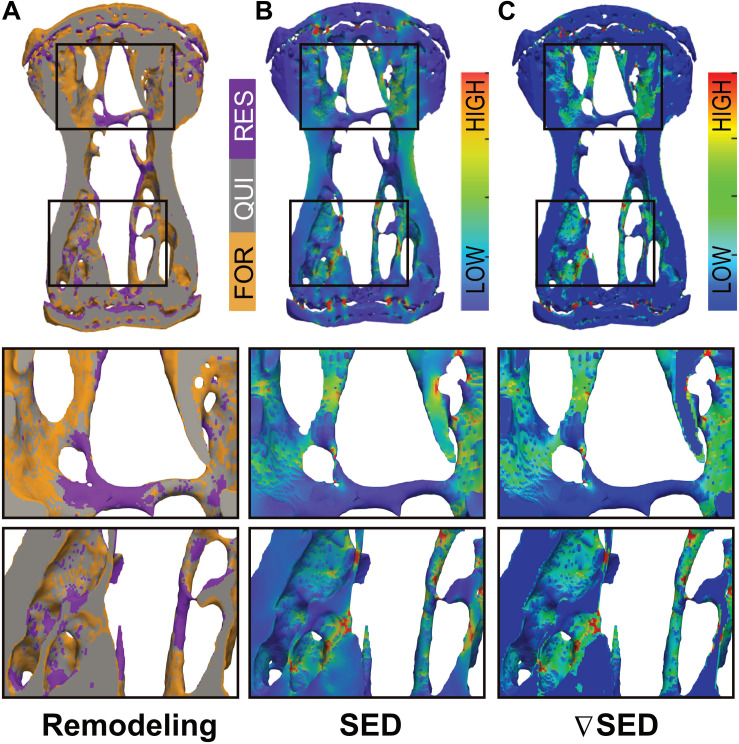
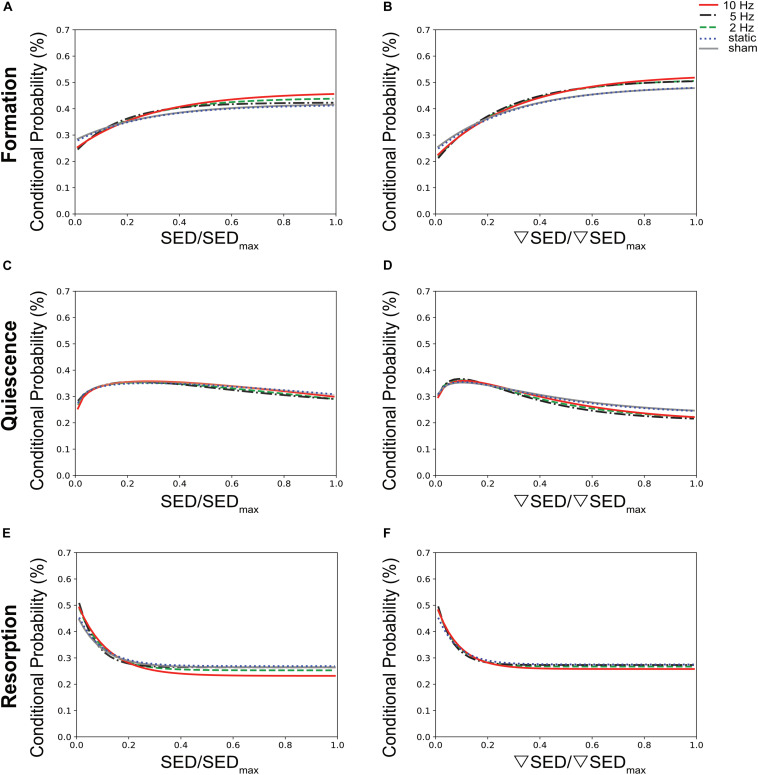
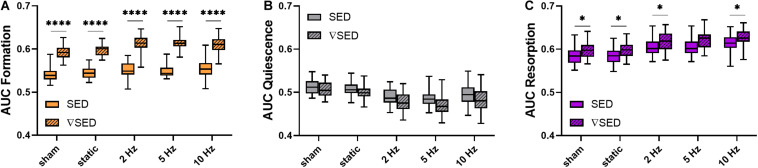
It is well-established that cyclic, but not static, mechanical loading has anabolic effects on bone. However, the function describing the relationship between the loading frequency and the amount of bone adaptation remains unclear. Using a combined experimental and computational approach, this study aimed to investigate whether trabecular bone mechano-regulation is controlled by mechanical signals in the local in vivo environment and dependent on loading frequency. Specifically, by combining in vivo micro-computed tomography (micro-CT) imaging with micro-finite element (micro-FE) analysis, we monitored the changes in microstructural as well as the mechanical in vivo environment [strain energy density (SED) and SED gradient] of mouse caudal vertebrae over 4 weeks of either cyclic loading at varying frequencies of 2, 5, or 10 Hz, respectively, or static loading. Higher values of SED and SED gradient on the local tissue level led to an increased probability of trabecular bone formation and a decreased probability of trabecular bone resorption. In all loading groups, the SED gradient was superior in the determination of local bone formation and resorption events as compared to SED. Cyclic loading induced positive net (re)modeling rates when compared to sham and static loading, mainly due to an increase in mineralizing surface and a decrease in eroded surface. Consequently, bone volume fraction increased over time in 2, 5, and 10 Hz (+15%, +21% and +24%, p ≤ 0.0001), while static loading led to a decrease in bone volume fraction (-9%, p ≤ 0.001). Furthermore, regression analysis revealed a logarithmic relationship between loading frequency and the net change in bone volume fraction over the 4 week observation period (R 2 = 0.74). In conclusion, these results suggest that trabecular bone adaptation is regulated by mechanical signals in the local in vivo environment and furthermore, that mechano-regulation is logarithmically dependent on loading frequency with frequencies below a certain threshold having catabolic effects, and those above anabolic effects. This study thereby provides valuable insights toward a better understanding of the mechanical signals influencing trabecular bone formation and resorption in the local in vivo environment.
Keywords: bone adaptation; frequency dependency; in vivo micro-CT imaging; mechanical loading; micro-finite element analysis.
Copyright © 2020 Scheuren, Vallaster, Kuhn, Paul, Malhotra, Kameo and Müller.
Figures
Similar articles
-
Mechanostat parameters estimated from time-lapsed in vivo micro-computed tomography data of mechanically driven bone adaptation are logarithmically dependent on loading frequency.Front Bioeng Biotechnol. 2023 Apr 11;11:1140673. doi: 10.3389/fbioe.2023.1140673. eCollection 2023. Front Bioeng Biotechnol. 2023. PMID: 37113673 Free PMC article.
-
Experimental and finite element analysis of the mouse caudal vertebrae loading model: prediction of cortical and trabecular bone adaptation.Biomech Model Mechanobiol. 2012 Jan;11(1-2):221-30. doi: 10.1007/s10237-011-0305-3. Epub 2011 Apr 7. Biomech Model Mechanobiol. 2012. PMID: 21472383
-
Bone adaptation to cyclic loading in murine caudal vertebrae is maintained with age and directly correlated to the local micromechanical environment.J Biomech. 2015 Apr 13;48(6):1179-87. doi: 10.1016/j.jbiomech.2014.11.020. Epub 2014 Dec 8. J Biomech. 2015. PMID: 25543278
-
Mechanoregulated trabecular bone adaptation: Progress report on in silico approaches.Biomater Biosyst. 2022 Jul 21;7:100058. doi: 10.1016/j.bbiosy.2022.100058. eCollection 2022 Aug. Biomater Biosyst. 2022. PMID: 36824485 Free PMC article. Review.
-
Toward a clear relationship between mechanical signals and bone adaptation.Mechanobiol Med. 2025 Feb 1;3(1):100115. doi: 10.1016/j.mbm.2025.100115. eCollection 2025 Mar. Mechanobiol Med. 2025. PMID: 40396131 Free PMC article. Review.
Cited by
-
Using Finite Element Modeling in Bone Mechanoadaptation.Curr Osteoporos Rep. 2023 Apr;21(2):105-116. doi: 10.1007/s11914-023-00776-9. Epub 2023 Feb 18. Curr Osteoporos Rep. 2023. PMID: 36808071 Free PMC article. Review.
-
Cortical Thickness Adaptive Response to Mechanical Loading Depends on Periosteal Position and Varies Linearly With Loading Magnitude.Front Bioeng Biotechnol. 2021 Jun 18;9:671606. doi: 10.3389/fbioe.2021.671606. eCollection 2021. Front Bioeng Biotechnol. 2021. PMID: 34222215 Free PMC article.
-
Mechanostat parameters estimated from time-lapsed in vivo micro-computed tomography data of mechanically driven bone adaptation are logarithmically dependent on loading frequency.Front Bioeng Biotechnol. 2023 Apr 11;11:1140673. doi: 10.3389/fbioe.2023.1140673. eCollection 2023. Front Bioeng Biotechnol. 2023. PMID: 37113673 Free PMC article.
-
Increased osteoclastogenesis contributes to bone loss in the Costello syndrome Hras G12V mouse model.Front Cell Dev Biol. 2022 Oct 18;10:1000575. doi: 10.3389/fcell.2022.1000575. eCollection 2022. Front Cell Dev Biol. 2022. PMID: 36330334 Free PMC article.
-
TRPV4 mediates cell damage induced by hyperphysiological compression and regulates COX2/PGE2 in intervertebral discs.JOR Spine. 2021 May 6;4(3):e1149. doi: 10.1002/jsp2.1149. eCollection 2021 Sep. JOR Spine. 2021. PMID: 34611585 Free PMC article.
References
-
- Beranek L. L., Mellow T. J. eds (2012). “Chapter 1-Introduction and terminology,” in Acoustics: Sound Fields and Transducers, (Cambridge, MA: Academic Press; ), 1–19.
-
- Carriero A., Pereira A. F., Wilson A. J., Castagno S., Javaheri B., Pitsillides A. A., et al. (2018). Spatial relationship between bone formation and mechanical stimulus within cortical bone: combining 3d fluorochrome mapping and poroelastic finite element modelling. Bone Rep. 8 72–80. 10.1016/j.bonr.2018.02.003 - DOI - PMC - PubMed
LinkOut - more resources
Full Text Sources