

Condensin minimizes topoisomerase II-mediated entanglements of DNA in vivo
- PMID: 33155682
- PMCID: PMC7780148
- DOI: 10.15252/embj.2020105393
Condensin minimizes topoisomerase II-mediated entanglements of DNA in vivo
Abstract
The juxtaposition of intracellular DNA segments, together with the DNA-passage activity of topoisomerase II, leads to the formation of DNA knots and interlinks, which jeopardize chromatin structure and gene expression. Recent studies in budding yeast have shown that some mechanism minimizes the knotting probability of intracellular DNA. Here, we tested whether this is achieved via the intrinsic capacity of topoisomerase II for simplifying the equilibrium topology of DNA; or whether it is mediated by SMC (structural maintenance of chromosomes) protein complexes like condensin or cohesin, whose capacity to extrude DNA loops could enforce dissolution of DNA knots by topoisomerase II. We show that the low knotting probability of DNA does not depend on the simplification capacity of topoisomerase II nor on the activities of cohesin or Smc5/6 complexes. However, inactivation of condensin increases the occurrence of DNA knots throughout the cell cycle. These results suggest an in vivo role for the DNA loop extrusion activity of condensin and may explain why condensin disruption produces a variety of alterations in interphase chromatin, in addition to persistent sister chromatid interlinks in mitotic chromatin.
Keywords: DNA knot; DNA loop extrusion; DNA topology; SMC complex; chromatin.
© 2020 The Authors. Published under the terms of the CC BY 4.0 license.
Conflict of interest statement
The authors declare that they have no conflict of interest.
Figures
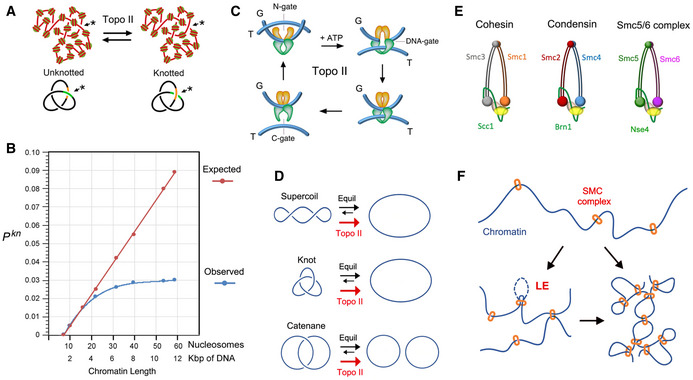
Topo II activity on random juxtapositions of DNA segments (*) produces steady‐state fractions of DNA knots in intracellular chromatin.
DNA knotting probability (Pkn) of intracellular chromatin (observed) does not scale proportionally to the length of DNA (expected). The slope of Pkn is reduced in chromatin stretches larger than 20 nucleosomes. Data from (Valdes et al, 2018).
Three‐gate mechanism of topo II to pass one segment of DNA (T‐segment) through another (G‐segment). Upon ATP binding, the T‐segment is captured by the entrance gate (N‐gate) and passed through the transiently cleaved G‐segment (DNA‐gate). Upon re‐ligation of the G‐segment, the T‐segment is released through the exit gate (C‐gate).
Topo II activity reduces the fractions of DNA supercoils, knots and catenates to below the topological equilibrium values (see details in Fig EV1).
Architecture of the SMC complexes of S. cerevisiae. The Smc heterodimers (Smc1‐Smc3, Smc2‐Smc4, Smc5‐Smc6) and kleisin (Scc1, Brn1, Nse4) subunits of cohesin, condensin, and the Smc5/6 complex are indicated.
SMC complexes entrap segments of DNA to form chromatin loops and/or bridge nearby chromatin domains. Their loop extrusion activity (LE) ensures the co‐entrapment of contiguously oriented intramolecular DNA segments.
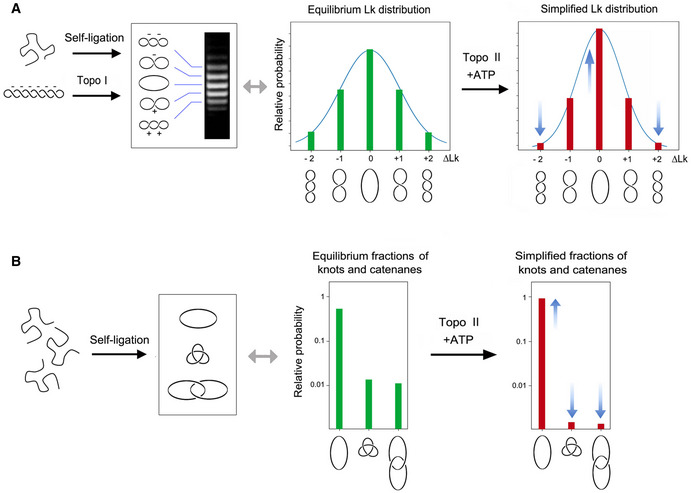
Either the self ligation of a linear DNA duplex into a covalently closed ring or the relaxation of a DNA plasmid with a type‐1B topoisomerase (topo I) produce identical equilibrium distributions of Lk topoisomers, which reflect the thermal fluctuations (twisting and bending) of DNA molecules in free solution. ATP‐dependent DNA passage catalyzed by topo II simplifies (i.e., reduces the variance, narrows) the equilibrium distribution of Lk topoisomers. ∆Lk values indicate the Lk difference relative to the distribution center (Lk = 0).
Circularization of linear DNA molecules in free solution can also produce knotted and/or catenated DNA rings. Knotting probability increases with DNA length, whereas catenane probability increases with DNA concentration. As in the case of the Lk distribution, the knotting and catenation probability reflect the equilibrium topology of DNA in free solution. ATP‐dependent DNA passage catalyzed by topo II markedly reduces (i.e., simplifies) the equilibrium fractions of knotted and catenated forms.
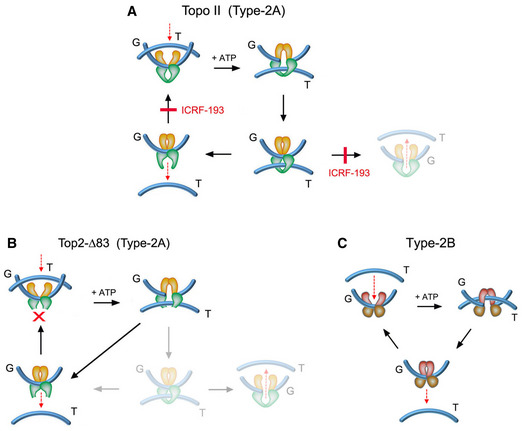
The topo II inhibitor ICRF‐193 impedes the reopening of the N‐gate once the T‐segment has been captured and passed across the G‐segment. ICRF‐193 blocks thereby the enzyme turnover and the plausible backtracking of the T‐segment across the G‐segment. When topo II activity is quenched with ICRF‐193, the last DNA‐passage event conducted by the enzyme does not simplify the equilibrium DNA topology.
The topo II construct top2‐∆83, in which the C‐gate has been deleted, is able to perform DNA passage and the T‐segment cannot backtrack since it is freed upon crossing the G‐segment. This truncated enzyme can relax and unlink DNA molecules but has lost the capacity to simplify the equilibrium DNA topology.
Type‐2B topoisomerases are mechanistically similar to type‐2A topoisomerases (topo II). The T‐segment is captured by the N‐gate and is passed across the bended G‐segment at the DNA‐gate. However, type‐2B topoisomerases do not have a C‐gate, so the passed T‐segment is naturally freed upon crossing the G‐segment. As in the case of top2‐∆83, type‐2B topoisomerases relax and unlink DNA molecules but do not simplify equilibrium DNA topology.
- A
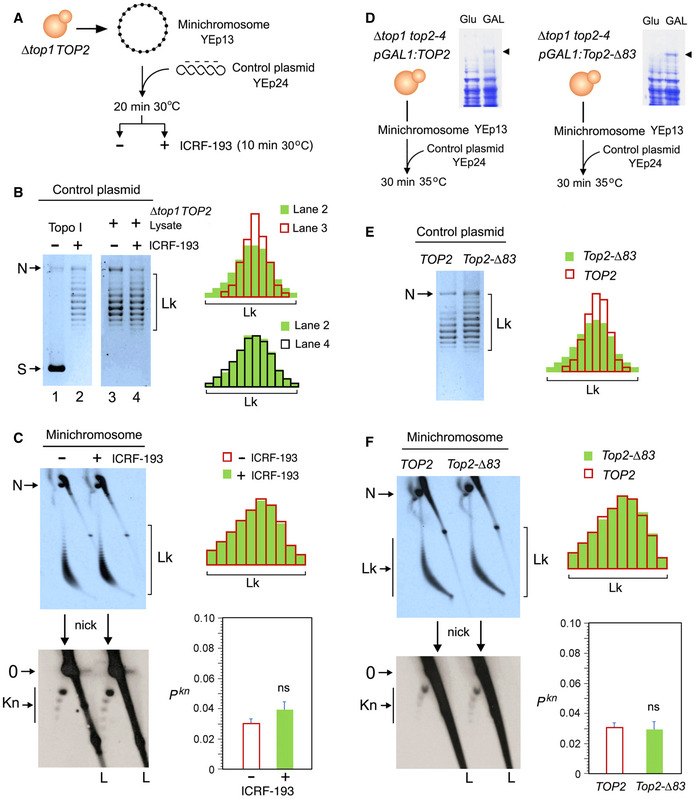
Experimental layout to test the DNA topology simplification activity of cellular topo II upon the addition of ICRF‐193.
- B
Lanes 1 and 2: negatively supercoiled plasmid (YEp24) and its equilibrium distribution of Lk topoisomers upon its relaxation with Topo I. Lanes 3 and 4: distribution of Lk topoisomers of YEp24 upon its relaxation in lysates of ∆top1 TOP2 yeast cells in absence and after the addition of ICRF‐193. Plots compare the relative intensity of individual topoisomers of the Lk distributions in lanes 2, 3, and 4.
- C
Top: 2D gel electrophoresis of the Lk distributions of the YEp13 minichromosome present in the lysates of ∆top1 TOP2 yeast cells before and after the addition of ICRF‐193 (see details in Fig EV3). Plots compare the relative intensity of the Lk distributions (divided into ten sections). Bottom: 2D gel electrophoresis of the same samples upon nicking the DNA in order to reveal the occurrence of knots (see details in Fig EV4). The graph shows Pkn of YEp13 (mean ± SD from three independent experiments). P‐values (Student’s t test): ns, P > 0.05.
- D
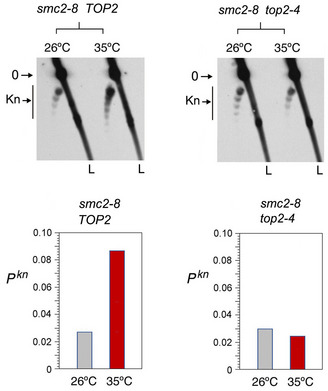
Experimental layout to compare the activities of TOP2 and Top2‐∆83 on DNA and chromatin. Arrowheads indicate the extrachromosomal expression of TOP2 and Top2‐∆83 under the inducible pGAL1 promoter.
- E
Lk distributions of the control plasmid (YEp24) relaxed by lysates of ∆top1 top2‐4 yeast cells that expressed TOP2 or Top2‐∆83. Plots compare the relative intensity of individual Lk topoisomers.
- F
Top: 2D gel electrophoresis of the Lk distributions of the YEp13 minichromosome produced in the presence of TOP2 or Top2‐∆83. Plots compare the relative intensity of the Lk distributions (divided into ten sections). Bottom: 2D gel electrophoresis of the same samples upon nicking the DNA in order to reveal the occurrence of knots. Graph: Pkn of YEp13 (mean ± SD from three independent experiments).
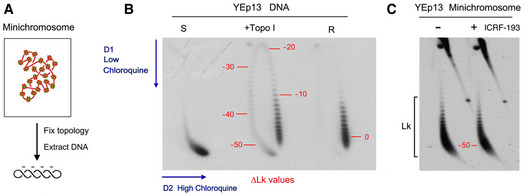
DNA molecules extracted from yeast circular minichromosomes are negatively supercoiled since each nucleosome constrains about one negative supercoil (∆Lk ≈ −1).
2D gel electrophoresis of covalently closed DNA circles, in which the first and second gel dimensions are run in the presence of low and high concentrations of chloroquine, respectively, allow the Lk distribution of DNA topoisomers to be resolved along an arch, in which Lk values increase clockwise. The 2D gel shows highly negatively supercoiled (S), partially relaxed (+topo I), and fully relaxed (R) forms of the YEp13 plasmid. Numbers in red indicate approximate ∆Lk values relative to the center of the relaxed (R) Lk distribution (∆Lk = 0).
2D gel electrophoresis of DNA of the YEp13 minichromosome (as in Fig 2C). Comparison of the gels in B and C indicates that DNA in the YEp13 minichromosome is negatively supercoiled and has ∆Lk close to −50. This value is consistent with the plausible number of nucleosomes assembled in YEp13 (10.7 Kb). However, note that since the outline of Lk distributions can vary in separate 2D gels (i.e., due to differences in tank dimensions, power supply and temperature during electrophoresis), only DNA samples that ran in the same gel (side by side) can be accurately compared.
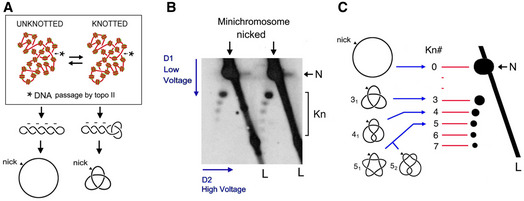
DNA molecules extracted from yeast minichromosomes might contain knots due to the knotting‐unknotting activity of intracellular topo II. Knotted and unknotted molecules are hard to distinguish when DNA is supercoiled because all of them present similar compaction. Upon nicking the DNA, supercoiling is dissipated and knotted molecules remain more compact than unknotted ones.
2D gel electrophoresis of nicked DNA of the YEp13 minichromosome (as in Fig 2C). The first and second gel‐dimensions run at low and high voltage, respectively. In the first dimension, knotted molecules (Kn) are more compacted and so move faster than unknotted ones (N). In the second gel‐dimension, knotted molecules are retarded from the diagonal of linear DNA fragments (L), which produces a strong signal due to genomic DNA present in the samples.
Identification of DNA knot populations according to the irreducible number of DNA crossings of each knot (Kn#). From the position of the unknotted circle that has zero crossings (0), a ladder of knot populations of increasing complexity begins with the knot of three crossings (31), followed by the knot with four crossing (41), two knots with five crossings (51 and 52), and so on.
- A
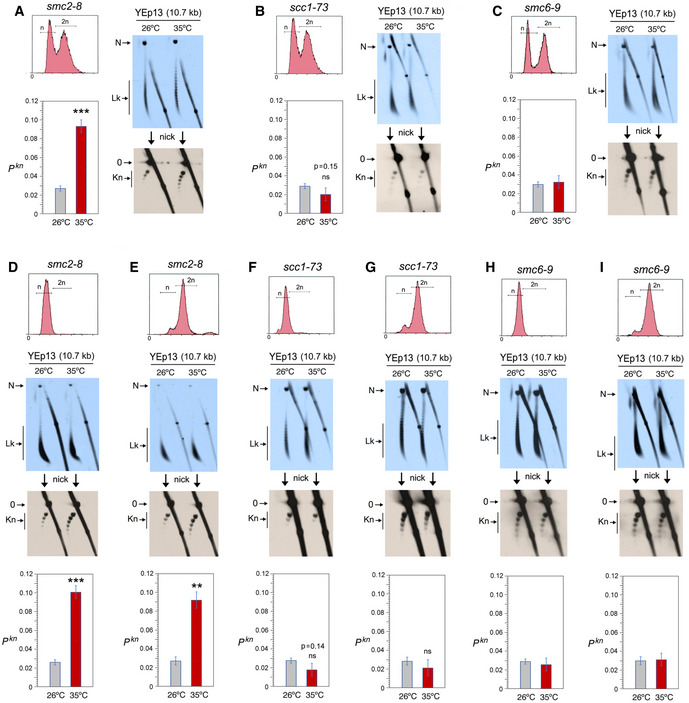
Top, DNA content (n/2n) of exponentially growing (OD600 = 0.6–0.8) smc2‐8 yeast cells. First blot: 2D gel electrophoresis of the distribution of Lk topoisomers (Lk) of the YEp13 DNA in cells quenched at 26°C and after shifting the culture to 35°C for 60 min. Second blot: 2D gel electrophoresis of the same samples upon nicking the YEp13 DNA in order to reveal the occurrence of knots (kn). Graph: Pkn of YEp13 before and after the inactivation of condensin.
- B
Experiments conducted as in (A) but in scc1‐73 yeast cells. Graph: Pkn of YEp13 before and after the inactivation of cohesin.
- C
Experiments conducted as in (A) but in smc6‐9 yeast cells. Graph: Pkn of YEp13 before and after the inactivation of the Smc5/6 complex.
- D, E
Experiments conducted as in (A), but in cells arrested in G1 with alpha‐factor (D) or in metaphase with nocodazole (E) for 2 h at 26°C and for one additional hour at 26°C or 35°C.
- F, G
Experiments conducted as in (B), but in cells arrested in G1 with alpha‐factor for 2 h at 26°C (F) or in metaphase with nocodazole (G) and for one additional hour at 26°C or 35°C.
- H, I
Experiments conducted as in (C), but in cells arrested in G1 with alpha‐factor (H) or in metaphase with nocodazole (I) for 2 h at 26°C and for one additional hour at 26°C or 35°C.
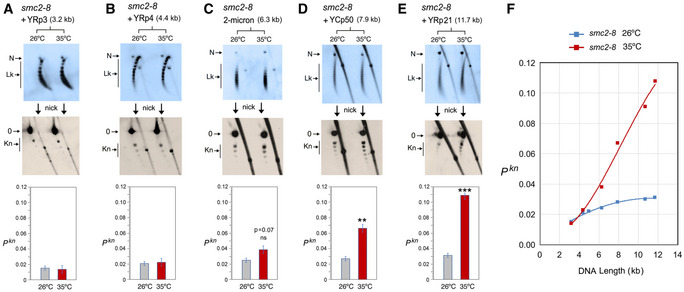
- A–E
DNA topology of the indicated minichromosomes of increasing DNA length (kb) before (26°C) and after inactivation of condensin (35°C) in smc2‐8 cells. In each case, the first 2D gel resolves the Lk topoisomers (Lk), the second 2D gel uncovers the knotted forms (Kn). Gel signals are denoted as in Fig 2. Bottom graphs compare the Pkn before and after the inactivation of condensin (mean ± SD from three independent experiments). P‐values (Student’s t test): ns, p> 0.05; **p < 0.01; ***p < 0.001.
- F
Plot of Pkn values of minichromosomes of increasing DNA length (including YEp13) before and after inactivation of condensin.
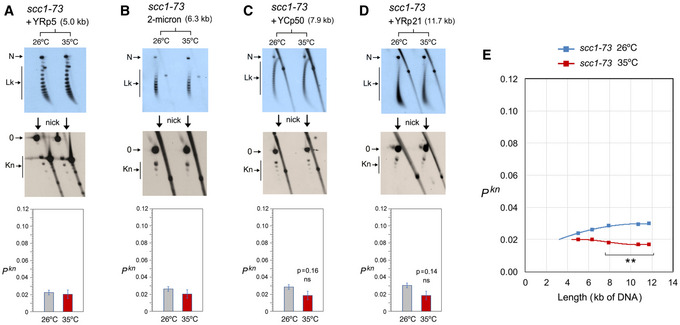
- A–D
DNA topology of the indicated minichromosomes of increasing DNA length (kb) before (26°C) and after inactivation of cohesin (35°C) in scc1‐73 cells. In each case, the first 2D gel resolves the Lk topoisomers (Lk), the second 2D gel uncovers the knotted forms (Kn). Gel signals are denoted as in Fig 2. Bottom graphs compare the Pkn before and after the inactivation of cohesin (mean ± SD from three independent experiments). P‐values (Student’s t test): ns, P > 0.05.
- E
Plot of Pkn values of minichromosomes of increasing DNA length (including YEp13) before and after inactivation of cohesin. P‐values (Student’s t test): **P < 0.01.
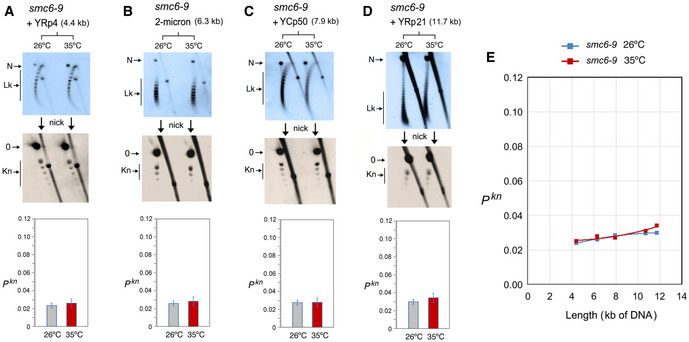
- A–D
DNA topology of the indicated minichromosomes of increasing DNA length (kb) before (26°C) and after inactivation of Smc5/6 complex (35°C) in smc6‐9 cells. In each case, the first 2D gel resolves the Lk topoisomers (Lk), and the second 2D gel uncovers the knotted forms (Kn). Gel signals are denoted as in Fig 2. Bottom graphs compare the Pkn before and after the inactivation of Smc5/6 complex (mean ± SD from two independent experiments).
- E
Plot of Pkn values of minichromosomes of increasing DNA length (including YEp13) before and after inactivation of Smc5/6 complex.
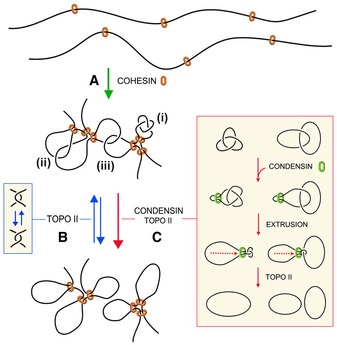
Cohesin generates and stabilizes DNA loops to organize interphase chromatin into topological domains.
Random DNA strand passage activity of topo II can either remove or produce DNA entanglements within and across such topological domains. Juxtapositions of DNA segments within a loop can lead to the formation of knots (i), whereas juxtapositions of DNA segments belonging to nearby loops or adjacent domains can lead to the formation of intra‐ (ii) or inter‐molecular (iii) DNA interlinks.
To minimize the occurrence of these entanglements, condensin might use its DNA loop extrusion activity to constrict intra‐ and inter‐molecular interlinks and so bias the DNA strand passage activity of topo II to remove them. This condensin function may operate during interphase to facilitate chromatin transactions and during cell division to enforce the removal of sister chromatid interlinks.
References
-
- Aragon L (2018) The Smc5/6 Complex: New and Old Functions of the Enigmatic Long‐Distance Relative. Annu Rev Genet 52: 89–107 - PubMed
-
- Baxter J, Sen N, Martinez VL, De Carandini ME, Schvartzman JB, Diffley JF, Aragon L (2011) Positive supercoiling of mitotic DNA drives decatenation by topoisomerase II in eukaryotes. Science 331: 1328–1332 - PubMed
Publication types
MeSH terms
Substances
Grants and funding
- BFU2015-67007-P/Ministerio de Economía, Industria y Competitividad, Gobierno de España (MINECO)
- PID2019-109482GB-I00/Ministerio de Economía, Industria y Competitividad, Gobierno de España (MINECO)
- BES-2016-077806/Ministerio de Economía, Industria y Competitividad, Gobierno de España (MINECO)
- BES-2012-061167/Ministerio de Economía, Industria y Competitividad, Gobierno de España (MINECO)
- BES-2015-071597/Ministerio de Economía, Industria y Competitividad, Gobierno de España (MINECO)
LinkOut - more resources
Full Text Sources
Molecular Biology Databases
