. 2020 Nov 2;20(12):3.
doi: 10.1167/jov.20.12.3.

Idiosyncratic preferences in transparent motion and binocular rivalry are dissociable

Affiliations

Idiosyncratic preferences in transparent motion and binocular rivalry are dissociable

Byung-Woo Hwang et al. J Vis. .

Abstract

Previous studies revealed that there are idiosyncratic preferences to perceive certain motion directions in front during motion transparency depth rivalry (Mamassian & Wallace, 2010; Schütz, 2014). Meanwhile, other studies reported idiosyncratic preferences in binocular rivalry during the onset stage (Carter & Cavanagh, 2007; Stanley, Carter, & Forte, 2011). Here we investigated the relationship of idiosyncratic preferences in transparent motion and binocular rivalry. We presented two dot clouds that were moving in opposite directions. In the transparent motion condition, both dot clouds were presented to both eyes and participants had to report the dot cloud they perceived in front. In the binocular rivalry condition, the dot clouds were presented to different eyes and participants had to report the dominant dot cloud. There were strong idiosyncratic directional preferences in transparent motion and rather weak directional preferences in binocular rivalry. In general, binocular rivalry was dominated by biases in contrast polarity, whereas transparent motion was dominated by biases in motion direction. A circular correlation analysis showed no correlation between directional preferences in transparent motion and binocular rivalry. These findings show that idiosyncratic preferences in a visual feature can be dissociated at different stages of processing.


Figures

Figure 1.
Figure 1.
Individual direction bias and distribution of direction biases. (A and B) Individual data of observer #99 in Experiment 1. Each dot indicates the proportion of choices for one motion direction. Solid lines indicate the preferences from the fitted model. (A) Proportion of seen in front as a function of motion direction in the transparent motion condition. The observer had a preferred motion direction of –97.541 and a direction bias strength of 0.5. The observer had a polarity bias strength of 0.333. (B) Proportion of seen dominant as a function of motion direction in binocular rivalry condition. The observer had a preferred motion direction of –99.746 and a bias strength of 0.281. The observer had a polarity bias strength of 0.046 and an eye-of-origin bias strength of 0.279. (C and D) Distribution of preferred motion directions of all observers in all experiments. Histograms are smoothed using a 20°-wide kernel density estimation. The r-axis indicates estimated probability density. Colors indicate different experiments. (A and C) Transparent motion. (B and D) Binocular rivalry.
Figure 2.
Figure 2.
Absolute bias strength (A) in transparent motion condition and (B) in binocular rivalry condition. (Dir: direction bias; Pol: polarity bias; Eye: eye-of-origin bias). Error bars indicate 95% between-subjects confidence intervals.
Figure 3.
Figure 3.
(A) Direction bias strength in transparent motion and binocular rivalry conditions. (B) Polarity bias strength in transparent motion and binocular rivalry conditions. Negative values indicate biases toward black polarity (‘b’) and positive values indicate biases toward white polarity (‘w’). Experiment 2 does not contain polarity as a feature, and therefore is not plotted for polarity biases. (A and B) Large symbols indicate the average across participants; small symbols indicate data of individual participants. Horizontal and vertical error bars indicate 95% between-subject confidence intervals. The diagonal error bars indicate 95% confidence intervals of the within-subjects difference between the x and y values and need to be compared with the dashed diagonal representing equal x and y values.
Figure 4.
Figure 4.
Correlation between preferences in transparent motion and binocular rivalry for all experiments. (A) Circular correlation between preferred directions (Equation 3). The x and y values represent the sine of the difference between the preferred directions in the respective condition and their mean. The regression lines indicate the circular correlation; circles indicate individual data points. The different colors indicate the whole sample (black), data below (orange) or above (violet) the median bias strength in binocular rivalry. (B) Correlation between preferred axes. Preferences in binocular rivalry are normalized such that the preference axis is preserved while the direction is constrained to point into the same half circle as the preference in transparent motion. The thick black line shows the distribution of correlation coefficients with random pairing of normalized preferences in transparent motion and binocular rivalry. The vertical line indicates the correlation coefficient with the actual pairing of 0.681. The horizontal line indicates the critical value of 95%.
Figure A1.
Figure A1.
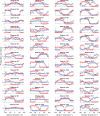
Individual participants' data. Proportion of seen in front as a function of motion direction in transparent motion condition (Red). Proportion of seen dominant as a function of motion direction in binocular rivalry condition (Blue). Each dot indicates the proportion of choice from behavioral data. Solid line indicates fitted model. Each column refers to Experiments 1 to 4. Please note that rows do not represent single observers because different observers participated in the experiments.

References

    1. Alais D., O'Shea R., Mesana-Alais C., & Wilson IG. (2000). On binocular alternation. Perception, 29(12), 1437–1445, 10.1068/p3017. - DOI - PubMed
    1. Andersen G. J. (1989). Perception of three-dimensional structure from optic flow without locally smooth velocity. Journal of Experimental Psychology: Human Perception and Performance, 15(2), 363–371, 10.1037/0096-1523.15.2.363. - DOI - PubMed
    1. Andersen R. A., & Bradley D. C. (1998). Three-dimensional structure from motion. Trends in Cognitive Sciences, 2(6), 222–228, 10.1016/S1364-6613(98)01181-4. - DOI - PubMed
    1. Baker D. H., & Graf E. W. (2009). On the relation between dichoptic masking and binocular rivalry. Vision Research, 49(4), 451–459, 10.1016/j.visres.2008.12.002. - DOI - PubMed
    1. Balasubramanian V., & Sterling P. (2009). Receptive fields and functional architecture in the retina. The Journal of Physiology, 587(12), 2753–2767, 10.1113/jphysiol.2009.170704. - DOI - PMC - PubMed