. 2021 Jan;83(1):7-17.
doi: 10.3758/s13414-020-02178-w. Epub 2020 Nov 6.

Location- and object-based attention enhance number estimation

Affiliations

Location- and object-based attention enhance number estimation

Antonella Pomè et al. Atten Percept Psychophys. 2021 Jan.

Abstract

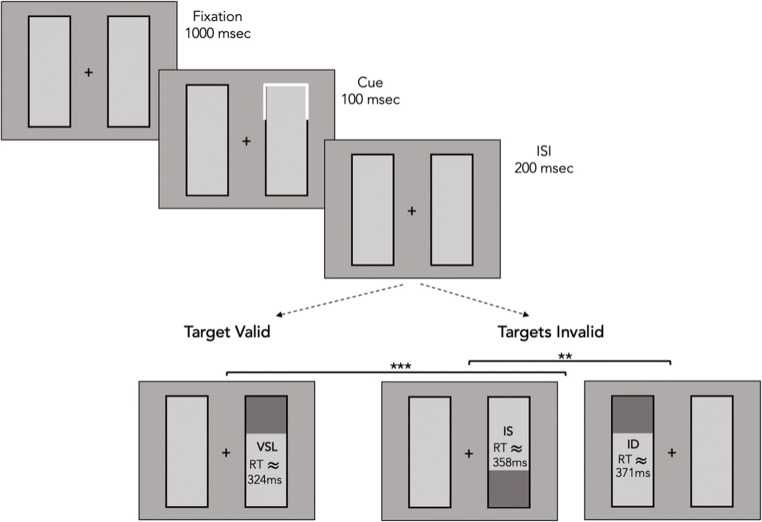
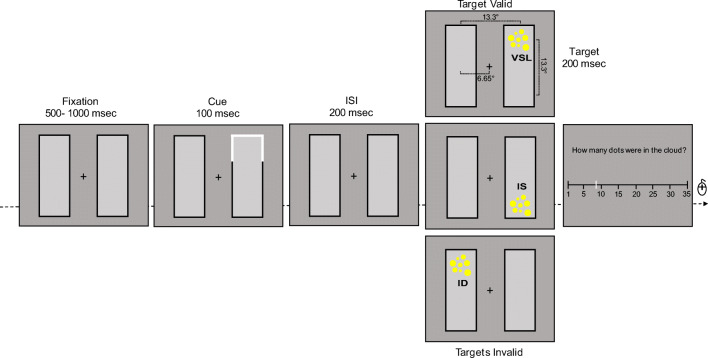
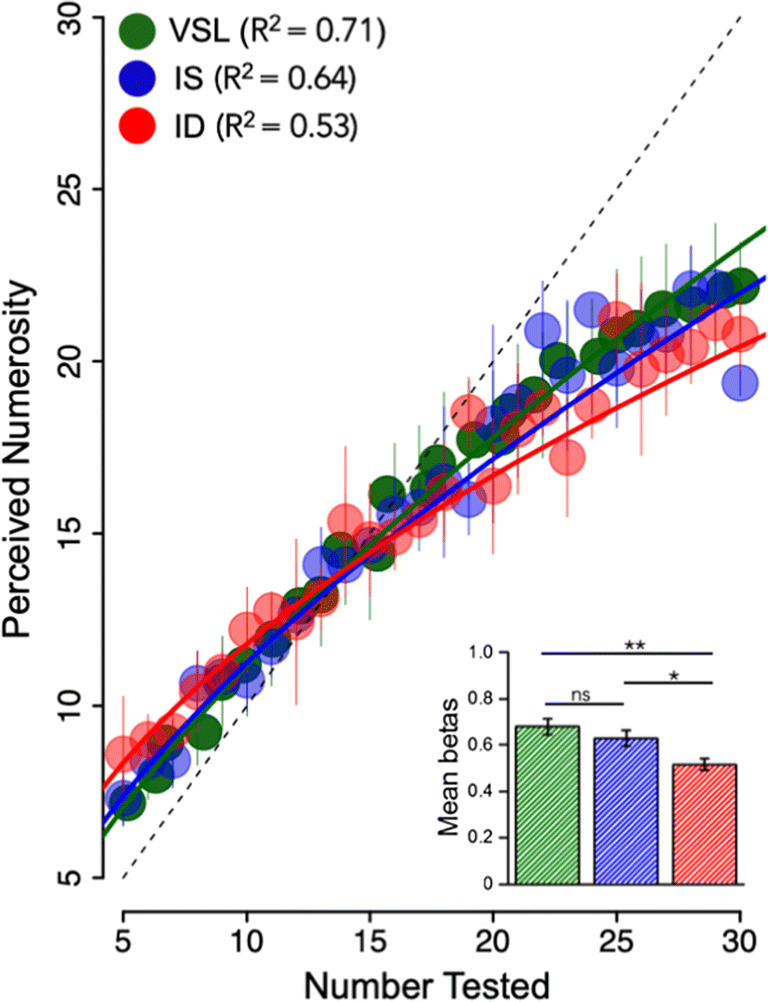
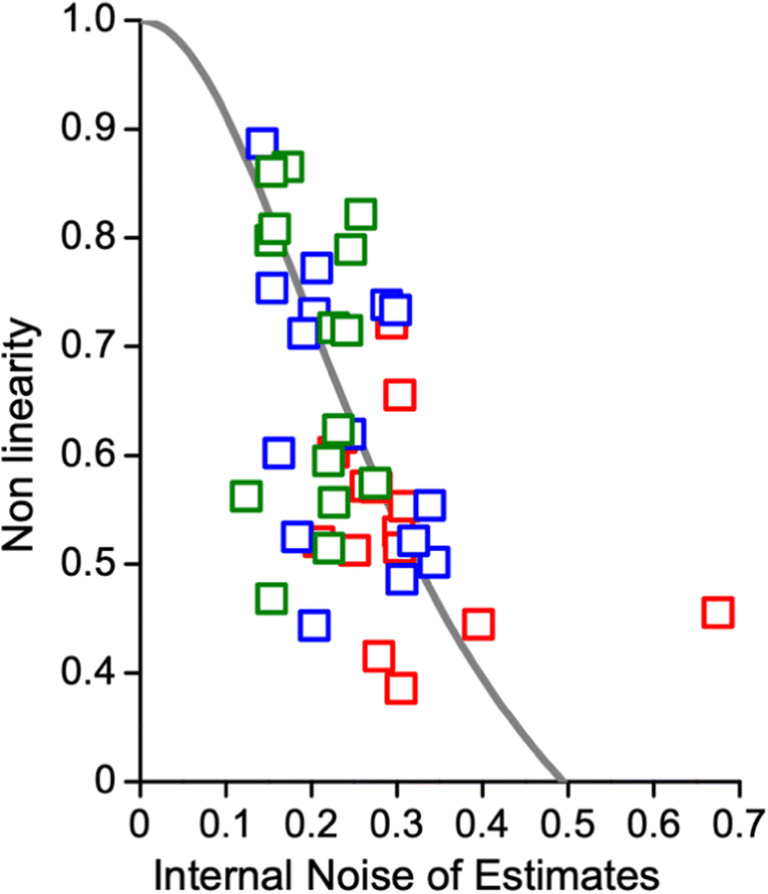
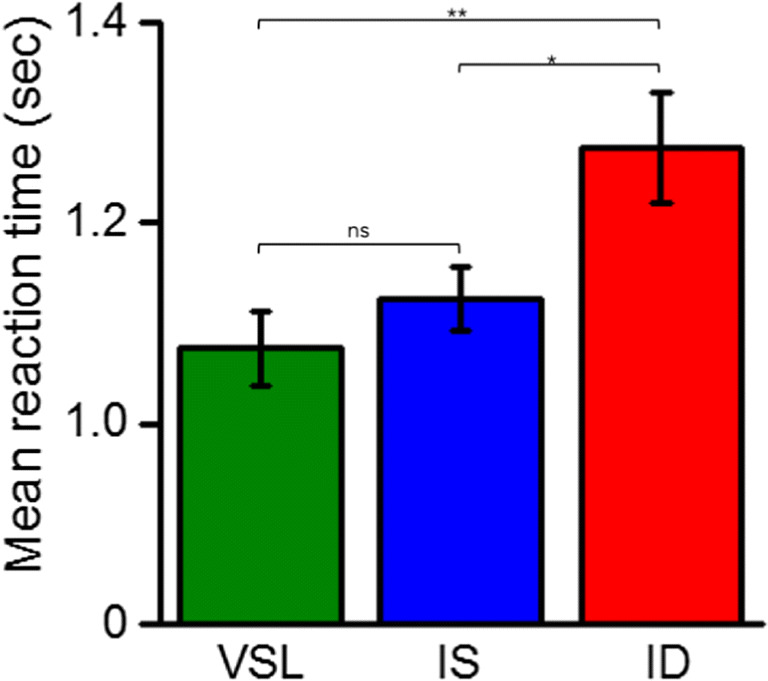
Humans and non-humans can extract an estimate of the number of items in a collection very rapidly, raising the question of whether attention is necessary for this process. Visual attention operates in various modes, showing selectivity both to spatial location and to objects. Here, we tested whether each form of attention can enhance number estimation, by measuring whether presenting a visual cue to increase attentional engagement will lead to a more accurate and precise representation of number, both when attention is directed to location and when it is directed to objects. Results revealed that enumeration of a collection of dots in the location previously cued led to faster, more precise, and more accurate judgments than enumeration in un-cued locations, and a similar benefit was seen when the cue and collection appeared on the same object. This work shows that like many other perceptual tasks, numerical estimation may be enhanced by the spread of active attention inside a pre-cued object.

Keywords: Bayesian modelling; Object-based attention.


Figures

Fig. 1
Fig. 1
Schematic example of the typical sequence of Egly, Driver, and Rafal (1994). The target, illustrated in the bottom row of the figure, comprised filled squares: the valid target requires a shift in attention from the preceding cue; in contrast the invalid targets require a between- or a within-object shift from the cue. Shifting attention from a valid location to an invalid one results in a cost in terms of reaction time (RT). ISI interstimulus interval
Fig. 2
Fig. 2
Example of a sequence of events within a trial (see also Fig. 1 for a schematic illustration of the original study by Egly et al., 1994). The target consisted of yellow dots presented either in the previously cued location (Target Valid, upper figure) or in an invalid location, which could be in the previously cued object (Target Invalid, middle figure) or in the other object (Target Invalid, lower figure). The collection of dots could never appear diagonal to the cue. After the presentation of the cloud of dots in one of the three possible locations, participants had to mouse click the corresponding perceived numerosity on a number line spanning from 1 to 35. ISI interstimulus interval
Fig. 3
Fig. 3
Precision analyses. (A) Estimation variability (σN) obtained from the PsiMLE package for the three conditions: valid same location (VSL – green), invalid same object (IS – blue), and invalid different object (ID – red). Precision decreased as the attention was diverted from the cued location to the un-cued object, but there was no significant difference between the two valid cued conditions, same object or same location. Significance values refer to post hoc t-test comparisons (*p < 0.05, **p < 0.01, ns p > 0.05). (B) Standard deviations of responses as a function of physical number. The color-coded lines show the best-fitting power functions of the three conditions; the black dashed line is for the data pooled over conditions. The exponents for the four curves are: all data 0.48; VSL data in dark green 0.54; IS data in blue 0.53 and ID data in red are 0.24
Fig. 4
Fig. 4
Relationship between the presented numerosity and average estimates, estimated separately for the three conditions (valid same location in green, invalid same object in blue, and invalid different object in red). Continuous lines represent the power-fitting function (β). Thin color-coded vertical lines represent the standard deviations. The small inset on the bottom right represents the mean betas for the three conditions, respectively. Significance values refer to post hoc comparisons (*p < 0.05, **p < 0.01, ns p > 0.05)
Fig. 5
Fig. 5
Illustration of the central-tendency model of non-linear mapping. (A) Probability density functions for likelihood, prior, and posterior (Eq. 3), for two physical displays of 5 or 30 dots to be mapped onto a 1–75 number line. For all three number lines, the prior is a Gaussian probability density function centered at 15 dots on the number line with a standard deviation of 5 (determined by best fit to data). The likelihood was also Gaussian, centered at the physical number L, with a standard deviation of 3 (determined by best fit to data). The posterior is the product of the sensory likelihood and the prior. If the prior is closer to the center of the test range, the posterior will be biased towards the center of the distribution. The strength of the bias depends on the relative uncertainty of likelihood and prior. As the standard deviation of the likelihood for larger magnitudes increases, the bias towards the prior also increases. (B) Data from Fig. 4, with the simulations shown by dashed curves. Thin color-coded vertical lines represent the standard deviations
Fig. 6
Fig. 6
Non-linearity index plotted against a measure of internal noise of estimation. The gray curve shows Bayesian model predictions (see Eq. 7); color-coded squares refer to the different condition tested (valid same location green; invalid same object blue, and invalid different object red)
Fig. 7
Fig. 7
Mean reaction times. Averaged reaction times calculated for each participant and each condition (Valid same location in green; invalid same object in blue; invalid different object in red). Color-coded dots represent the mean reaction times each subject each condition. Significance values refer to post hoc comparisons (*p < 0.05, **p < 0.01, ns p > 0.05)

Similar articles

Cited by

References

    1. Agrillo, C., & Bisazza, A. (2014). Spontaneous versus trained numerical abilities. A comparison between the two main tools to study numerical competence in non-human animals. Journal of Neuroscience Methods. 10.1016/j.jneumeth.2014.04.027 - PubMed
    1. Alvarez, G. A. (2011). Representing multiple objects as an ensemble enhances visual cognition. Trends in Cognitive Sciences. 10.1016/j.tics.2011.01.003 - PubMed
    1. Anobile G, Turi M, Cicchini GM, Burr DC. The effects of cross-sensory attentional demand on subitizing and on mapping number onto space. Vision Res. 2012;74:102–109. doi: 10.1016/j.visres.2012.06.005. - DOI - PubMed
    1. Anobile, Giovanni, Cicchini, G. M., & Burr, D. C. (2012a). Linear mapping of numbers onto space requires attention. Cognition. 10.1016/j.cognition.2011.11.006 - PubMed
    1. Anobile, Giovanni, Stievano, P., & Burr, D. C. (2013). Visual sustained attention and numerosity sensitivity correlate with math achievement in children. Journal of Experimental Child Psychology. 10.1016/j.jecp.2013.06.006 - PubMed

LinkOut - more resources