Incidence, Mortality, and Survival Trends of Primary CNS Tumors in Cali, Colombia, From 1962 to 2019
- PMID: 33156716
- PMCID: PMC7713581
- DOI: 10.1200/GO.20.00368
Incidence, Mortality, and Survival Trends of Primary CNS Tumors in Cali, Colombia, From 1962 to 2019
Abstract
Purpose: Global studies have shown varying trends of CNS tumors within geographic regions. In Colombia, the epidemiologic characteristics of CNS neoplasms are not well elucidated. We aimed to provide a summary of the descriptive epidemiology of primary CNS tumors among the urban population of Cali, Colombia.
Methods: We conducted a time-trend study from 1962 to 2019 using the Population-Based Cali Cancer Registry. The age-standardized rates per 100,000 person-years were obtained by direct method using the world standard population. Results were stratified by sex, age group at diagnosis, and histologic subtype. We used Joinpoint regression analysis to detect trends and obtain annual percentage change (APC) with 95% CIs. We estimated 5-year net survival using the Pohar-Perme method.
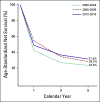
Results: During 1962 to 2016, 4,732 new cases of CNS tumors were reported. From 1985 to 2019, a total of 2,475 deaths from malignant CNS tumors were registered. A statistically significant increase in the trends of incidence (APC, 2.8; 95% CI, 2.1 to 3.5) and mortality (APC, 1.5; 95% CI, 1.1 to 2.0) rates was observed during the study. The most common malignant CNS tumor was glioblastoma (17.8% of all tumors), and the most frequent benign tumor was meningioma (17.2%). Malignancy was more common in males than in females. Unspecified malignant neoplasms represented 32% of all cases. The highest 5-year net survival was 31.4% during 2012 to 2016.
Conclusion: Our findings demonstrate an increasing burden of primary CNS tumors for the last 60 years, with a steady rate from the early 2010s. There was an improvement of 5-year net survival for the last decade. Males had higher mortality than did females. Additional efforts are needed to fully explore the geographic, environmental, and genetic contributors of CNS malignancies within the region.
Conflict of interest statement
The following represents disclosure information provided by authors of this manuscript. All relationships are considered compensated unless otherwise noted. Relationships are self-held unless noted. I = Immediate Family Member, Inst = My Institution. Relationships may not relate to the subject matter of this manuscript. For more information about ASCO's conflict of interest policy, please refer to
Open Payments is a public database containing information reported by companies about payments made to US-licensed physicians (
No potential conflicts of interest were reported.
Figures


Similar articles
-
Italian cancer figures, report 2012: Cancer in children and adolescents.Epidemiol Prev. 2013 Jan-Feb;37(1 Suppl 1):1-225. Epidemiol Prev. 2013. PMID: 23585445 English, Italian.
-
Head and neck cancer in Cali, Colombia: Population-based study.Community Dent Oral Epidemiol. 2022 Aug;50(4):292-299. doi: 10.1111/cdoe.12671. Epub 2021 Jun 8. Community Dent Oral Epidemiol. 2022. PMID: 34105170 Free PMC article.
-
Reliable information for cancer control in Cali, Colombia.Colomb Med (Cali). 2018 Mar 30;49(1):23-34. doi: 10.25100/cm.v49i1.3689. Colomb Med (Cali). 2018. PMID: 29983461 Free PMC article.
-
A system review of central nervous system tumors on children in China: epidemiology and clinical characteristics.BMC Cancer. 2024 Jan 27;24(1):138. doi: 10.1186/s12885-024-11883-w. BMC Cancer. 2024. PMID: 38281032 Free PMC article.
-
Primary brain and other central nervous system tumors in the United States (2014-2018): A summary of the CBTRUS statistical report for clinicians.Neurooncol Pract. 2022 Feb 22;9(3):165-182. doi: 10.1093/nop/npac015. eCollection 2022 May. Neurooncol Pract. 2022. PMID: 35601966 Free PMC article. Review.
Cited by
-
Sonic hedgehog signalling pathway in CNS tumours: its role and therapeutic implications.Mol Brain. 2024 Nov 20;17(1):83. doi: 10.1186/s13041-024-01155-w. Mol Brain. 2024. PMID: 39568072 Free PMC article. Review.
-
Primary central nervous system tumors survival in children in ten Colombian cities: a VIGICANCER report.Front Oncol. 2024 Feb 27;13:1326788. doi: 10.3389/fonc.2023.1326788. eCollection 2023. Front Oncol. 2024. PMID: 38505512 Free PMC article.
-
Postoperative complications after central nervous system tumor resection in pediatric patients admitted to an intensive care unit in Colombia.Front Oncol. 2024 Dec 6;14:1491943. doi: 10.3389/fonc.2024.1491943. eCollection 2024. Front Oncol. 2024. PMID: 39711949 Free PMC article.
-
Prognostic factors of pediatric ependymomas at a National Cancer Reference Center in Peru.Front Oncol. 2024 Jan 17;13:1331790. doi: 10.3389/fonc.2023.1331790. eCollection 2023. Front Oncol. 2024. PMID: 38298447 Free PMC article.
-
Advancing Neurosurgical Oncology and AI Innovations in Latin American Brain Cancer Care: Insights from a Center of Excellence.NeuroSci. 2025 Jun 10;6(2):54. doi: 10.3390/neurosci6020054. NeuroSci. 2025. PMID: 40559215 Free PMC article. Review.
References
-
- Louis DN, Perry A, Reifenberger G, et al. The 2016 World Health Organization classification of tumors of the central nervous system: A summary. Acta Neuropathol. 2016;131:803–820. - PubMed
-
- Siegel R, Naishadham D, Jemal A. Cancer statistics, 2013. CA Cancer J Clin. 2013;63:11–30. - PubMed
-
- International Agency for Research on Cancer GLOBOCAN 2018: Latin America and the Caribbean. http://gco.iarc.fr/today/data/factsheets/populations/904-latin-america-a...
-
- Legler JM, Ries LA, Smith MA, et al. Cancer surveillance series [corrected]: Brain and other central nervous system cancers: Recent trends in incidence and mortality. J Natl Cancer Inst. 1999;91:1382–1390. [Erratum: J Natl Cancer Inst 91:1693, 1999] - PubMed
MeSH terms
LinkOut - more resources
Full Text Sources

