. 2020 Sep 1;24(9):910-915.
doi: 10.5588/ijtld.19.0716.

The effect of TB treatment on health-related quality of life for people with advanced HIV

Affiliations

The effect of TB treatment on health-related quality of life for people with advanced HIV

V Opollo et al. Int J Tuberc Lung Dis. .

Abstract

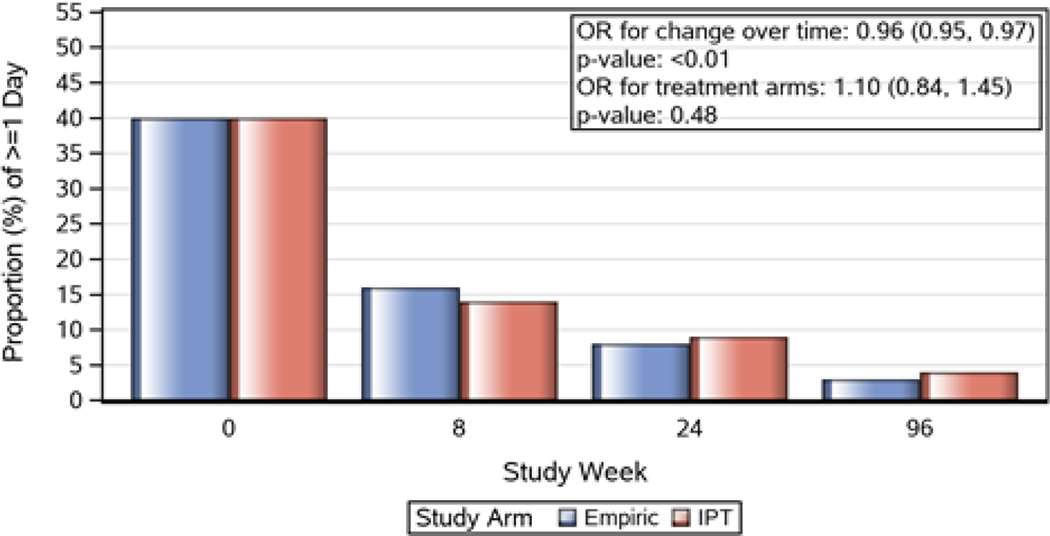
BACKGROUND: Study A5274 was an open-label trial of people with HIV (PLHIV) with CD4 cell count <50 cells/µL who were randomized to empirical TB treatment vs. isoniazid preventive therapy (IPT) in addition to antiretroviral therapy (ART). We evaluated health-related quality of life (HRQoL) by study arm, changes over time, and association with sociodemographic and clinical factors.METHODS: Participants aged >13 years were enrolled from outpatient clinics in 10 countries. HRQoL was assessed at Weeks 0, 8, 24 and 96 with questions about daily activity, hospital or emergency room visits, and general health status. We used logistic regression to examine HRQoL by arm and association with sociodemographic and clinical factors.RESULTS: Among 850 participants (424 empiric arm, 426 IPT arm), HRQoL improved over time with no difference between arms. At baseline and Week 24, participants with WHO Stage 3 or 4 events, or those who had Grade 3 or 4 signs/symptoms, were significantly more likely to report poor HRQoL using the composite of four HRQoL measures.CONCLUSION: HRQoL improved substantially in both arms during the study period. These findings show that ART, TB screening, and IPT can not only reduce mortality, but also improve HRQoL in PLHIV with advanced disease.


Figures

Figure 1.
Figure 1.. Health related quality of life measures by treatment strategy at weeks 0, 8, 24 and 96 (odds ratio and 95% confidence interval, based on generalized estimating equation [GEE] model)
Panel 1a. Proportion of participants reporting ≥1 day stayed in bed Panel 1b. Proportion of participants reporting ≥1 day cut down on usual activities Panel 1c. Proportion of participants reporting ≥1 night admitted in hospital ward Panel 1d. Proportion of participants reporting ≥1 visit to an emergency room Panel 1e. Proportion of participants reporting ≥1 day stayed in bed or cut down on daily activities or stayed in hospital or visit to an emergency room (Composite measure) Panel 1f. Proportion of participants who described their health as fair or poor Panel 1g. Participants’ rating of current state of health, using visual analog scale (higher rate represents better health)The whiskers in the box plot represent the minimum and maximum values of the HRQoL outcome based on rating of current health status (scale 0–100).

References

    1. World Health Organization. Global tuberculosis report 2019. 2019.
    1. Brown J, Capocci S, Smith C, Morris S, Abubakar I, Lipman M. Health status and quality of life in tuberculosis. Int J Infect Dis. 2015;32:68–75. - PubMed
    1. Geneva WHO. Global tuberculosis report 2018.
    1. Yee D, Valiquette C, Pelletier M, Parisien I, Rocher I, Menzies D. Incidence of serious side effects from first-line antituberculosis drugs among patients treated for active tuberculosis. Am J Respir Crit Care Med. 2003;167(11):1472–7. - PubMed
    1. Centers for Disease Control and Prevention A. Treatment for TB disease. accessed 27/1/2020. http://www.cdc.gov/tb/topic/treatment/tbdisease.htm 2012.

Publication types