. 2020 Nov 6;18(11):e3000921.
doi: 10.1371/journal.pbio.3000921. eCollection 2020 Nov.

Task-related activity in human visual cortex

Affiliations

Task-related activity in human visual cortex

Zvi N Roth et al. PLoS Biol. .

Abstract

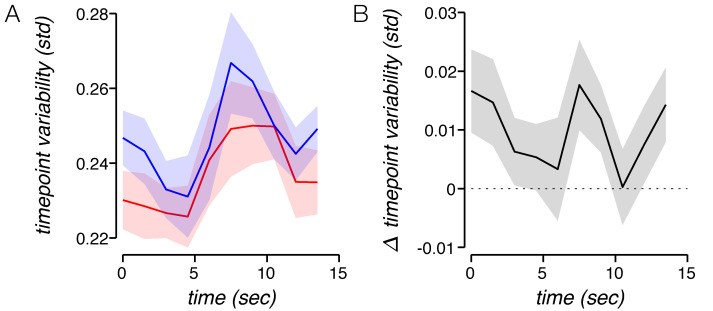
The brain exhibits widespread endogenous responses in the absence of visual stimuli, even at the earliest stages of visual cortical processing. Such responses have been studied in monkeys using optical imaging with a limited field of view over visual cortex. Here, we used functional MRI (fMRI) in human participants to study the link between arousal and endogenous responses in visual cortex. The response that we observed was tightly entrained to task timing, was spatially extensive, and was independent of visual stimulation. We found that this response follows dynamics similar to that of pupil size and heart rate, suggesting that task-related activity is related to arousal. Finally, we found that higher reward increased response amplitude while decreasing its trial-to-trial variability (i.e., the noise). Computational simulations suggest that increased temporal precision underlies both of these observations. Our findings are consistent with optical imaging studies in monkeys and support the notion that arousal increases precision of neural activity.

Trial registration: ClinicalTrials.gov NCT00001360.


Conflict of interest statement

The authors have declared that no competing interests exist.

Figures

Fig 1
Fig 1. Experiment design and task-related fMRI activity in early visual cortex.
(A) Experiment design. Participants were instructed to continuously fixate on a central cross while performing a 2AFC orientation discrimination task on a peripheral stimulus. On each trial, a small grating was briefly presented for 200 ms in the bottom right of the screen. Participants indicated whether it was tilted CW or CCW relative to vertical and received immediate auditory feedback. Participants maintained fixation until the next trial. In each run, participants could gain either a high or low monetary reward for correct performance. (B) Medial view (inset), and a flattened map of ipsilateral visual cortex (bottom panels) of participant P1. Left: visual eccentricity. Hue indicates eccentricity of the population receptive field center for each voxel. Retinotopic borders of V1–V3 were defined by an anatomical template extending to 80° eccentricity, well beyond the spatial extent of the screen. Map threshold, r2 > 0.1. Shaded region on medial views indicates cortex not included in the imaged field of view. Center: response correlation, showing a widespread fMRI response linked to task timing. Map threshold, r > 0.3. Hue indicates correlation with best-fitting cosine at the task frequency. Right: response phase. Same threshold as middle panel, with hue indicating phase of best-fitting cosine for each voxel. Phase values indicate the response latency for each voxel. Underlying data can be found at https://osf.io/cbjq6/. 2AFC, two-alternative forced choice; CCW, counterclockwise; CW, clockwise; fMRI, functional MRI.
Fig 2
Fig 2. Reward modulates arousal, evident in pupil size and heart rate.
(A) Mean pupil size for high- and low-reward trials. Pupil size exhibited a response that was time-locked to trial timing, showing an increase at the beginning of the trial followed by a return to baseline by 4 s. High-reward runs (red) evoked larger task-related pupil changes than low-reward runs (blue). (B) Heart rate for mean trial, averaged across participants. Heart rate exhibited a task-related response and was greater for high reward (red) than for low reward (blue). (C) Pulse-to-BOLD kernel before (solid line) and after (dashed line) global signal regression. Shaded regions, ±SEM across participants. Underlying data can be found at https://osf.io/cbjq6/. arb., arbitrary; BOLD, blood oxygen level–dependent; std, standard deviation.
Fig 3
Fig 3. Task-related response as a function of visual eccentricity.
fMRI responses in three subregions of EVC defined by visual eccentricities, for a representative participant (P1). Left, <1 deg eccentricity; center, 1–10 deg eccentricity; right, >10 deg eccentricity. Time series from EVC were averaged across all voxels within each bin and across all trials within high-reward (red) and low-reward (blue) runs. Shaded regions, ±SEM across trials. Underlying data can be found at https://osf.io/cbjq6/. EVC, early visual cortex; fMRI, functional MRI; std, standard deviation.
Fig 4
Fig 4. Task-related response amplitude is modulated by reward.
(A) EVC task-related response amplitude as function of eccentricity. Shaded regions, ±SEM across participants. (B) Low-reward amplitude subtracted from high-reward amplitude as function of eccentricity. (C) Amplitude of EVC task-related response, for all participants. Amplitude was quantified by the std of the average trial. Data points and lines connecting high- and low-reward amplitudes are colored according to the difference between high- and low-reward amplitude for each participant. Underlying data can be found at https://osf.io/cbjq6/. EVC, early visual cortex; fMRI, functional MRI; std, standard deviation.
Fig 5
Fig 5. Higher reward decreases three measures of response variability.
(A) Time-point variability of task-related response. Leftmost panel, schematic illustration of analysis. Gray lines, simulated task-related responses; green dotted line, mean response; green error bars, std at each time point. Time-point variability was quantified by taking the std of each time point in the task-related response, averaging across time points, and then averaging across participants. Second panel, time-point variability as function of eccentricity, for high (red) and low (blue) reward. Third panel, high-reward time-point variability subtracted from low-reward time-point variability as function of eccentricity. Shaded regions, ±SEM across participants. Rightmost panel, mean time-point variability of EVC task-related response, for all participants. Time-point variability was significantly lower for high- than for low-reward trials. Data points and lines connecting high- and low-reward variabilities in all right panels are colored, as in Fig 4C, according to the difference between high- and low-reward response amplitude for each participant. (B) Leftmost panel, schematic illustration of analysis. Green horizontal lines, amplitudes of simulated responses. Amplitude variability was quantified by first computing the amplitude (i.e., std) of each trial, then computing the std across trials, and finally averaging across participants. Second panel, amplitude variability as function of eccentricity, for high (red) and low (blue) reward. Third panel, high-reward amplitude variability subtracted from low-reward amplitude variability as function of eccentricity. Shaded regions, ±SEM across participants. Rightmost panel, amplitude variability of EVC task-related response, for all participants. Amplitude variability was significantly lower for high- than for low-reward trials. (C) Leftmost panel, schematic illustration of analysis. Green vertical lines, latencies of simulated responses. Temporal variability was quantified by taking the circular std of the phase of the Fourier component corresponding to a single cycle per trial, and averaging across participants. Second panel, temporal variability as function of eccentricity, for high (red) and low (blue) reward. Third panel, high-reward temporal variability subtracted from low-reward temporal variability as function of eccentricity. Shaded regions, ±SEM across participants. Rightmost panel, temporal variability of EVC task-related response, for all participants. Temporal variability was significantly lower for high- than for low-reward trials. Underlying data can be found at https://osf.io/cbjq6/. fMRI, functional MRI; EVC, early visual cortex; std, standard deviation.
Fig 6
Fig 6. Impact of three distinct noise sources on measures of hemodynamic variability.
(A) Left, IRF used for the first simulation. Right, average trial response with no noise. The response differs slightly from the IRF because the previous trial has a prolonged influence on the signal. (B) Left, average trials for independent noise ranging from minimal (red) to maximal (blue), for first simulation. Right, average time-point variability time course for the different independent noise levels. (C) Left, average trials for response amplitude jitter ranging from minimal (red) to maximal (blue). Right, average time-point variability for the different amplitude jitter levels. (D) Average trials for response temporal jitter ranging from minimal (red) to maximal (blue). Right, average time-point variability for the different temporal jitter levels. (E-H) Same as (A–D), for second simulation, using a different IRF. arb., arbitrary; IRF, impulse response function; std, standard deviation.
Fig 7
Fig 7. Higher reward decreases time-point variability dynamically throughout the trial.
(A) Mean group time-point variability time series. At each time point, variability was computed per participant and then averaged. Time-point variability changes systematically throughout a trial, in a similar way for low-reward and high-reward runs. Shaded regions, ±SEM across participants. (B) High-reward time-point variability subtracted from low-reward time-point variability. Time-point variability was greater for low reward than for high reward across all time points, and the difference between the two exhibits a temporal profile similar to temporal variability for each of the two reward conditions. Shaded regions, ±SEM across participants. Underlying data can be found at https://osf.io/cbjq6/. std, standard deviation.

References

    1. Sirotin YB, Das A. Anticipatory haemodynamic signals in sensory cortex not predicted by local neuronal activity. Nature. 2009;457(7228):475–9. Epub 2009/01/23. 10.1038/nature07664 - DOI - PMC - PubMed
    1. Liu TT. Noise contributions to the fMRI signal: An overview. NeuroImage. 2016;143:141–51. Epub 2016/09/11. 10.1016/j.neuroimage.2016.09.008 . - DOI - PubMed
    1. Murphy K, Birn RM, Bandettini PA. Resting-state fMRI confounds and cleanup. NeuroImage. 2013;80:349–59. Epub 2013/04/11. 10.1016/j.neuroimage.2013.04.001 - DOI - PMC - PubMed
    1. Power JD, Plitt M, Gotts SJ, Kundu P, Voon V, Bandettini PA, et al. Ridding fMRI data of motion-related influences: Removal of signals with distinct spatial and physical bases in multiecho data. Proceedings of the National Academy of Sciences of the United States of America. 2018;115(9):E2105–e14. Epub 2018/02/15. 10.1073/pnas.1720985115 - DOI - PMC - PubMed
    1. Power JD, Mitra A, Laumann TO, Snyder AZ, Schlaggar BL, Petersen SE. Methods to detect, characterize, and remove motion artifact in resting state fMRI. NeuroImage. 2014;84:320–41. Epub 2013/09/03. 10.1016/j.neuroimage.2013.08.048 - DOI - PMC - PubMed

Publication types

Associated data