. 2020 Nov 6;15(11):e0239839.
doi: 10.1371/journal.pone.0239839. eCollection 2020.

Predictions from masked motion with and without obstacles

Affiliations

Predictions from masked motion with and without obstacles

Ariel Goldstein et al. PLoS One. .

Abstract

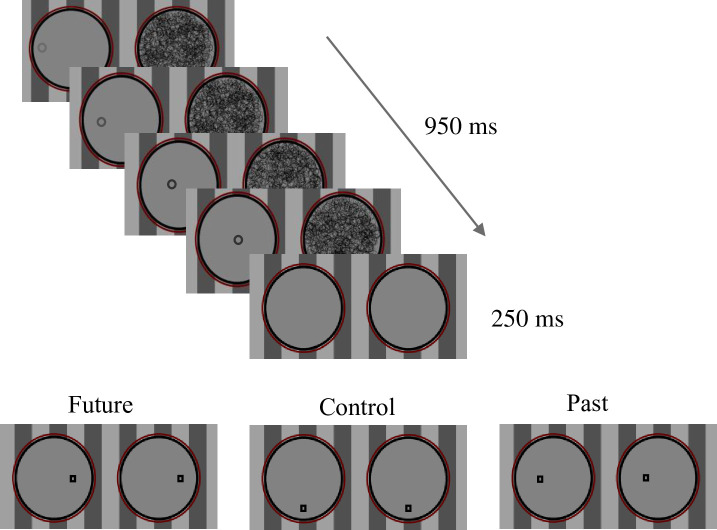
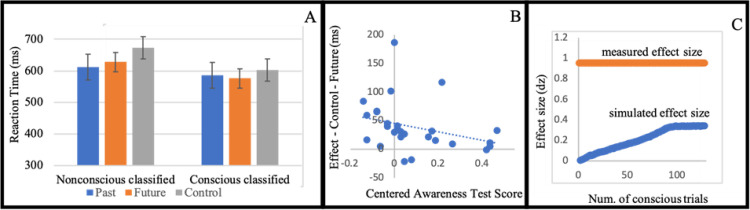
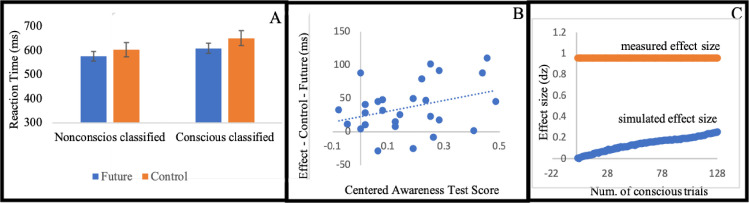
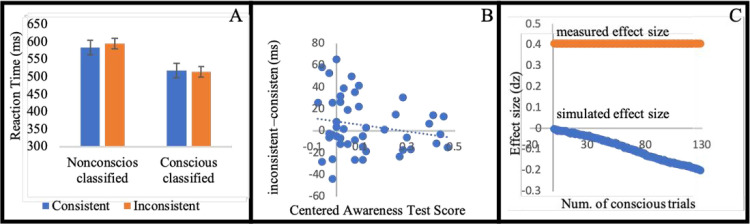
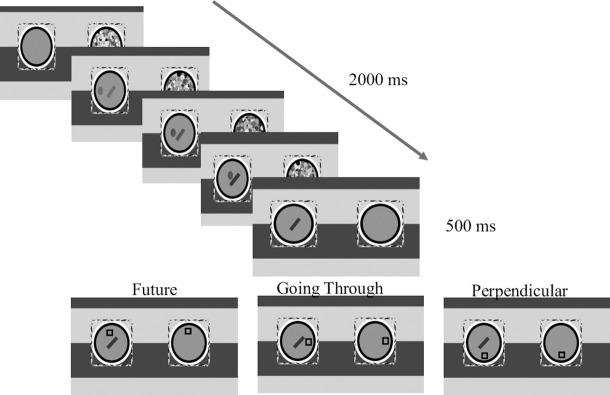
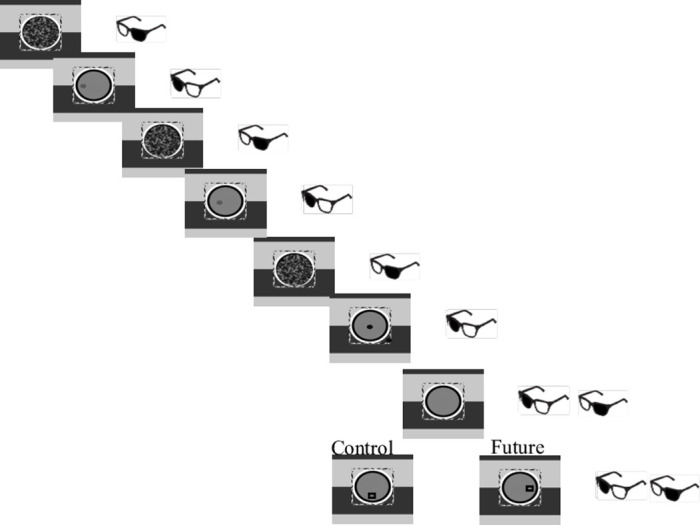
Predicting the future is essential for organisms like Homo sapiens, who live in a dynamic and ever-changing world. Previous research has established that conscious stimuli can lead to non-conscious predictions. Here we examine whether masked stimuli can also induce such predictions. We use masked movement-with and without obstacles-to examine predictions from masked stimuli. In six experiments a moving object was masked using continuous flash suppression (CFS). A few hundred milliseconds after the object had disappeared, a conscious probe appeared in a location that was either consistent with the masked stimulus or not. In Experiments 1-3 the movement was linear, and reaction times (RTs) indicated predictions that were based on direction and speed of movement. In Experiment 4, the masked moving object collided with an obstacle and then disappeared. Predictions in this case should reflect deflection, and indeed reaction times revealed predictions on the deflection route. In Experiments 5 and 6 we introduce an innovative way of using eye-tracking during continuous flash suppression (CFS) and report physiological evidence-in the forms of eye-movements-for masked stimuli induced predictions. We thus conclude that humans can use dynamic masked stimuli to generate active predictions about the future, and use these predictions to guide behavior. We also discuss the possible interpretations of these findings in light of the current scientific discussion regarding the relation between masked presentation, subliminal perception and awareness measurement methods.


Conflict of interest statement

The authors have declared that no competing interests exist.

Figures

Fig 1
Fig 1. Description of the different conditions.
The prime is masked and it moves on a straight route. The target is presented to both eyes; thus, it is consciously perceived. In the past condition the target appeared in a location that the masked probe had moved through. In the future condition the target appeared in an expected location on the route. Finally, in the control condition the target appeared in a perpendicular location to the route. All locations were equidistant from the last location of the prime.
Fig 2
Fig 2
(A) Mean reaction time for condition (standard error to each side). (B) Each dot represents a participant. The horizontal axis (x-axis) represents the centered Awareness score. The vertical axis is the behavioral effect of the participant. The intercept is the predicted effect for a participant who is unaware to the stimuli. The value of 0.1 on the horizontal axis is the frequentist threshold. (C) The horizontal value (x-axis) represents the number of simulated conscious trials (by sampling from the supraliminal training phase). The vertical axis is the measured effect size. In blue we mark the average effect size for 10,000 iteration for each sample size. The standard error is smaller than 0.01 for each simulated number of conscious trials. In red is the measured effect size of the actual masked part.
Fig 3
Fig 3
(A) Mean reaction time for condition (standard error to each side). (B) Each dot represents a participant. The horizontal axis (x-axis) represents the centered Awareness score. The vertical axis is the behavioral effect of the participant. The intercept is the predicted effect for a participant who is unaware of the stimuli. The value of 0.1 on the horizontal axis is the frequentist threshold. (C) The horizontal value (x-axis) represents the number of simulated conscious trials (by sampling from the supraliminal training phase). The vertical axis is the measured effect size. In blue we mark the average effect size for 10,000 iteration for each sample size. The standard error is smaller than 0.01 for each simulated number of conscious trials. In red is the measured effect size of the actual masked part.
Fig 4
Fig 4
(A) Mean reaction time for condition (standard error to each side). (B) Each dot represents a participant. The horizontal axis (x-axis) represents the centered Awareness score. The vertical axis is the behavioral effect of the participant. The intercept is the predicted effect for a participant who is unaware of the stimuli. The value of 0.1 on the horizontal axis is the frequentist threshold. (C) The horizontal value (x-axis) represents the number of simulated conscious trials (by sampling from the supraliminal training phase). The vertical axis is the measured effect size. In blue we mark the average effect size for 10,000 iteration for each sample size. The standard error is smaller than 0.01 for each simulated number of conscious trials. In red is the measured effect size of the actual masked part.
Fig 5
Fig 5. Description of the different conditions.
The prime is masked and it moves on a straight route. In the future condition the target appears perpendicular to the ball’s motion in the location consistent with bouncing from the obstacle. In the Perpendicular condition the target appears perpendicular to the linear motion (but on the other side of the future condition). In the Going through condition the target appears in continuation of the linear motion, as if it had gone through the obstacle.
Fig 6
Fig 6
(A) Mean reaction time for condition (standard error to each side). (B) Each dot represents a participant. The horizontal axis (x-axis) represents the centered Awareness score. The vertical axis is the behavioral effect of the participant. The intercept is the predicted effect for a participant who is unaware of the stimuli. The value of 0.1 on the horizontal axis is the frequentist threshold. (C) The horizontal value (x-axis) represents the number of simulated conscious trials (by sampling from the supraliminal training phase). The vertical axis is the measured effect size. In blue we mark the average effect size for 10,000 iteration for each sample size. The standard error is smaller than 0.01 for each simulated number of conscious trials. In red is the measured effect size of the actual masked part.
Fig 7
Fig 7. Description of the different conditions.
The prime is masked and it moves on a straight route. The target is presented to both eyes; thus, it is consciously perceived. In the future condition the target appeared in an expected location on the route. In the control condition the target appeared in a perpendicular location to the route. All locations were equidistant from the last location of the prime.
Fig 8
Fig 8. Two examples of data rotation.
Original data on the left, and rotated data on the right.
Fig 9
Fig 9. The graph describes, for each time point, the mean distance of the gaze from the center of the screen (which is also the final point of masked probe).
Each point is the average across all participants and all trials. Red marks the average gaze during the masked probe presentation. Blue marks the average gaze during the delay period–between the offset of the masked probe and the onset of the conscious target. 1-pixel equals 0.024-degree in the visual field.
Fig 10
Fig 10. The graph describes, for each time point, the mean distance of the gaze from the center of the screen (which is also the final point of the masked probe).
Each point is the average across all participants and all trials. Red marks the average gaze during the masked probe presentation. Blue marks the average gaze during the delay period–between the offset of the masked probe and the onset of the conscious target. 1-pixel equals 0.024-degree in the visual field.

References

    1. DeLucia PR, Mather RD. Motion Extrapolation of Car-Following Scenes in Younger and Older Drivers. Hum Factors J Hum Factors Ergon Soc [Internet]. 2006;48(4):666–74. Available from: http://hfs.sagepub.com/cgi/doi/10.1518/001872006779166352 - DOI - PubMed
    1. Stevens C, Byron T.: Sweet Anticipation: Music and the Psychology of Expectation. Vol. 24, Music Perception. 2007. p. 511–4.
    1. Chennu S, Noreika V, Gueorguiev D, Blenkmann A, Kochen S, Ibáñez A, et al. Expectation and attention in hierarchical auditory prediction. J Neurosci. 2013;33:11194–205. 10.1523/JNEUROSCI.0114-13.2013 - DOI - PMC - PubMed
    1. Balas B, Sinha P. “Filling-in” colour in natural scenes. Vol. 15, Visual Cognition. 2007. p. 765–78.
    1. Arnon I, Clark E V. Why Brush Your Teeth Is Better Than Teeth–Children’s Word Production Is Facilitated in Familiar Sentence-Frames. Lang Learn Dev [Internet]. 2011. March 31 [cited 2015 Jan 6];7(2):107–29. Available from: http://www.tandfonline.com/doi/abs/10.1080/15475441.2010.505489 - DOI

Publication types