. 2021 Jan 20;109(2):299-313.e9.
doi: 10.1016/j.neuron.2020.10.005. Epub 2020 Nov 5.

Neuronal Autophagy Regulates Presynaptic Neurotransmission by Controlling the Axonal Endoplasmic Reticulum

Affiliations

Neuronal Autophagy Regulates Presynaptic Neurotransmission by Controlling the Axonal Endoplasmic Reticulum

Marijn Kuijpers et al. Neuron. .

Erratum in

Abstract

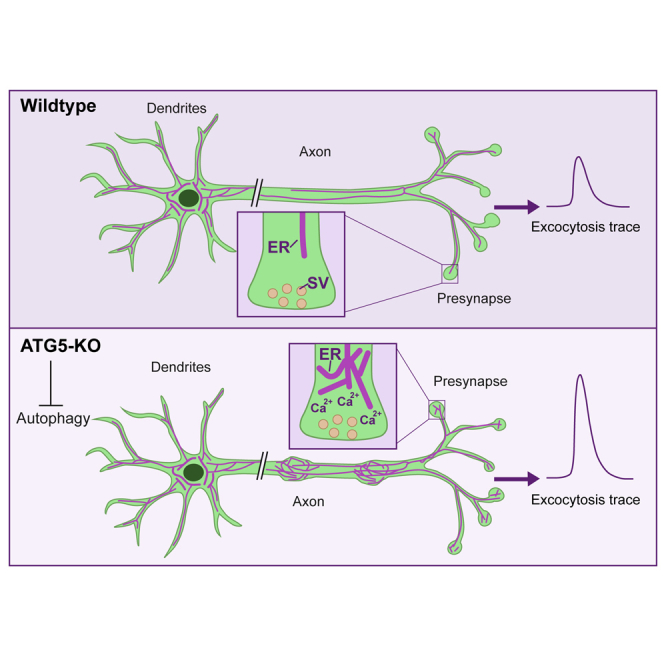
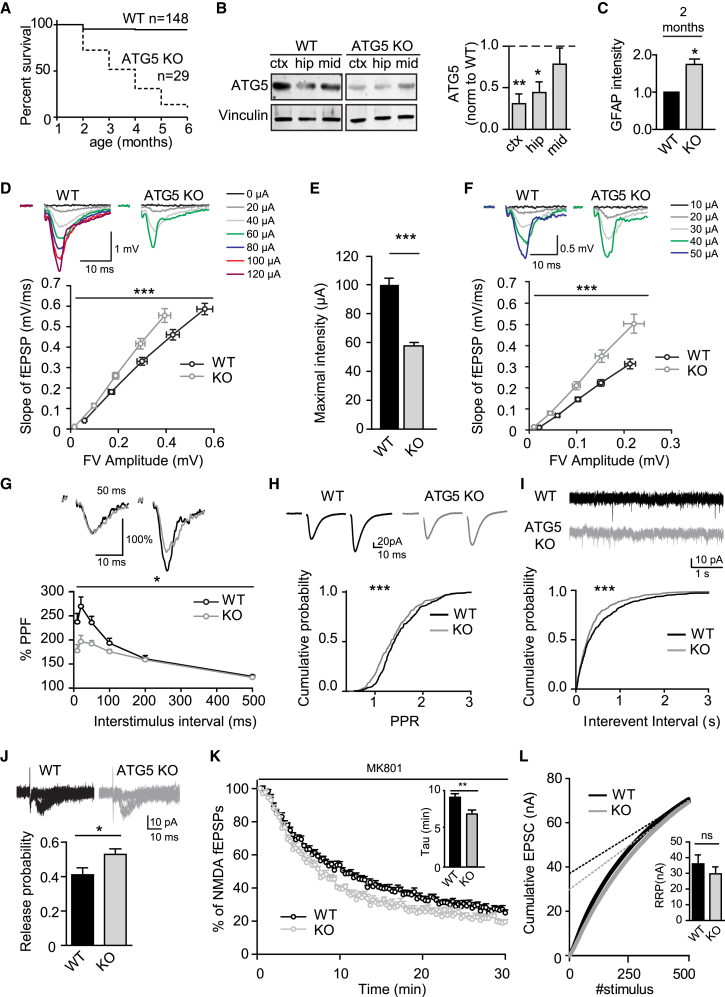
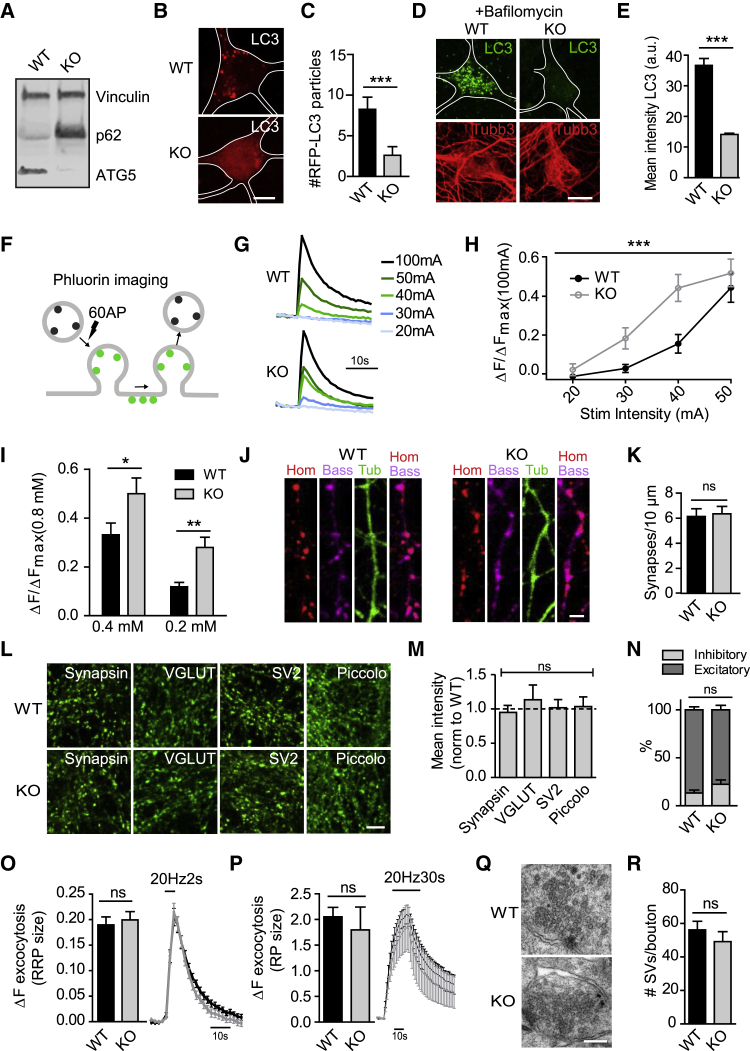
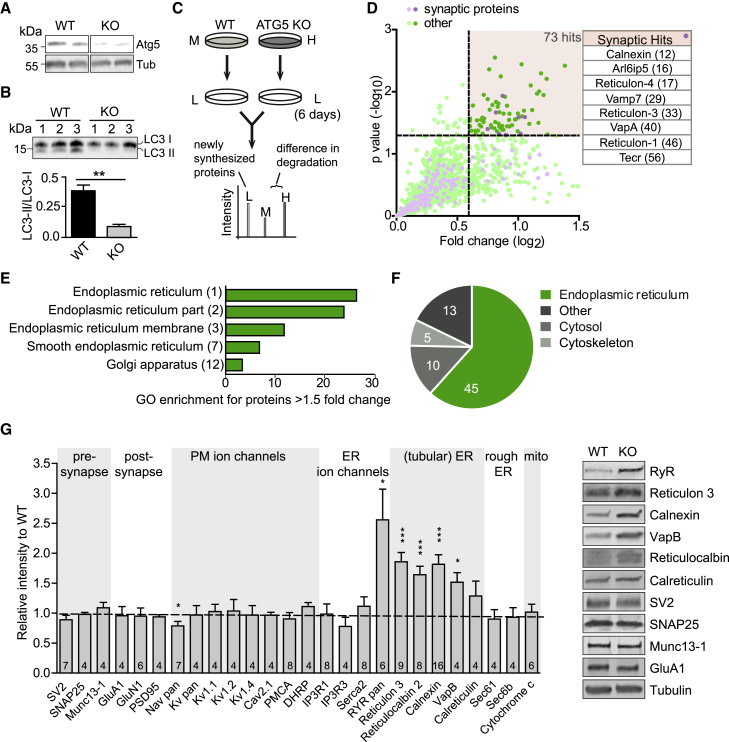
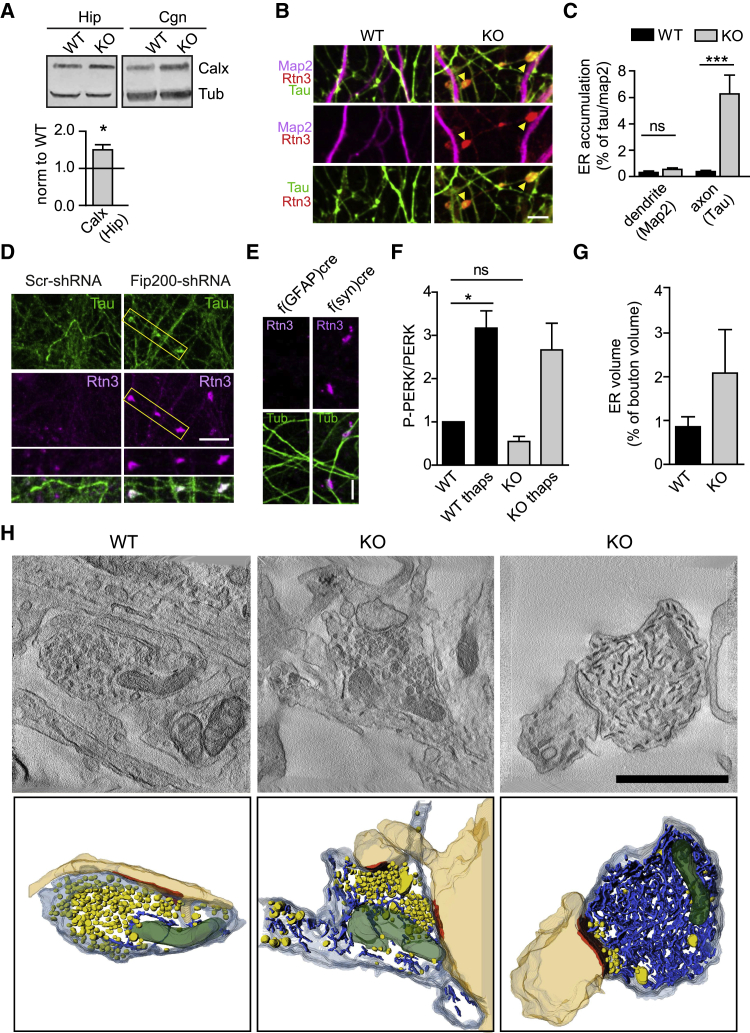
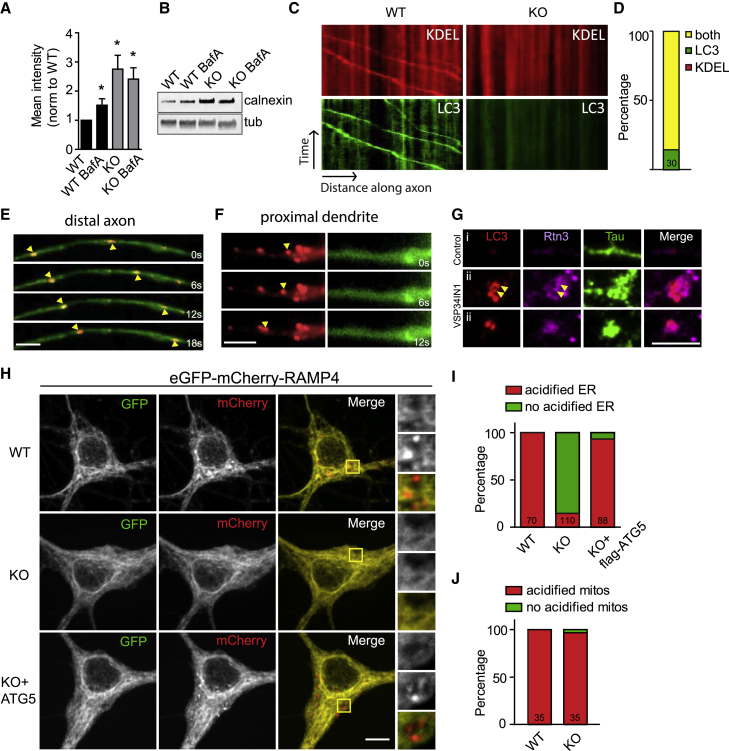
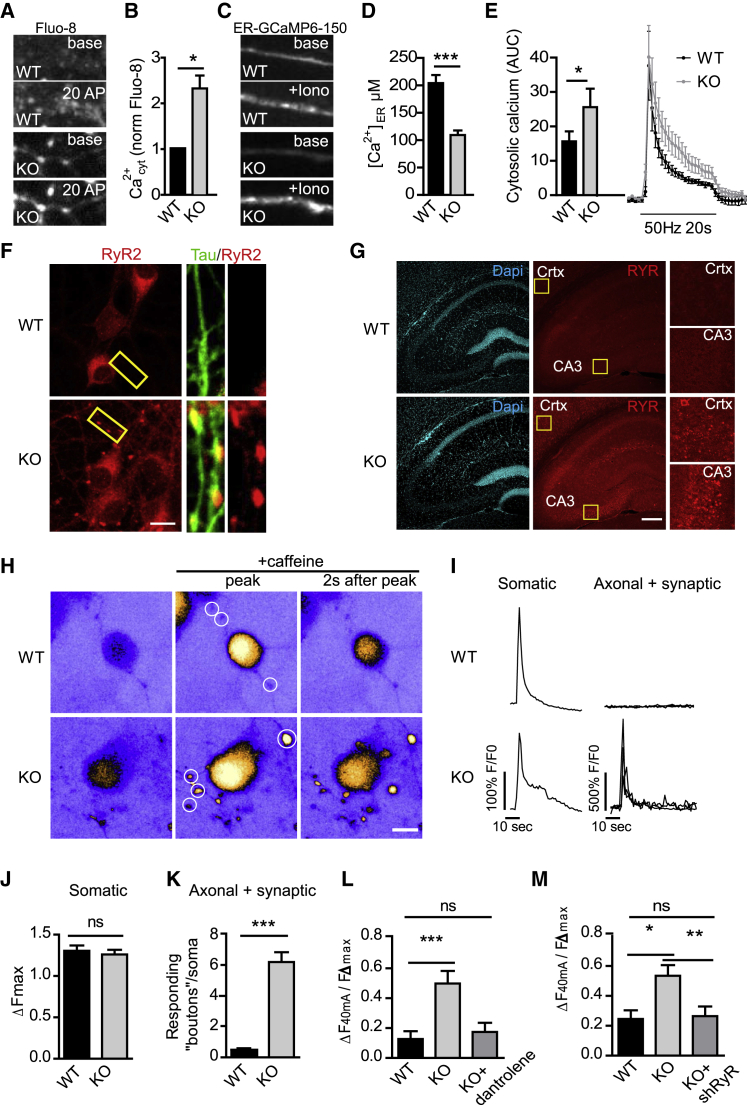
Neurons are known to rely on autophagy for removal of defective proteins or organelles to maintain synaptic neurotransmission and counteract neurodegeneration. In spite of its importance for neuronal health, the physiological substrates of neuronal autophagy in the absence of proteotoxic challenge have remained largely elusive. We use knockout mice conditionally lacking the essential autophagy protein ATG5 and quantitative proteomics to demonstrate that loss of neuronal autophagy causes selective accumulation of tubular endoplasmic reticulum (ER) in axons, resulting in increased excitatory neurotransmission and compromised postnatal viability in vivo. The gain in excitatory neurotransmission is shown to be a consequence of elevated calcium release from ER stores via ryanodine receptors accumulated in axons and at presynaptic sites. We propose a model where neuronal autophagy controls axonal ER calcium stores to regulate neurotransmission in healthy neurons and in the brain.

Keywords: autophagy, ERphagy, presynapse, neurotransmission, endoplasmic reticulum, calcium, ryanodine receptor.


Conflict of interest statement

Declaration of Interests The authors declare no competing interests.

Figures

None
Graphical abstract
Figure 1
Figure 1
Selective Loss of Neuronal Autophagy Facilitates Excitatory Neurotransmission (A) Decreased survival of KO mice conditionally deleted for ATG5 by transgenic expression of Cre recombinase under the telencephalon-specific EMX promoter (ATG5flox/flox; EMX1-Cre). (B) Western blot and quantification showing an ATG5 decrease primarily in the cortex (ctx) and hippocampus (hip) of 2-month-old ATG5-cKO mice. n = 4 mouse pairs for ctx and midbrain (mid) and n = 3 mouse pairs for hip, one-sample t test. (C) Quantification of GFAP immunostaining in 6- to 7-week-old control and ATG5-cKO brain slices. Slices were taken from 3 mice; one-sample t test. See also Figure S1C. (D) Basal excitatory neurotransmission measured as the relationship between fiber volley (FV) amplitudes and slopes of fEPSPs in WT control (n = 24 slices, 12 mice) and ATG5-cKO (n = 24 slices, 12 mice) mice. Representative fEPSP traces (above) and quantified data are shown. Significant difference between WT control and ATG5-cKO slices encompassing the curve; two-way repeated-measures ANOVA. (E) A lower stimulation intensity is required to elicit maximal responses in ATG5-cKO (58.8 ± 2.1 μA) compared with control mice (100.8 ± 4.6 μA); t test. (F) Basal excitatory neurotransmission measured as relationships between FV amplitudes and slopes of fEPSPs in WT control (n = 11 slices, 6 mice) and ATG5-cKO (n = 10 slices, 6 mice) mice in the presence of the GABAA receptor antagonist picrotoxin (50 μM). Representative fEPSP traces (above) and quantified data are shown. Significant difference between WT control and ATG5-cKO slices encompassing the curve; two-way repeated-measures ANOVA. (G) Measurements of paired-pulse facilitation (PPF) in the presence of the GABAA receptor antagonist picrotoxin (50 μM) reveal significantly reduced PPF in ATG5-cKO (n = 10 slices, 6 mice) compared with control (n = 11 slices, 6 mice) mice. Representative traces of PPF at a 50-ms interstimulus interval (above) and quantified data over a range of interstimulus intervals (10–500 ms), given as a percentage of the second in relation to the first response (percent PPF), show reduced facilitation of the second response in ATG5-cKO mice; two-way repeated-measures ANOVA. (H) Cumulative probability shows a left-shifted distribution for PPR in ATG5-cKO mice. n = 28 (WT) or 30 (KO) slices from 8 animals; Kolmogorov-Smirnov test. (I) Cumulative probability distribution shows decreased interevent intervals for sEPSCs in ATG5-cKO mice. n = 17 (WT) or 21 (KO) cells from 7 and 6 animals, respectively; Kolmogorov-Smirnov test. (J) Release probability evaluated by a minimal stimulation protocol shows increased release probability (i.e., decreased failure rate) in ATG5-cKO mice. n = 23 (WT) or 24 (KO) cells from 5 animals; t test. (K) Release probability evaluated by NMDA receptor-mediated fEPSP amplitude decay. Averaged NMDA receptor-mediated amplitudes in the presence of MK801 (30 μM) show significantly faster decay in KO mice (see tau values in the bar graph). n = 12 (WT) or 10 (KO) slices from 7 and 6 animals, respectively; t test. See also Figures S2B and S2C. (L) Estimation of RRP size by back-extrapolation (last 50 data points) of the cumulative EPSC to the y axis. n = 13 (WT) or 15 (KO) cells from 4 animals; Mann-Whitney test. All data show mean ± SEM. ns, not significant; p < 0.05, ∗∗p < 0.01, ∗∗∗p < 0.001.
Figure 2
Figure 2
ATG5-iKO Hippocampal Neurons Display Increased Stimulation-Dependent SV Release (A) Immunoblot showing ATG5 decrease and p62 increase in lysates from tamoxifen-inducible ATG5-iKO (KO) hippocampal cultures. (B and C) Representative images (B) of hippocampal WT and KO hippocampal neurons expressing mRFP-LC3. Note the decreased LC3 punctum numbers in ATG5 KO neurons; quantified in (C). Scale bar, 10 μm. n = 20 cells from a representative experiment; Mann-Whitney test. (D and E) ATG5 KO hippocampal neurons show deficient LC3-positive punctum formation upon bafilomycin treatment (10 nm, 4 h). Representative immunofluorescence images show LC3 staining in (D) (quantified in E). Scale bar, 10 μm. n = 42 cells, 1 experiment; Mann-Whitney test. (F–H) Detection of exocytosis using Synaptophysin-pHluorin. (F) Schematic showing reporter de-acidification during vesicle fusion with the plasma membrane. (G) Example traces (averaged from a representative experiment) showing a stimulus-dependent decrease in pHluorin signal in WT and KO hippocampal synapses. (H) Graph showing mean peak fluorescence upon different stimulation intensities. Values per cell are normalized to the corresponding maximal fluorescent peak at 100 mA (Fmax). n = 17–35 cells, 20 boutons per cell, 5 independent experiments; two-way ANOVA. (I) Graph showing mean peak fluorescence of the pHluorin signal under conditions of different extracellular calcium concentrations. Values per cell are normalized to the corresponding Fmax at 0.8 mM calcium. n = 21 cells, 20 boutons per cell, 3 independent experiments; t test. (J) Representative confocal images of hippocampal neurons immunostained for β3-tubulin (green), Homer 1 (postsynaptic, red), and Bassoon (presynaptic, magenta). Scale bar, 2 μm. (K) Synapse numbers in WT and KO cultures expressed as the number of Homer 1/Bassoon-positive puncta along β3-tubulin-positive neurite length. n = 3 independent experiments, ~2,900 synapses per genotype; paired t test. (L) Representative confocal images of hippocampal neurons immunostained for Synapsin-1, VGLUT1, SV2, and Piccolo. Scale bar, 5 μm. (M) Quantification of Synapsin-1, VGLUT1, SV2, and Piccolo immunostaining intensities. The mean values for the control are set to 1, and the mean value for the KO is expressed relative to this. n = 3 independent experiments, 26-37 images per condition; one-sample t test. (N) Percentage of inhibitory and excitatory synapses in WT and KO hippocampal cultures determined by Synapsin (marker for all synapses) and vGAT (inhibitory synapse marker) antibody staining. Excitatory synapses are Synapsin positive and vGAT negative. n = 3 independent experiments, 45–47 images per condition; paired t test. (O) Quantification and average traces of Synaptophysin-pHluorin-expressing neurons stimulated with 40 APs (20 Hz) to determine the size of the readily releasable SV pool (RRP). n = 3 independent experiments, 20 cells per condition; paired t test. (P) Quantification and average traces of Synaptophysin-pHluorin-expressing neurons stimulated with 600 APs (20 Hz) to determine the size of the recycling SV pool (RP). n = 3 independent experiments, 20–24 cells per condition; paired t test. (Q and R) Representative electron micrographs of nerve terminals in WT and KO hippocampal cultures show no difference in the number of SVs per bouton (quantified in R). Scale bar, 1 μm. n = 41 (WT) and 45 (KO) boutons, 1 experiment; Mann-Whitney test. All data represent mean ± SEM. p < 0.05, ∗∗p < 0.01, ∗∗∗p < 0.001.
Figure 3
Figure 3
Decreased Degradation and Accumulation of ER Proteins in ATG5-iKO Neurons (A) Immunoblots showing ATG5 decrease in cell lysates from ATG5-iKO cerebellar granule neuron (CGN) cultures compared with control culture lysates. (B) Analysis of the LC3-II/LC3-I ratio in immunoblots of CGN lysates from WT and KO cultures. n = 3; unpaired t test. (C) Schematic showing the pulsed SILAC procedure to measure protein degradation. CGN cultures were grown for 2 weeks in medium containing heavy (H) or medium (M) variants of lysine and arginine. On day 14, the medium was replaced with normal medium containing unlabeled (L) amino acids. After 0 (t = 0) or 6 (t = 6) days, cells were harvested, mixed, and analyzed by MS analysis, resulting in a list of H/M ratios for each protein. The example shows an H-labeled peptide that is degraded at slower rates than the M-labeled peptide, resulting in H/M ratios greater than 1. (D) Four separate experiments were performed, in which 1,753 proteins were identified that exhibited H/M (KO/WT) ratios in at least 3 experiments (and 2 conditions, t = 0 and t = 6). Of the 1,753 proteins, 180 are considered to be synaptic proteins. To evaluate protein degradation over the course of 6 days, ratios at t = 6 are divided by t = 0 ratios, and fold changes are plotted. Of 1,753 proteins, 73 showed a significant increase in average H/M ratios over the period of 6 days (defined as log2fold change > 0.6 and p < 0.05, dotted lines); that is, they exhibited slower degradation rates in ATG5-iKO neurons. The table shows the protein hits considered to be synaptic (the rank of hit is shown in brackets). (E) Gene Ontology analysis indicates that most of the proteins that show slower degradation rates in KO neurons (fold change > 1.5) are localized to the ER (the rank of overrepresented GO Cellular component is shown in brackets). (F) Main subcellular localization of the 73 hit proteins (UniProtGO Annotation Database). (G) Immunoblot analysis and representative examples of lysates from WT and KO CGNs in culture, using antibodies against the indicated proteins. Bars show the protein level change of the indicated proteins normalized to the housekeeping gene tubulin. The mean values for the controls are set to 1. n, indicated in bars; one-sample t test. All data represent mean ± SEM. p < 0.05, ∗∗p < 0.01, ∗∗∗p < 0.001.
Figure 4
Figure 4
Inhibition of Neuronal Autophagy Leads to Accumulation of Smooth ER Proteins and Tubules in Hippocampal Axons (A) Elevated levels of ER membranes monitored by Calnexin in lysates from hippocampal neurons in culture, similar to what is seen in lysates from CGNs (see also Figure 3G). Samples were analyzed by immunoblotting. The bar displays Calnexin protein levels normalized to tubulin as a control. Data for the WT were set to 1. n = 7 independent experiments; one-sample t test. (B) Representative confocal images of WT and ATG5-iKO hippocampal neurons immunostained for the ER marker Reticulon 3 (Rtn3), the axonal marker Tau, and the dendritic marker Map2. Yellow arrows indicate ER accumulations in KO axons. Scale bar, 5 μm. (C) Quantification of Rtn3 in WT and KO hippocampal neurons, expressed as dendritic (Map2) or axonal (Tau) area covered with Rtn3 accumulations. n = 50 images, 4 independent experiments; Mann-Whitney test. (D) Representative confocal images of control hippocampal neurons and neurons transduced with Fip200-shRNA immunostained for the ER marker Rtn3 and the axonal marker Tau. ER accumulates in Fip200 KD axons. Scale bar, 10 μm. (E) Cre-mediated ATG5 depletion in hippocampal neurons (f(syn)cre) but not in astrocytes (f(gfap)cre) leads to neuronal Rtn3 accumulation. Scale bar, 10 μm. (F) Quantification of PERK phosphorylation (p-PERK) in WT and ATG5-iKO lysates from CGNs in culture treated with thapsigargin (thaps) to induce ER stress (1 μM, 16 h) or left untreated. The P-PERK/PERK ratio observed in WT lysates was set to 1. n = 4 independent experiments; one-sample t test. See also Figures S4M and S4N for representative blots and P-JNK quantification. (G and H) 3D analysis of ER tubules in synaptic terminals. (G) Bars indicate the average ER volume in WT and ATG5-iKO boutons. n = 12 tomographic reconstructions, 12 boutons per group. (H) Single virtual sections and 3D transmission electron microscopy (TEM) tomography reconstructions of synaptic boutons showing postsynaptic densities (orange), ER tubules (blue), SVs (yellow), and mitochondria (green). Examples show a WT bouton and two ATG5-iKO boutons with medium and severe ER volume increases. Scale bar, 1 μm. All data represent mean ± SEM. p < 0.05, ∗∗∗p < 0.001.
Figure 5
Figure 5
Neuronal ER Co-traffics with Axonal Autophagosomes and Is Degraded in Lysosomes (A and B) Inhibiting autophagy by preventing vacuolar acidification in the presence of bafilomycin A1 causes Calnexin accumulation. (A) Quantification of immunoblots of WT and ATG5-iKO CGN cultures treated with bafilomycin A1 (BafA, 2 nM, 24 h). All conditions are compared with the WT; values for WT were set to 1. n = 7 (WT, WT BafA, KO) or 6 (KO BafA) independent experiments; one-sample t test. (B) Representative immunoblots of lysates from WT and ATG5-iKO CGNs in culture treated with BafA. (C–F) Axonal ER co-traffics with LC3-positive autophagosomes. (C) Kymographs showing colocalization and cotransport of DsRed-KDEL with GFP-LC3b-labeled autophagosomes in axons of WT hippocampal neurons. (D) The majority but not all of GFP-LC3b-labeled autophagosomes are positive for DsRed-KDEL. (E and F) Representative time series of colocalization and cotransport of DsRed-KDEL with GFP-LC3b-labeled autophagosomes in an axon. Shown in (E) is a representative time series of a proximal dendrite (F). Yellow arrows indicate moving DsRed-KDEL vesicles. (G) Hippocampal axons immunostained for endogenous LC3, Rtn3, and Tau. Blocking autophagy with a selective VPS34 inhibitor (1 μM, 24 h) and subsequent washout (4 h) results in axonal LC3 punctum formation positive for Rtn3 (i, example of a non-treated axon; ii, examples of VPS34 inhibitor-treated neurons after washout). (H–J) Acidification of neuronal ER in WT but not ATG5-iKO hippocampal neurons in culture. (H) Neurons transfected with EGFP-mCherry-RAMP4. EGFP is quenched as a result of low pH, causing a switch from GFP+/mCherry+ to GFP−/mCherry+ during lysosomal degradation of the ER. Yellow boxes indicate magnifications shown on the right. (I) GFP−/mCherry+ (acidified, red) RAMP4 is present in WT neurons but not in ATG5 KO neurons. Acidified ER is present again in ATG5-iKO neurons after co-expression with FLAG-ATG5. n = 6 experiments for WT and KO and n = 3 experiments for KO + FLAG-ATG5; total numbers of cells are indicated in bars. (J) ATG5 depletion does not influence acidification of mitochondria, measured by EGFP-mCherry-TOM20. n = 3 experiments; total numbers of cells are indicated in bars. See also Figure S4B. Scale bars, 5 μm. All data represent mean ± SEM. p < 0.05.
Figure 6
Figure 6
Increased RyR-Mediated Calcium Release Underlies Elevated Neurotransmission in ATG5 KO Neurons (A–E) Impaired calcium homeostasis in ATG5-iKO hippocampal neurons. (A and B) Hippocampal neuron cultures were probed with the fluorescent Ca2+-binding dye Fluo-8 to measure cytosolic calcium in neurites. Neurites were identified by a mild electrical stimulation (20 APs) causing a Fluo-8 increase. Fluorescence intensities of baseline Fluo-8 (before stimulus) are quantified in (B). Calcium levels in WT neurons were set to 1. n = 4 independent experiments, 36 images for WT and 38 images for KO; one-sample t test. (C) Hippocampal neuron cultures were transfected with ER-GCaMP6-150, and axons were imaged before and after 50 μM ionomycin application to induce indicator saturation for calibration. (D) Average peak fold change in fluorescence during ionomycin application is used to estimate resting ER calcium concentration in the axon. n = 30 axons, 3 independent experiments; unpaired t test. (E) Calcium buffering in the presynapse was measured by infecting neurons with the synaptophysin-GCaMP6 virus. The fluorescence change in response to a 50-Hz, 20-s pulse was measured. Average traces are indicated on the right, and the area under the curve (AUC) is plotted on the left. n = 5 independent experiments, 58–63 cells per condition; paired t test. (F) Hippocampal neuron culture immunostained for endogenous RyR2 and the axonal marker Tau. Scale bar, 5 μm. (G) Images of mouse brain sections showing an increase in RyR immunoreactivity in ATG5-cKO crtx and the hippocampal CA3 area. Yellow boxes indicate magnifications shown on the right. See also Figure S6A for quantifications. Scale bar, 200 μm. (H–K) Increased caffeine-induced calcium release from the ER in ATG5-iKO hippocampal neurons in culture. (H) Heatmap images showing Fluo-8 calcium responses during a 20-mM caffeine pulse. Scale bar, 10 μm. (I) Representative traces from Fluo-8 responses in the somata or axonal areas (indicated by white circles in H). (J) Maximum Fluo-8 intensity increase in WT and ATG5-iKO somata. n = 100 WT and 98 KO cells from two independent experiments; unpaired t test. (K) Average number of responding “boutons” per soma. n = 90 WT and 95 KO somata from two independent experiments; Mann-Whitney test. (L) Detection of exocytosis using Synaptophysin-pHluorin in WT and ATG5-iKO hippocampal neurons. A graph shows mean normalized peak fluorescence upon 40-mA stimulation. Dantrolene (10 μM), a RyR inhibitor, rescues increased responses in ATG5-iKO neurons. Values per cell are normalized to the corresponding maximal fluorescent peak at 100 mA (Fmax). n = 18–22 cells, 3 independent experiments; one-way ANOVA with Tukey’s post-test. (M) Ryanodine receptor (RyR) knockdown decreases exocytosis in ATG5-iKO neurons. Values per cell are normalized to the corresponding Fmax at 100 mA. n = 13 WT or 25–27 KO cells, 4 independent experiments; one-way ANOVA with Tukey’s post-test. All data represent mean ± SEM. p < 0.05, ∗∗p < 0.01, ∗∗∗p < 0.001.

Comment in

References

    1. Andres-Alonso M., Ammar M.R., Butnaru I., Gomes G.M., Acuña Sanhueza G., Raman R., Yuanxiang P., Borgmeyer M., Lopez-Rojas J., Raza S.A. SIPA1L2 controls trafficking and local signaling of TrkB-containing amphisomes at presynaptic terminals. Nat. Commun. 2019;10:5448. - PMC - PubMed
    1. Ariosa A.R., Klionsky D.J. Autophagy core machinery: overcoming spatial barriers in neurons. J. Mol. Med. (Berl.) 2016;94:1217–1227. - PMC - PubMed
    1. Ashrafi G., Schlehe J.S., LaVoie M.J., Schwarz T.L. Mitophagy of damaged mitochondria occurs locally in distal neuronal axons and requires PINK1 and Parkin. J. Cell Biol. 2014;206:655–670. - PMC - PubMed
    1. Azarnia Tehran D., Kuijpers M., Haucke V. Presynaptic endocytic factors in autophagy and neurodegeneration. Curr. Opin. Neurobiol. 2018;48:153–159. - PubMed
    1. Bago R., Malik N., Munson M.J., Prescott A.R., Davies P., Sommer E., Shpiro N., Ward R., Cross D., Ganley I.G., Alessi D.R. Characterization of VPS34-IN1, a selective inhibitor of Vps34, reveals that the phosphatidylinositol 3-phosphate-binding SGK3 protein kinase is a downstream target of class III phosphoinositide 3-kinase. Biochem. J. 2014;463:413–427. - PMC - PubMed

Publication types

LinkOut - more resources