. 2021 Jan 11;31(1):228-237.e10.
doi: 10.1016/j.cub.2020.10.011. Epub 2020 Nov 5.

Auxin-Regulated Reversible Inhibition of TMK1 Signaling by MAKR2 Modulates the Dynamics of Root Gravitropism

Affiliations

Auxin-Regulated Reversible Inhibition of TMK1 Signaling by MAKR2 Modulates the Dynamics of Root Gravitropism

Maria Mar Marquès-Bueno et al. Curr Biol. .

Abstract

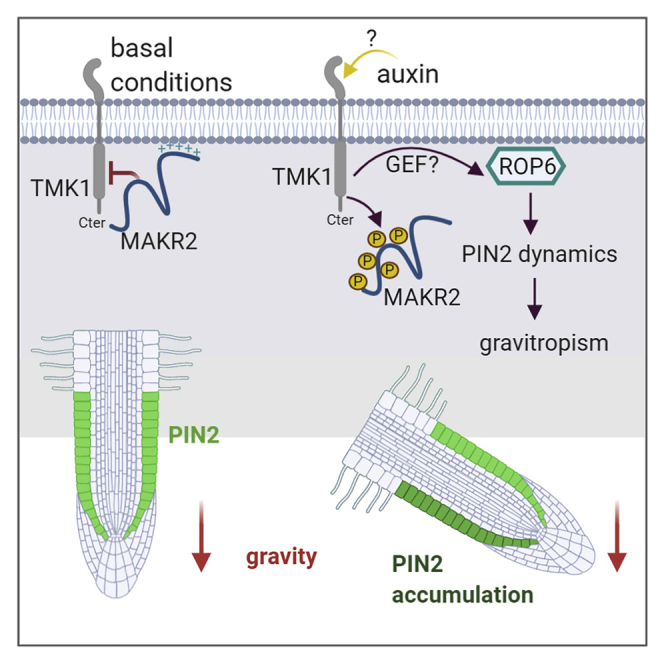
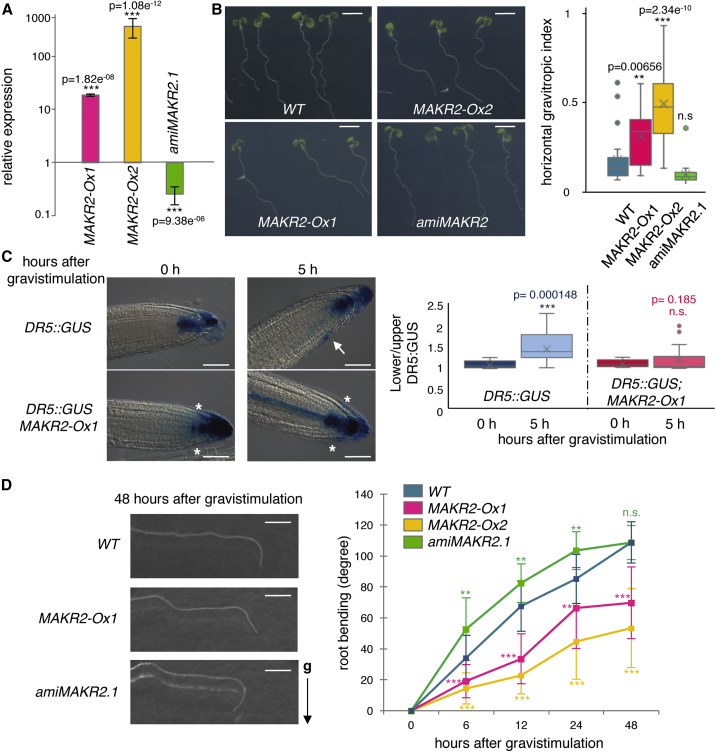
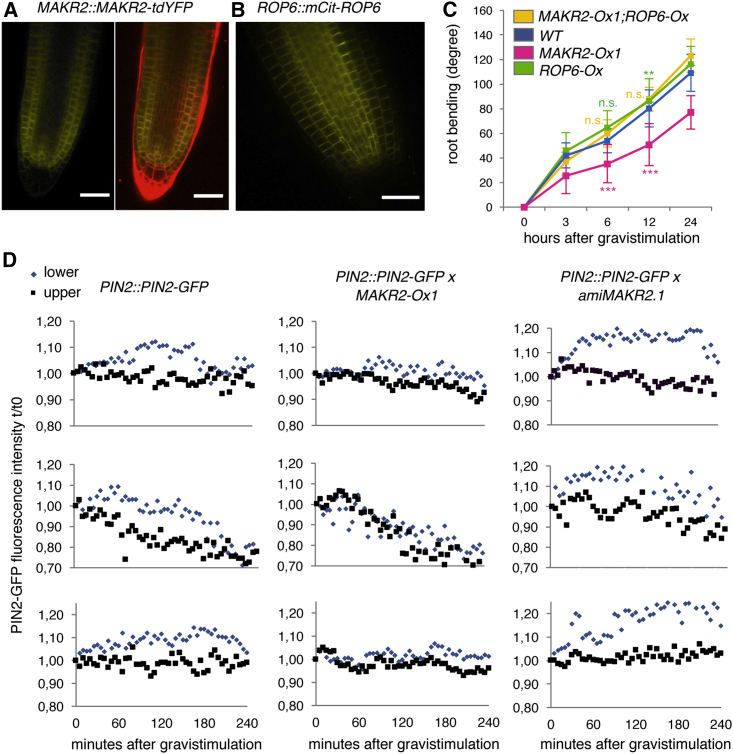
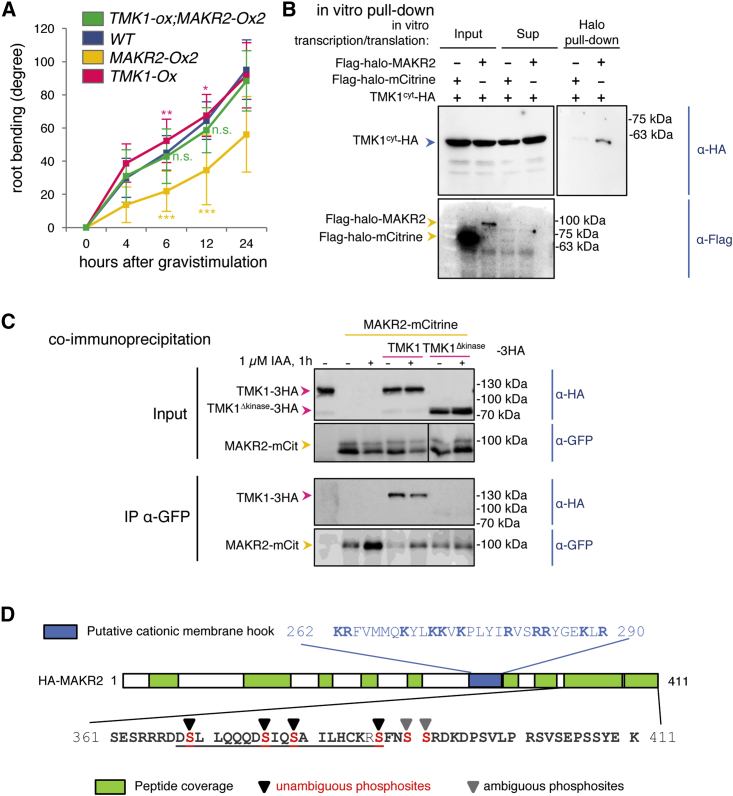
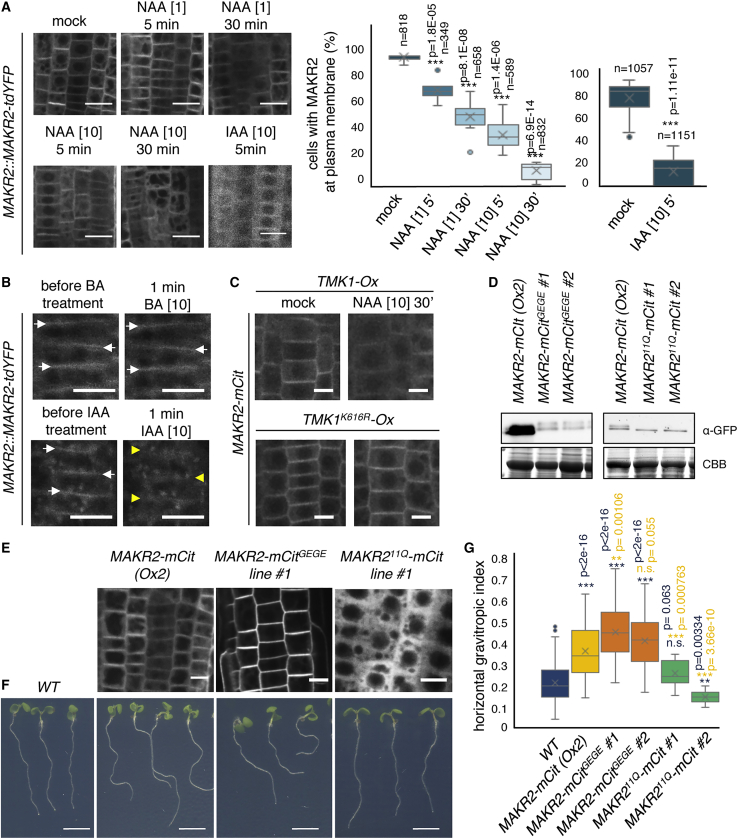
Plants are able to orient their growth according to gravity, which ultimately controls both shoot and root architecture.1 Gravitropism is a dynamic process whereby gravistimulation induces the asymmetric distribution of the plant hormone auxin, leading to asymmetric growth, organ bending, and subsequent reset of auxin distribution back to the original pre-gravistimulation situation.1-3 Differential auxin accumulation during the gravitropic response depends on the activity of polarly localized PIN-FORMED (PIN) auxin-efflux carriers.1-4 In particular, the timing of this dynamic response is regulated by PIN2,5,6 but the underlying molecular mechanisms are poorly understood. Here, we show that MEMBRANE ASSOCIATED KINASE REGULATOR2 (MAKR2) controls the pace of the root gravitropic response. We found that MAKR2 is required for the PIN2 asymmetry during gravitropism by acting as a negative regulator of the cell-surface signaling mediated by the receptor-like kinase TRANSMEMBRANE KINASE1 (TMK1).2,7-10 Furthermore, we show that the MAKR2 inhibitory effect on TMK1 signaling is antagonized by auxin itself, which triggers rapid MAKR2 membrane dissociation in a TMK1-dependent manner. Our findings suggest that the timing of the root gravitropic response is orchestrated by the reversible inhibition of the TMK1 signaling pathway at the cell surface.

Keywords: MAKR; ROP6; TMK; anionic lipids; auxin; brassinosteroid; gravitropism; receptor-like kinase; root.


Conflict of interest statement

Declaration of Interests The authors declare no competing interests.

Figures

None
Graphical abstract
Figure 1
Figure 1
MAKR2 Regulates the Pace of the Root Gravitropic Response (A) qRT-PCR analyses of MAKR2 expression in 2x35Sprom::MAKR2-2xmCherry (MAKR2-Ox1), 2x35Sprom::MAKR2-mCitrine (MAKR2-Ox2), and amiMAKR2.1 lines relative to MAKR2 expression in wild-type seedlings (mean ± SEM). (B) Pictures showing the root phenotypes of the genotypes indicated at the bottom and related quantification of the horizontal growth index (Tukey boxplot). Plants were grown at a 45° angle with respect to the vertical axis. Scale bars represent 5 mm. (C) DR5prom::GUS accumulation pattern in the absence and after 5 h of gravistimulation at a 135° angle in wild-type and MAKR2-Ox1 plants and related quantification (Tukey boxplot). The white asterisks indicate the arrow-like pattern observed in MAKR2-Ox1 lines; the white arrow indicates the asymmetric GUS signal observed after gravistimulation in the wild type. Scale bars represent 50 μm. (D) Representative pictures of the root gravitropic curvature 48 h after reorienting seedlings at a 135° angle and related quantification of root gravitropic bending over time (mean ± SEM). Scale bars represent 2 mm. See Figure S1F for a statistical comparison. For the horizontal gravitropic index and the kinetics of the gravitropic response, a linear model was fitted on measurements from wild-type plants and the different mutants using lm() function from stats package available in R software (https://www.r-project.org/). This model estimates a weight for each variable (wild-type and mutant plants) and the associated probability that such weight is different from zero based on a t test. The probability derived from the t test is the p value in this comparison and significant differences were considered when p < 0.05. See also Figure S1.
Figure 2
Figure 2
MAKR2 Mediates PIN2-GFP Dynamic Accumulation during Gravitropism (A) Confocal pictures of the MAKR2prom::MAKR2-tdYFP line showing the MAKR2-tdYFP localization and expression pattern at the root tip. Left: yellow fluorescent protein (YFP) channel; right: overlay between YFP channel (yellow) and membranes counterstained by FM4-64 (red). (B) Confocal pictures of the complemented ROP6prom::mCitrine-ROP6/rop6-2 line showing the mCit-ROP6 localization and expression pattern at the root tip. (C) Kinetics of root gravitropic bending after reorienting seedlings at a 135° angle. See Figure S1F for a statistical comparison. A linear model was fitted on measurements from wild-type plants and the different mutants using lm() function from stats package available in R software (https://www.r-project.org/). This model estimates a weight for each variable (wild-type and mutant plants) and the associated probability that such weight is different from zero based on a t test. The probability derived from the t test is the p value in this comparison and significant differences were considered when p < 0.05. (D) Quantification of PIN2-GFP in the upper (blue diamonds) and lower (black squares) part of the root in the PIN2prom::PIN2-GFP, PIN2prom::PIN2-GFP;MAKR2-Ox1, and PIN2prom::PIN2-GFP;amiMAKR2.1 lines. Each graph shows the response in a single individual root (see also Videos S1 and S2). In each case, fluorescence intensities were normalized with respect to the initial fluorescence value (time 0 min). Scale bars represent 30 μm. See also Figures S1 and S2 and Videos S1 and S2.
Figure 3
Figure 3
TMK1 Interacts with and Phosphorylates MAKR2 and Acts Upstream of MAKR2 in the Regulation of Root Gravitropism (A) Kinetics of root gravitropic bending after reorienting seedlings of the genotypes indicated in the top left corner at a 135° angle. See Figure S3C for a statistical comparison. A linear model was fitted on measurements from wild-type plants and the different mutants using lm() function from stats package available in R software (https://www.r-project.org/). This model estimates a weight for each variable (wild-type and mutant plants) and the associated probability that such weight is different from zero based on a t test. The probability derived from the t test is the p value in this comparison and significant differences were considered when p < 0.05. (B) Pull-down assay using in-vitro-transcribed/translated proteins and Halo-tag purification. Co-purified proteins were visualized using an anti-HA antibody (labeled Halo pull-down). The inputs (labeled Inputs) and supernatant (labeled Sup) were tested to show the relative amounts of Halo- and HA-tagged proteins and the binding efficiency to HaloLink magnetic beads (as described in Yazaki et al.34). TMK1cyt corresponds to the isolated TMK1 cytoplasmic domain. (C) Co-immunoprecipitation of full-length TMK1-3HA but not TMK1Δkinase-3HA with MAKR2-mCitrine. Immunoprecipitation (IP) of MAKR2-mCitrine with an anti-GFP antibody and immunoblotting (IB) using an anti-GFP antibody or anti-HA antibody. Protoplasts were incubated or not for 1 h with 1 μM IAA. (D) The scheme represents the MAKR2 protein, with the peptides recovered by mass spectrometry highlighted in green and the phosphorylation sites shown by arrowheads (only found with active TMK1cyt but not inactive TMK1cyt-K616R). Black arrowheads indicate phosphorylation sites that could be determined with 100% accuracy, whereas gray arrowheads indicate ambiguity on which of the two consecutive serines is phosphorylated. The residues corresponding to the conserved C-terminal tail are underlined. The blue box indicates the position of the putative cationic membrane hook, and the corresponding Arg/Lys residues are highlighted in bold. See also Figure S3.
Figure 4
Figure 4
Auxin Triggers MAKR2 Plasma Membrane Dissociation in a TMK1-Dependent Manner to Antagonize MAKR2 Inhibitory Activity (A) Confocal pictures of the MAKR2prom::MAKR2-tdYFP line following NAA or IAA treatment for the time and concentration indicated in each panel and related quantification. n indicates the number of cells counted. A pairwise comparison between mock plants and plants subjected to different treatments was performed using a t test with Welch's correction to account for unequal variances using R software (https://www.r-project.org/). The probability derived from the t test is the p value in this comparison and significant differences were considered when p < 0.01. (B) Successive confocal pictures of the MAKR2prom::MAKR2-tdYFP line before and after 1 min of benzoic acid (BA; control) or IAA treatment (Video S3). White arrows indicate MAKR2 plasma membrane localization, whereas the yellow arrowheads show MAKR2 disappearance from the plasma membrane upon IAA but not BA treatment. (C) Confocal pictures showing MAKR2-mCit localization (MAKR2-Ox2) in UBQ10prom::TMK1-2xmCherry (TMK1-Ox) and UBQ10prom::TMK1K616R-2xmCherry (TMK1K616R-Ox, kinase dead) in the absence or presence of NAA at the indicated time and concentration. (D) Anti-GFP western blots showing the relative accumulation of MAKR2-mCit (in the MAKR2-Ox2 line) and two independent transgenic lines overexpressing MAKR2-mCitGEGE and MAKR211Q-mCit. CBB, Coomassie brilliant blue. (E) Confocal pictures comparing the localization of 2x35Sprom::MAKR2-mCit (MAKR2-Ox2), 2x35Sprom::MAKR2-mCitGEGE (MAKR2-mCitGEGE, constitutively tethered to the plasma membrane), and 2x35Sprom::MAKR211Q-mCit (MAKR211Q-mCit, constitutively cytoplasmic). (F and G) Pictures showing the root phenotypes of the genotypes indicated at the top (F) and related quantification of the horizontal gravitropic index (G). Statistical comparison with the wild type (WT) is in blue and with MAKR2-Ox2 is in yellow. In (G), a linear model was fitted on measurements from wild-type plants and the different mutants using lm() function from stats package available in R software (https://www.r-project.org/). This model estimates a weight for each variable (wild-type and mutant plants) and the associated probability that such weight is different from zero based on a t test. The probability derived from the t test is the p value in this comparison and significant differences were considered when p < 0.05. Scale bars represent 20 μm (A), 10 μm (B, C, and E), and 5 mm (F). See also Figures S4 and S5 and Video S3.

References

    1. Su S.H., Gibbs N.M., Jancewicz A.L., Masson P.H. Molecular mechanisms of root gravitropism. Curr. Biol. 2017;27:R964–R972. - PubMed
    1. Armengot L., Marquès-Bueno M.M., Jaillais Y. Regulation of polar auxin transport by protein and lipid kinases. J. Exp. Bot. 2016;67:4015–4037. - PMC - PubMed
    1. Rakusová H., Fendrych M., Friml J. Intracellular trafficking and PIN-mediated cell polarity during tropic responses in plants. Curr. Opin. Plant Biol. 2015;23:116–123. - PubMed
    1. Adamowski M., Friml J. PIN-dependent auxin transport: action, regulation, and evolution. Plant Cell. 2015;27:20–32. - PMC - PubMed
    1. Zhang Y., Xiao G., Wang X., Zhang X., Friml J. Evolution of fast root gravitropism in seed plants. Nat. Commun. 2019;10:3480. - PMC - PubMed

Publication types

MeSH terms