. 2021 Jan 21;28(1):34-45.e6.
doi: 10.1016/j.chembiol.2020.10.007. Epub 2020 Nov 5.

A Small Molecule that Binds an RNA Repeat Expansion Stimulates Its Decay via the Exosome Complex

Affiliations

A Small Molecule that Binds an RNA Repeat Expansion Stimulates Its Decay via the Exosome Complex

Alicia J Angelbello et al. Cell Chem Biol. .

Abstract

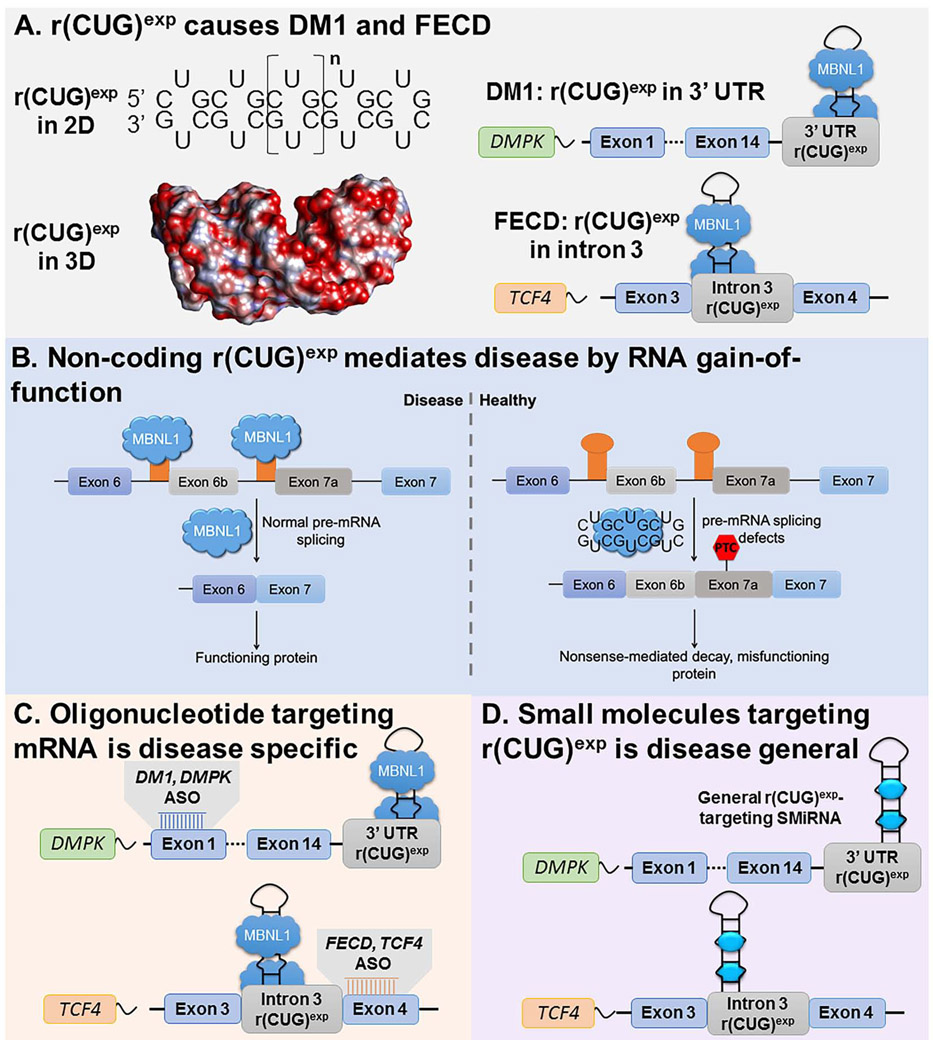
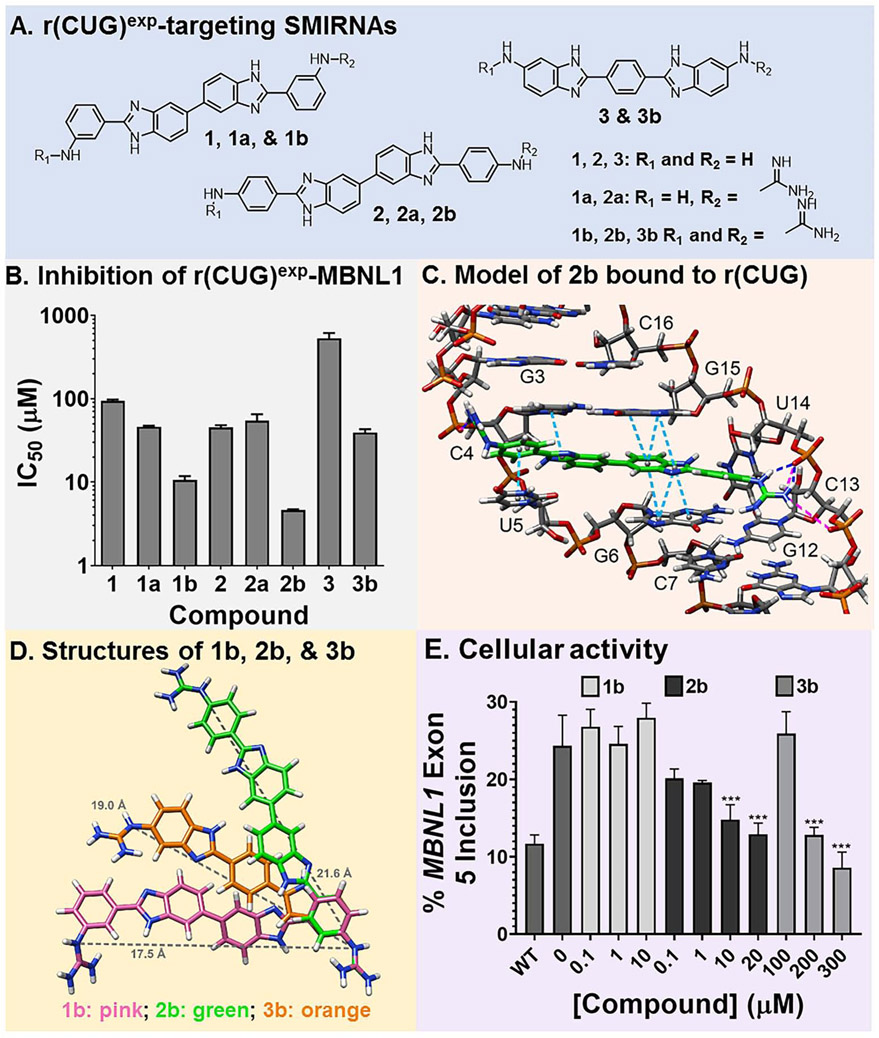
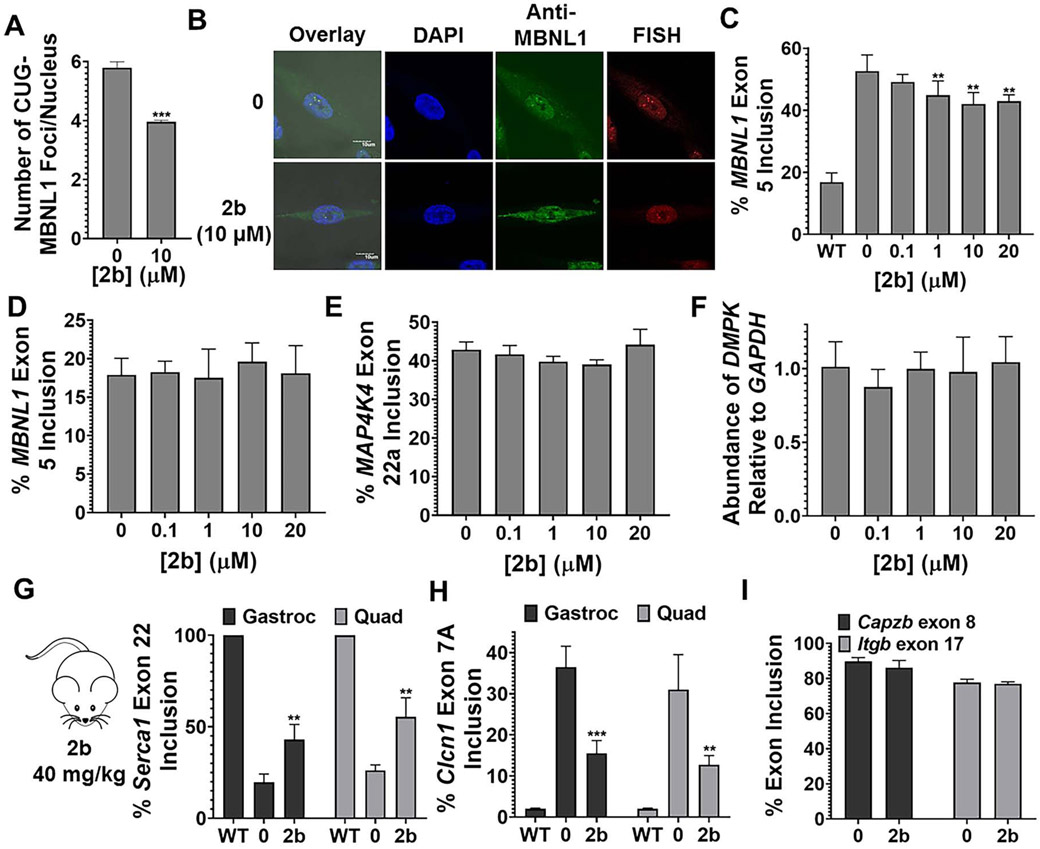
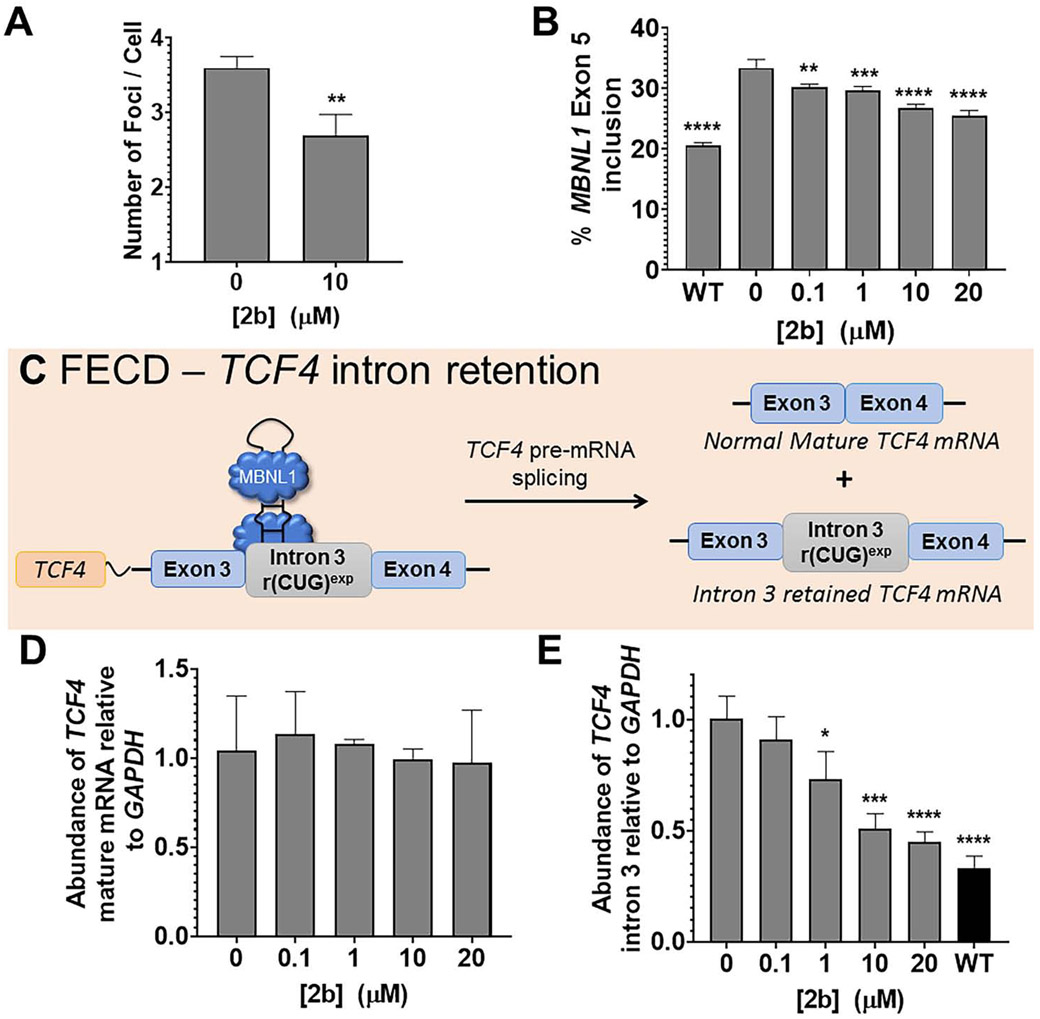
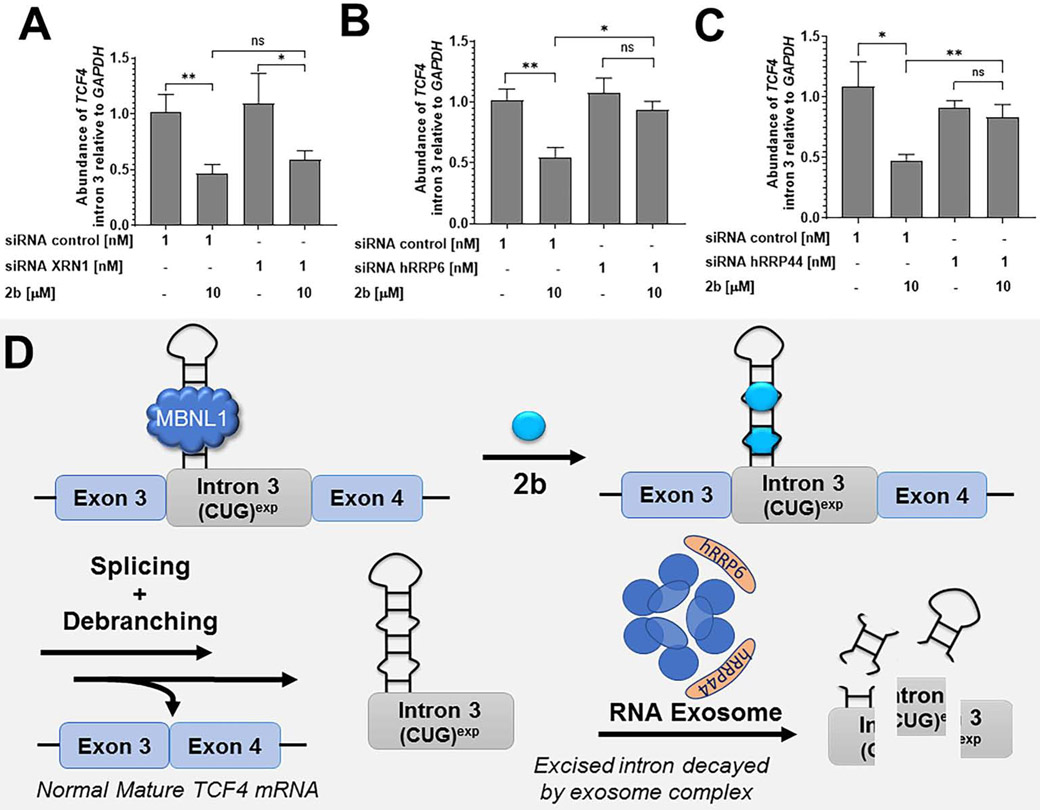
Many diseases are caused by toxic RNA repeats. Herein, we designed a lead small molecule that binds the structure of the r(CUG) repeat expansion [r(CUG)exp] that causes myotonic dystrophy type 1 (DM1) and Fuchs endothelial corneal dystrophy (FECD) and rescues disease biology in patient-derived cells and in vivo. Interestingly, the compound's downstream effects are different in the two diseases, owing to the location of the repeat expansion. In DM1, r(CUG)exp is harbored in the 3' untranslated region, and the compound has no effect on the mRNA's abundance. In FECD, however, r(CUG)exp is located in an intron, and the small molecule facilitates excision of the intron, which is then degraded by the RNA exosome complex. Thus, structure-specific, RNA-targeting small molecules can act disease specifically to affect biology, either by disabling the gain-of-function mechanism (DM1) or by stimulating quality control pathways to rid a disease-affected cell of a toxic RNA (FECD).

Keywords: RNA; RNA splicing; chemical biology; decay pathways; drug discovery; microsatellite disorders; targeted degradation.


Conflict of interest statement

Declaration of Interests M.D.D. is a founder of Expansion Therapeutics, and S.G.R. and A.J.A. are currently employees of Expansion Therapeutics. M.D.D. and S.G.R. also have a patent related to this work (US20190152924A1).

Figures

Fig. 1.
Fig. 1.
Mechanisms by which r(CUG)exp causes DM1 and FECD and approaches to target the disease-causing RNAs with small molecules. (A) DM1 and FECD are caused by r(CUG)exp found in the 3’ UTR of DMPK mRNA or in intron 3 of TCF4 mRNA, respectively. The repeat expansion forms a structure containing repeating 1×1 UU internal loops that sequesters regulatory proteins such as MBNL1. (B) r(CUG)exp causes disease via RNA gain-of-function in which it sequesters MBNL1 in nuclear foci, resulting in pre-mRNA splicing defects in genes that are regulated by MBNL1; the muscle specific chloride ion channel pre-mRNA (CLCN1) is shown as an example. (C) Using antisense oligonucleotides (ASOs) to target disease-causing RNAs requires customization for each transcript. (D) Developing small molecules that bind r(CUG)exp structure offers a general way to target multiple diseases with the same compound.
Fig. 2.
Fig. 2.
Design of compounds that bind r(CUG)exp. (A) Structures of small molecules interacting with RNA (SMIRNAs) that target r(CUG)exp. (B) Studying compounds in vitro by using a previously reported TR-FRET assay to identify compounds that inhibit the r(CUG)exp-MBNL1 complex. (C) 3D model of interactions of 2b with the loops formed by r(CUG)exp. Pink lines are ionic interactions, dark blue lines are hydrogen bonding interactions, and light blue lines are stacking interactions. (D) Structures of 1b (pink), 2b (green), and 3b (orange) used to calculate the distance between guanidine substituents (gray line). (E) Quantification of MBNL1 exon 5 inclusion DM1 fibroblasts by 1b, 2b, and 3b (n = 3). **, P < 0.01; ***, P < 0.001, as determined by a one-way ANOVA by comparison to untreated cells. Data are represented as mean ± SD. See also Figures S1 and S2.
Fig. 3.
Fig. 3.
Compound 2b alleviates molecular defects in DM1 myotubes and in a DM1 mouse model. (A) Representative images of r(CUG)exp-MBNL1 foci in DM1 myotubes, imaged by MBNL1 immunostaining and RNA fluorescence in situ hybridization (FISH). (B) Quantification of the number of r(CUG)exp-MBNL1 foci/nucleus in DM1 myotubes (n = 3; 40 nuclei counted/replicate). *** P < 0.001, as determined by a two-tailed Student t-test by comparison to untreated cells. (C) Ability of 2b to improve MBNL1 exon 5 splicing in DM1 myotubes (n = 3). * P < 0.05, ** P < 0.01, *** P < 0.001, as determined by one-way ANOVA by comparison to untreated cells. (D) Evaluation of MBNL1 exon 5 splicing in wild-type myotubes (n = 3). (E) Evaluation of MAP4K4 exon 22a splicing in DM1 myotubes (n = 3). (F) Evaluation of DMPK levels in DM1 myotubes treated with 2b, as determined by RT-qPCR with gene-specific primers (n = 3). (G) Quantification of Serca 1 exon 22 splicing in HSALR mice treated with 2b. (H) Quantification of Clcn1 exon 7a splicing in HSALR mice treated with 2b. “Gastroc” indicates gastrocnemius and “Quad” indicates quadriceps (n = 4 mice/group). **, P < 0.01; *** P < 0.001, as determined by a two-tailed Student t-test relative to vehicle treated (0). (H) Evaluation of Capzb exon 8 and Itgb exon 17 splicing (non-MBNL1 regulated events) in HSALR mice treated with 2b (n = 4 mice/group). Data are represented as mean ± SD. See also Figure S3 and S4.
Fig. 4.
Fig. 4.
Compounds designed to target r(CUG)exp engage the target in DM1 fibroblasts, as determined by C-Chem-CLIP. (A) Chem-CLIP target engagement in cells using Chem-CLIP probe 2H-K4NMeS-CA-Biotin, which selectively cross-links and enriches r(CUG)exp-containing DMPK transcripts in DM1 fibroblasts. The probe does not enrich DMPK in wild-type fibroblasts. (n = 3 for both DM1 and WT fibroblasts). Data for WT fibroblasts was previously collected in Rzuczek et al. (Rzuczek et al., 2017). **, P < 0.01, as determined by a two-tailed Student t-test. (B) Competitive Chem-CLIP (C-Chem-CLIP) to study target engagement by 2b and 3b. DM1 fibroblasts were co-treated with 100 nM of 2H-K4NMeS-CA-Biotin and varying concentrations of 2b or 3b to calculate the IC50s, or relative target occupancy in cells (n = 3). For 2b the IC50 is 38±9 nM, and for 3b the IC50 is 3400±60 nM. Data are represented as mean ± SD. See also Figure S3.
Fig. 5.
Fig. 5.
Compound 2b alleviates molecular defects in FECD cells. (A) Quantification of the number of r(CUG)exp-MBNL1 foci/nucleus (n = 3, 40 nuclei counted/replicate). (B) Quantification of the effect of 2b on MBNL1 exon 5 pre-mRNA splicing (n = 3). Statistical significance was computed by comparison to untreated cells (“0”). (C) Schematic of retention of TCF4 intron 3 in FECD-affected cells. (D) Quantification of the effect of 2b on TCF4 mature mRNA, as determined by RT-qPCR (n = 3). (E) Quantification of the effect of 2b on intron 3-containing TCF4 levels in FECD cells, compared to WT levels, as determined by RT-qPCR (n = 3). Data are represented as mean ± SD. *, P < 0.05; **, P < 0.01; ***, P < 0.001; ****, P < 0.0001, as determined by a two-tailed Student t-test (panel A) or a one-way ANOVA (panels B, D, and E). See also Figure S5.
Fig. 6.
Fig. 6.
Mechanism of r(CUG)exp-containing intron 3 decay in FECD cells. (A) Effect of the siRNA targeting XRN1 in combination with 2b on TCF4 intron 3 levels, as determined by RT-qPCR. Knock-down of XRN1 had no effect on TCF4 intron 3 decay induced by 2b (n = 3). (B) Effect of the siRNA targeting hRRP6 in combination with 2b on TCF4 intron 3 levels, as determined by RT-qPCR (n = 3). Knock-down of hRRP6, a catalytic domain of the exosome complex, decreased TCF4 intron 3 decay generated by 2b. (C) Effect of the siRNA targeting hRRP44 in combination with 2b on TCF4 intron 3 levels, as determined by RT-qPCR (n = 3). Knock-down of hRRP44, a second catalytic domain of the exosome complex, decreased TCF4 intron 3 decay generated by 2b. (D) Proposed decay mechanism, where the exosome complex plays a key role in the decay pathway. Exosome nucleolytic domains are represented in orange including the hRRP6 and hRRP44 subunits. Data are represented as mean ± SD. *P, < 0.05; **P, < 0.01, as determined by a two-tailed Student t-test. See also Figure S6.

Comment in

References

    1. Angelbello AJ, Rzuczek SG, Mckee KK, Chen JL, Olafson H, Cameron MD, Moss WN, Wang ET, and Disney MD (2019). Precise small-molecule cleavage of an r(CUG) repeat expansion in a myotonic dystrophy mouse model. Proc. Natl. Acad. Sci. U. S. A 116, 7799–7804. - PMC - PubMed
    1. Arandel L, Polay Espinoza M, Matloka M, Bazinet A, De Dea Diniz D, Naouar N, Rau F, Jollet A, Edom-Vovard F, Mamchaoui K, et al. (2017). Immortalized human myotonic dystrophy muscle cell lines to assess therapeutic compounds. Dis. Models Mech 10, 487–497. - PMC - PubMed
    1. Benhamou RI, Angelbello AJ, Wang ET, and Disney MD (2020). A toxic RNA catalyzes the cellular synthesis of Its own inhibitor, shunting it to endogenous decay pathways. Cell Chem. Biol 27, 223–231.e24. - PMC - PubMed
    1. Berman HM, Westbrook J, Feng Z, Gilliland G, Bhat TN, Weissig H, Shindyalov IN, and Bourne PE (2000). The Protein Data Bank. Nucleic Acids Res. 28, 235–242. - PMC - PubMed
    1. Brook JD, McCurrach ME, Harley HG, Buckler AJ, Church D, Aburatani H, Hunter K, Stanton VP, Thirion J-P, Hudson T, et al. (1992). Molecular basis of myotonic dystrophy: Expansion of a trinucleotide (CTG) repeat at the 3′ end of a transcript encoding a protein kinase family member. Cell 68, 799–808. - PubMed

Publication types

MeSH terms

Substances