. 2020 Dec 10;183(6):1520-1535.e14.
doi: 10.1016/j.cell.2020.10.039. Epub 2020 Oct 27.

β-Coronaviruses Use Lysosomes for Egress Instead of the Biosynthetic Secretory Pathway

Affiliations

β-Coronaviruses Use Lysosomes for Egress Instead of the Biosynthetic Secretory Pathway

Sourish Ghosh et al. Cell. .

Abstract

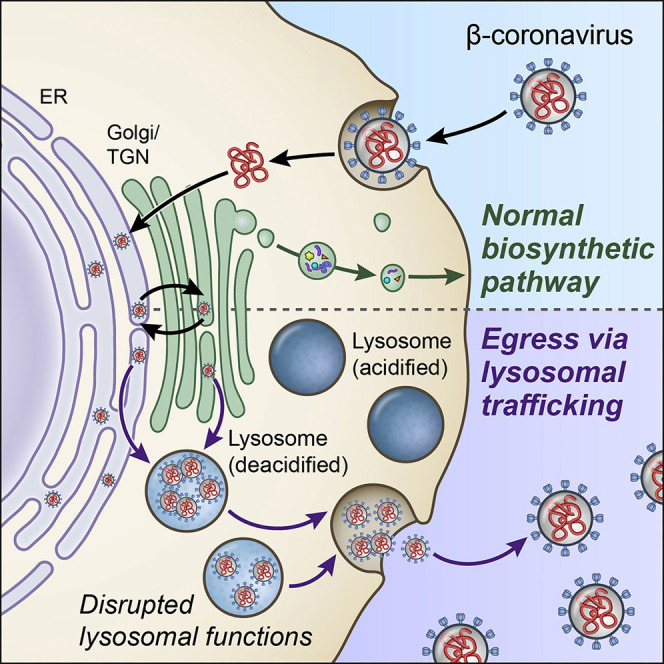
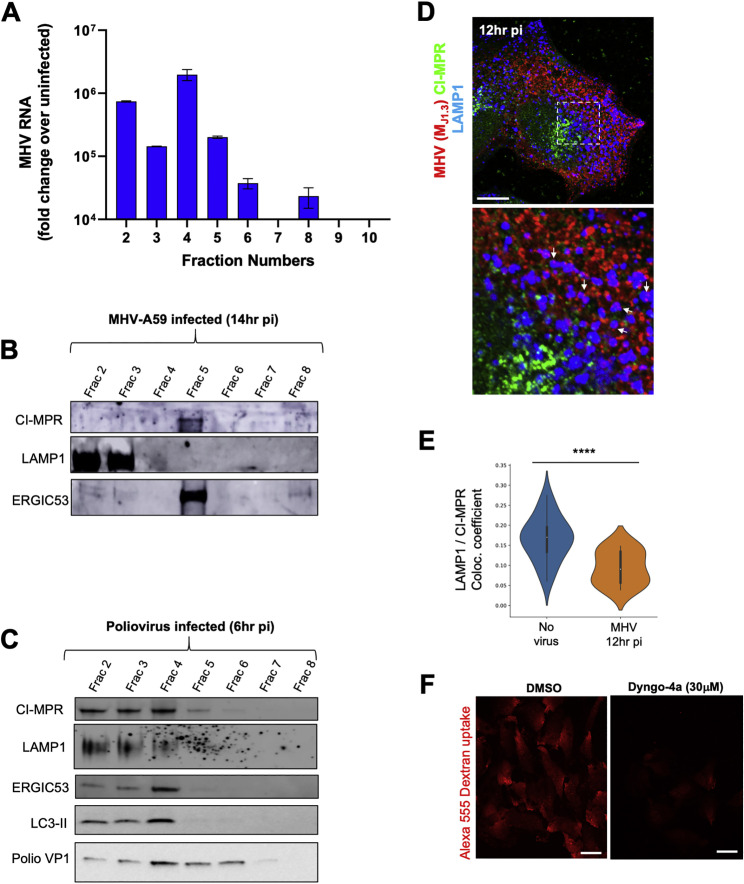
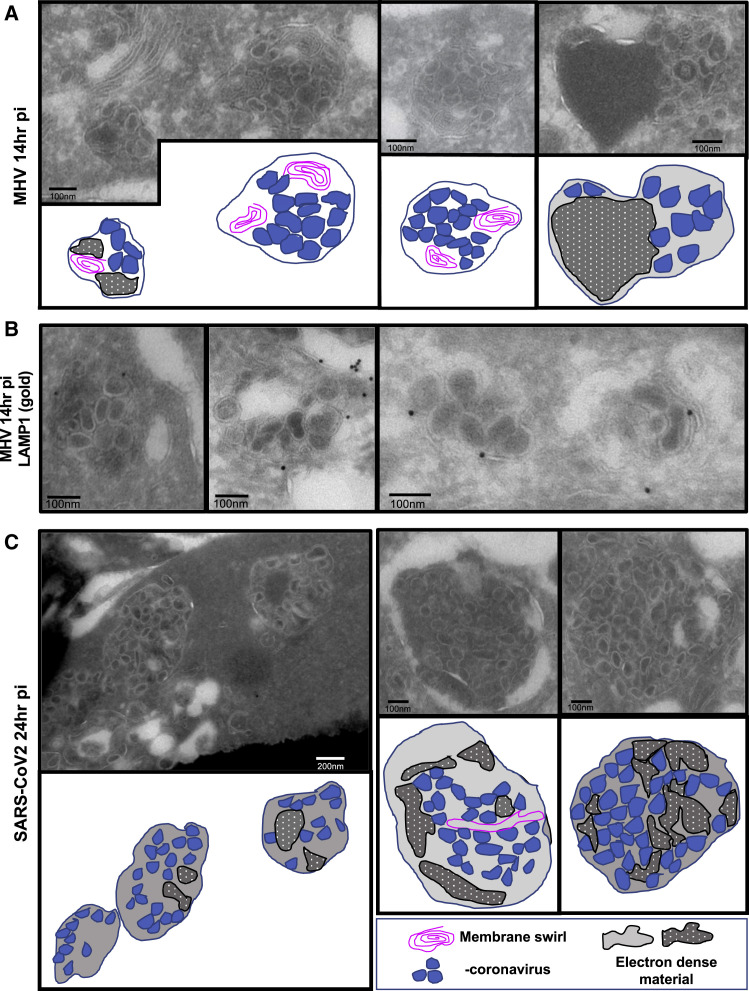
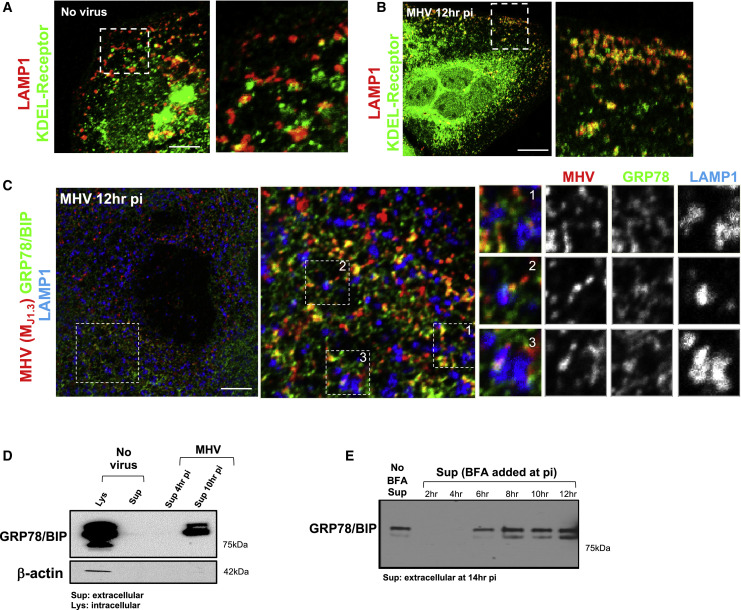
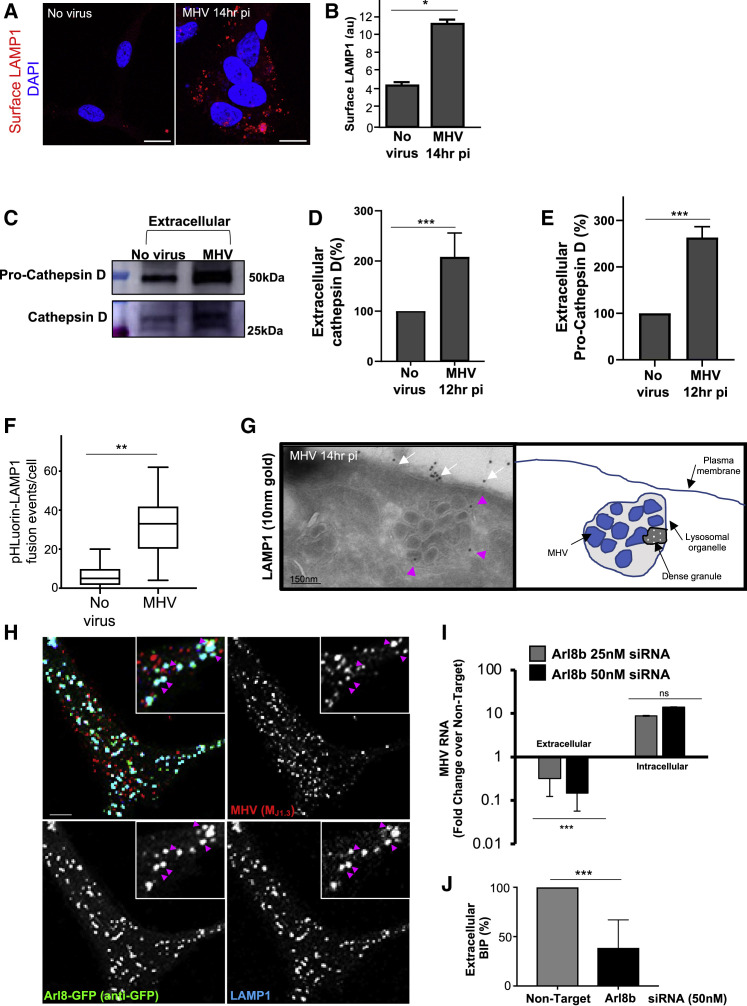
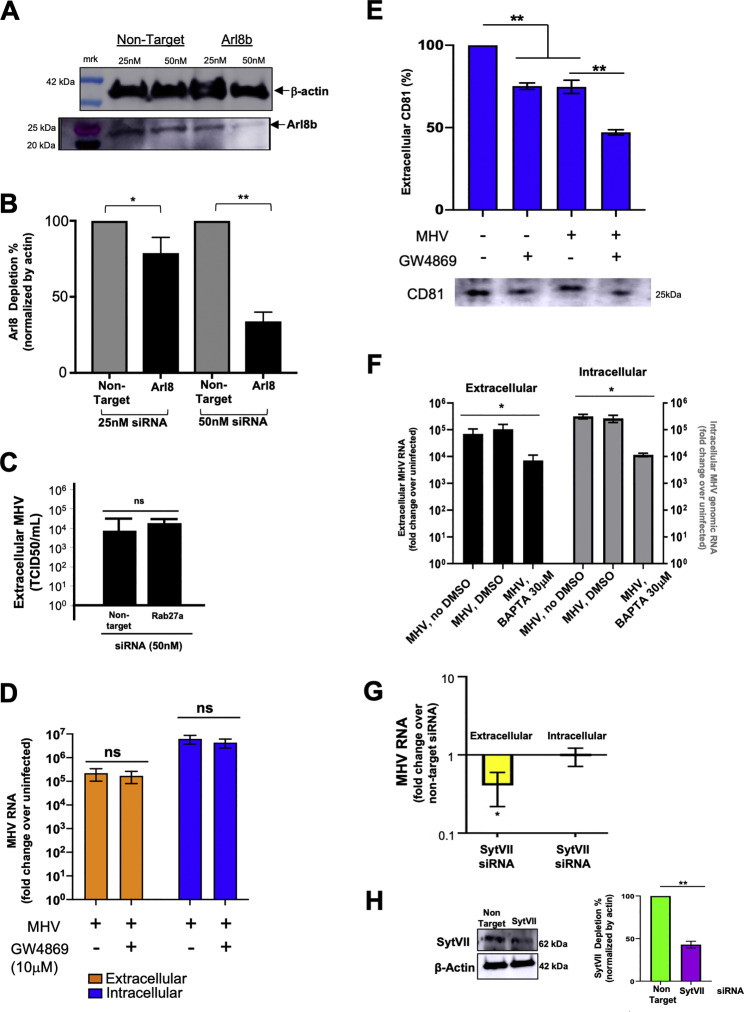
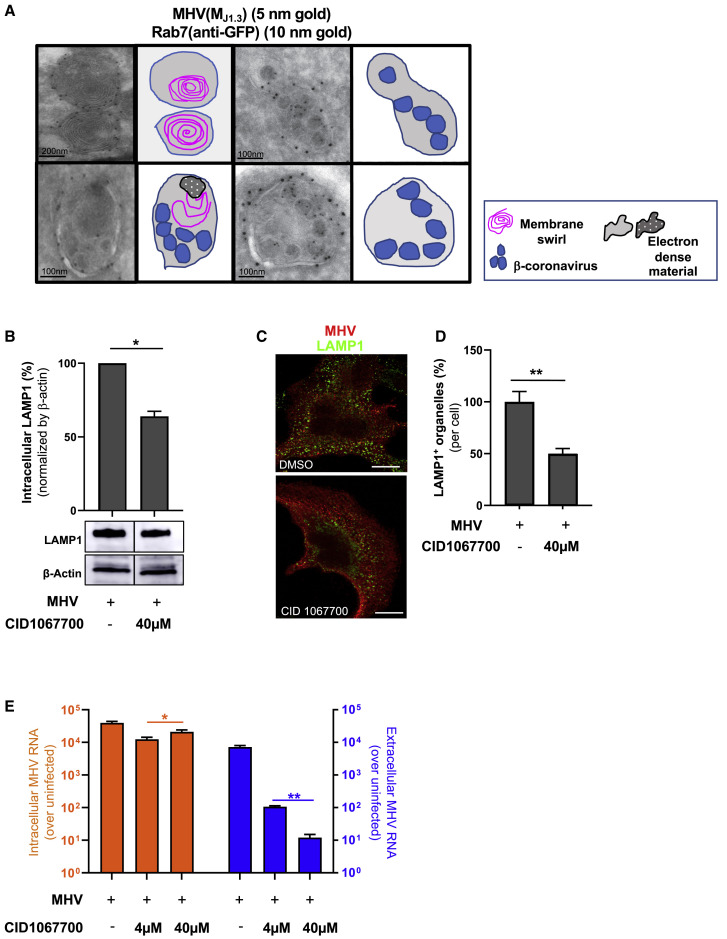
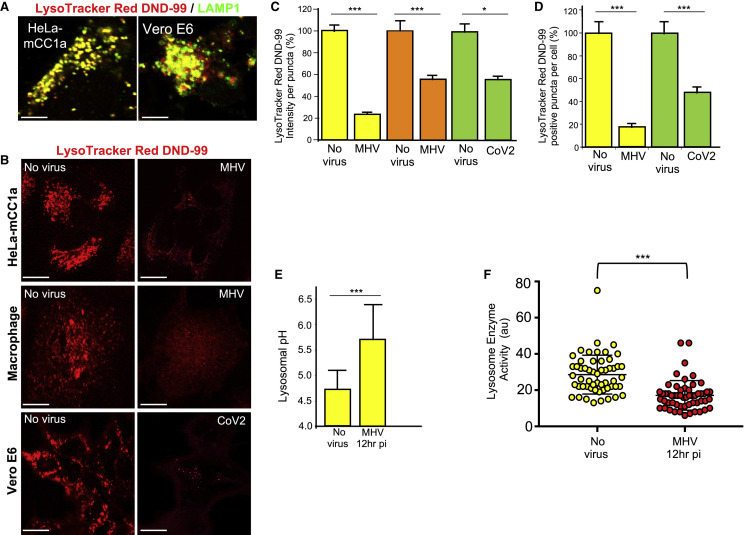
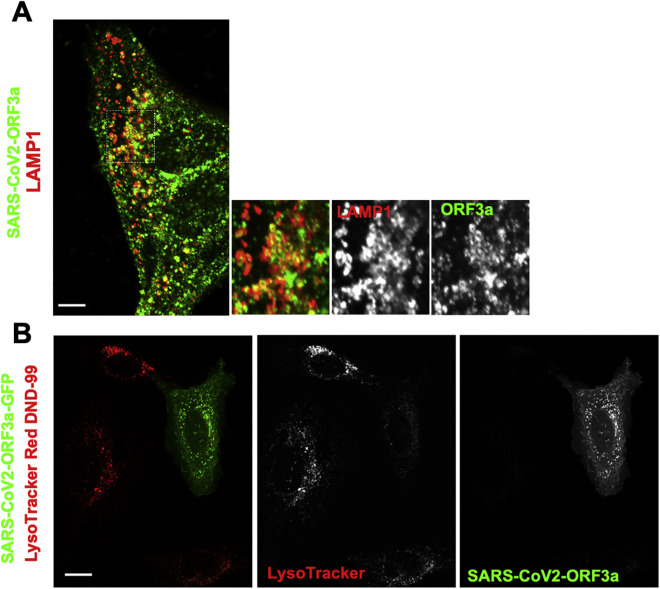
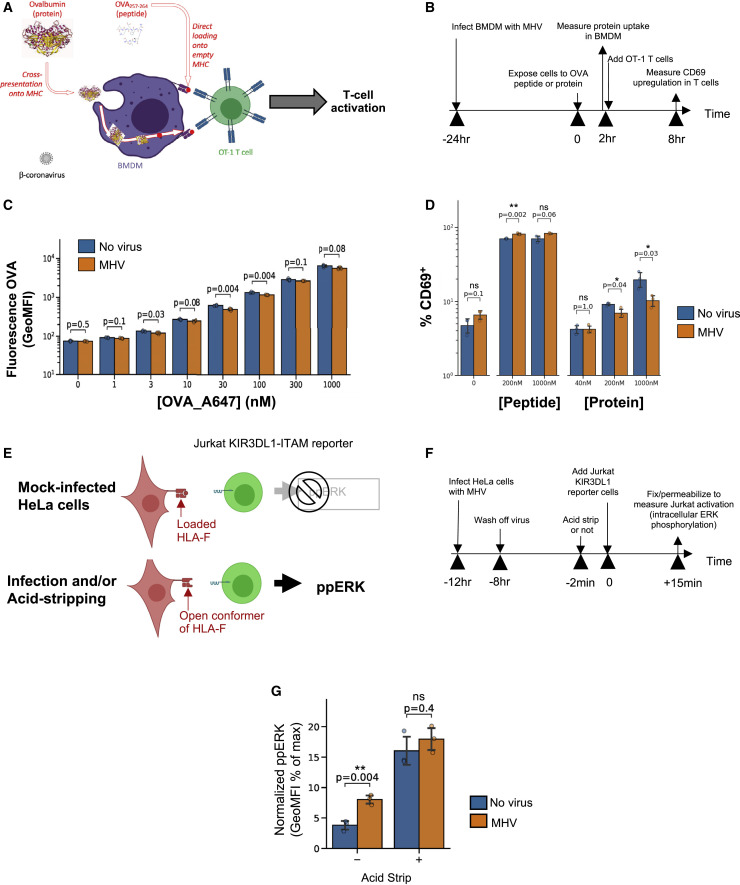
β-Coronaviruses are a family of positive-strand enveloped RNA viruses that includes the severe acute respiratory syndrome coronavirus 2 (SARS-CoV-2). Much is known regarding their cellular entry and replication pathways, but their mode of egress remains uncertain. Using imaging methodologies and virus-specific reporters, we demonstrate that β-coronaviruses utilize lysosomal trafficking for egress rather than the biosynthetic secretory pathway more commonly used by other enveloped viruses. This unconventional egress is regulated by the Arf-like small GTPase Arl8b and can be blocked by the Rab7 GTPase competitive inhibitor CID1067700. Such non-lytic release of β-coronaviruses results in lysosome deacidification, inactivation of lysosomal degradation enzymes, and disruption of antigen presentation pathways. β-Coronavirus-induced exploitation of lysosomal organelles for egress provides insights into the cellular and immunological abnormalities observed in patients and suggests new therapeutic modalities.

Keywords: CD1067700; Rab7; SARS-CoV-2; acidification/deacidification ARL8b; antigen presentation; coronavirus; lysosome; pH; viral egress; viral immunology.


Conflict of interest statement

Declaration of Interests The authors declare no competing interests.

Figures

None
Graphical abstract
Figure 1
Figure 1
β-Coronaviruses Egress Independent of the Biosynthetic Secretory Pathway and Are Enriched in Late Endosomes/Lysosomes (A) Kinetics of MHV replication and release. Viral genomic RNA was quantified in cell lysates and extracellular medium. Experiments were done in triplicates. (B) Plasma membrane permeability in MHV-infected cells, measured by trypan blue exclusion along with virus release. Experiments were done in triplicates. (C) Cargo transport kinetics through the biosynthetic secretory pathway in the absence and presence of MHV infection. Experiments were done in triplicates. (D) Effect of Brefeldin A (BFA) (5 μg/mL) treatment on MHV egress and Gaussia luciferase secretion. Cells were treated with BFA for 4, 6, or 8 h prior to collection of extracellular medium at 14 h pi. Experiments were done in triplicates. (E) MHV-infected cells treated with BFA (8–14 h pi) or left untreated and coimmunostained with anti-Golgi apparatus (mannosidase II, green) and anti-MHV (MJ1.3, red) antibodies. Scale bar, 10 μm. (F) Immunoelectron micrograph of MHV-infected cells coimmunostained with anti-MHV (MJ1.3) primary and 10-nm gold-coupled secondary antibodies. The scale bar is indicated on the micrograph. (G) MHV-infected cells coimmunostained with anti-E (green) and anti-MHV (MJ1.3) (red) antibodies. Scale bar, 5 μm. (H) MHV-infected cells coimmunostained with anti-LAMP1 (green) and anti-MHV (MJ1.3) (red) antibodies. Arrows point to LAMP1+/MHV+ puncta. Scale bar, 5 μm. (I) Quantification of colocalization between LAMP1 and MHV, calculated at 6 h (n = 6 cells) and 12 h pi (n = 20 cells). (J) SARS-CoV-2-infected cells coimmunostained with anti-LAMP1 (green) and anti-CoV-2 M (red) antibodies. Arrows point to LAMP1 puncta containing the M label. Scale bar, 2 μm. (K and L) MHV-infected cells fractionated at 12 h pi. MHV genomic RNA associated with LAMP1+ fractions (K) was quantified and plotted (L). Dyngo-4a (30 μM) or vehicle was added from 6–12 h pi (L). Fractionation experiments were done in duplicate; qPCR measurements in each were done in triplicate. Mean data from 2 independent experiments are presented. Representative blot and images are shown. Data are shown as mean ± SEM. p values were considered significant when p < 0.05 and denoted as p < 0.05, ∗∗p < 0.01, ∗∗∗∗p < 10−5; ns, not significant. See also Figures S1, S2, and S3.
Figure S1
Figure S1
Coronavirus Egress and Infectivity, Related to Figure 1 (A) Infected cells were treated with/without BFA at 8 h pi or 10 h pi. Supernatants collected at 14 h pi were reinoculated into new HeLa-mCC1a cells and TCID50/ml was calculated at 72 h . (B) Propidium iodide labeling to detect changes in plasma membrane permeability in MHV-infected cells. As a positive control, cells were treated with staurosporine which induced apoptosis and disrupted the plasma membrane. (C) Trypan blue exclusion was used to detect changes in plasma membrane permeability in MHV-infected cells at 14 h pi. Cells were imaged and the number of trypan blue positive cells quantified and plotted. Scale bar 200 μm. (D) HeLa-mCC1a cells transfected with Gaussia Luciferase and infected with MHV were coimmunostained with anti-Gaussia luciferase (green) and anti-MHV (MJ1.3) (red) antibodies. Scale bar 5 μm. (E) Trypan blue exclusion at 14 h pi was used to detect changes in plasma membrane permeability of MHV-infected cells treated with/without BFA at 8 h pi and 10 h pi. Extracellular viral genomic RNA was quantified with qPCR and plotted as fold increase over uninfected cells. Experiments done in triplicates. Representative images are shown. Data shown as mean ± SEM; ns = not significant.
Figure S2
Figure S2
Spatio-temporal Organization of Subcellular Organelles and Coronavirus during Infection, Related to Figure 1 (A) The density of MHV (MJ1.3) gold particles per 0.5μm2 area (n=10 areas with and n=10 areas without virions) of infected cells is plotted. (B) HeLa-mCC1a cells, infected with MHV, fixed (6 h and 12 h pi), and coimmunostained with anti-E(green) and anti-S (red) antibodies. (C) HeLa-mCC1a cells, infected with MHV, fixed (6 h and 12 h pi), and coimmunostained with anti-E(green) and anti-MHV(MJ1.3) (red) antibodies. (D) HeLa-mCC1a cells infected with MHV, fixed (6 h, 9 h and 12 h pi)) and coimmunostained with anti-TGN46 (green) and anti-MHV(MJ1.3) (red). (E) HeLa-mCC1a cells infected with MHV, fixed (5 h and 14 h pi) and coimmunostained with anti-Golgin97 (green) and anti-MHV(MJ1.3) (red). Scale bar 10 μm. (F) HeLa-mCC1a cells infected with MHV, fixed (6 h and 10 h pi) and coimmunostained with anti-mannosidase II (green) and anti-MHV(MJ1.3) (red). (G) MHV-infected cells, washed, fixed (6 h and 12 h pi), and coimmunostained with anti-cathepsin D (green) and anti-MHV(MJ1.3) (red) antibodies. Arrows point to Cathepsin+/MHV+ puncta. (H) HeLa-mCC1a cells infected with MHV, fixed at 12 h pi and coimmunostained with anti-LAMP1 (blue), anti-MHV(MJ1.3) (red) and anti-Atlastin 3 (green) antibodies. White arrows point to LAMP1+/MHV+ puncta; turquoise arrows point to Atlastin-3+/MHV+ puncta. Representative images are shown. Scale bar 5μm unless indicated.
Figure S3
Figure S3
Coronavirus Distribution in Subcellular Organelles, Related to Figure 1 (A) MHV genomic RNA levels at 12hr pi throughout fractions isolated from Nycodenz gradient. Fractionation experiment was done in duplicate; qPCR measurements in each were done in triplicate. Mean qPCR measurements from the 2 independent experiments plotted. (B) Fractions from (A) processed for SDS-PAGE/Western blotting; probed with antibodies against LAMP1, CI-MPR and ERGIC53 proteins. (C) HeLa cells infected with poliovirus, incubated for 6 hr and fractionated using Nycodenz gradient as in (A). Isolated fractions processed for SDS-PAGE/Western blotting; probed with antibodies against LAMP1, CI-MPR, ERGIC53 and LC3. (D). HeLa-mCC1a cells were infected with MHV, fixed at 12 hr pi and coimmunostained with anti-CI-MPR (green), anti-LAMP1 (blue) and anti-MHV (J1.3) (red) antibodies. White arrows point to LAMP1+/MHV+/CI-MPR- puncta. Scale bar 5 μm. (E) Quantification of colocalization between LAMP1 and CI-MPR in uninfected and infected cell groups (n = 20 cells/group). (F) Dextran uptake in HeLa-mCC1a cells is inhibited by Dyngo-4a treatment. Dyngo-4a (30 μM) or DMSO was incubated with the cells for 6 hr. Alexa 555 Dextran (2mg/ml) was incubated with the cells in the last hour of Dyngo-4a or DMSO treatment. Scale bar 10 μm. Representative blots and images are shown. Data shown as mean ± SEM; where∗∗∗p < 0.0002.
Figure 2
Figure 2
Ultrastructural Localization of MHV and SARS-CoV-2 to Lysosomes during Egress (A) TEM images of MHV-infected cells (14 h pi). Representative images are shown. Cartoon traces of viruses, electron-dense cargo, and membrane swirls are shown in parallel. (B) MHV-infected cells (12 h pi) were processed for immuno-EM and labeled with anti-LAMP1 and 10-nm gold-coupled protein A. (C) TEM images of VeroE6 cells infected with SARS-CoV-2 (24 h pi). Cartoon traces of viruses, electron-dense cargo, and membrane swirls are shown in parallel. Representative images are shown. Scale bars are shown on the micrographs.
Figure 3
Figure 3
β-Coronaviruses and the Chaperone GRP78/BIP Are Co-released during Infection (A and B) MHV-infected and uninfected cells coimmunostained with anti-KDEL receptor (green) and anti-MHV(MJ1.3) (red) antibodies. Scale bars, 5 μm (A) and 10 μm (B). (C) MHV-infected cells coimmunostained with anti-GRP78/BIP (green), anti-LAMP1 (blue), and anti-MHV (MJ1.3) (red) antibodies. Scale bar, 2 μm. (D) GRP78/BIP release from MHV-infected cells. The blot is representative of 2 independent experiments. (E) GRP78/BIP release from MHV-infected cells with or without BFA(5 μg/mL) at the indicated times. All cell lysates and extracellular media were collected at 14 h pi. The blot is representative of 2 independent experiments. Representative images are shown.
Figure 4
Figure 4
β-Coronaviruses, Lysosomal Enzymes, and the Chaperone GRP78/BIP Are Co-released through Arl8b-Dependent Lysosome Exocytosis (A) Surface LAMP1 (red) levels on uninfected and MHV-infected cells. Scale bar, 10 μm. (B) Quantification of surface LAMP1 levels (n = 10 cells/group). (C) Extracellular pro-cathepsin D and cathepsin D in uninfected and MHV-infected cells. (D) Quantification of extracellular cathepsin D. Mean levels of 2 independent experiments were plotted. (E) Quantification of extracellular pro-cathepsin D. Mean levels of 2 independent experiments were plotted. (F) Frequency of lysosome plasma membrane fusion events (n = 7 cells for uninfected; n = 10 cells for MHV infected). Data represented are mean ± SD. (G) Immunoelectron micrographs of LAMP1+/MHV+ organelles (pink arrows) docked at the plasma membrane. Note LAMP1 at the plasma membrane (white arrows). The scale bar is indicated on the micrograph. (H) Arl8b-GFP-transfected, MHV-infected cells coimmunostained with anti-GFP (green), anti-LAMP1 (blue), and anti-MHV(MJ1.3) (red) antibodies. Arrows point to LAMP1/MHV/Arl8b-GFP+ lysosomes. Scale bar, 1 μm. (I) MHV release in Arl8b siRNA-treated cells. Quantified viral genomes were plotted relative to non-target siRNA-treated cells. A representative triplicate dataset of genome levels from 4 independent experiments was plotted. (J) GRP78/BIP release in Arl8b siRNA-treated and MHV-infected cells. Mean levels of 3 independent experiments were plotted. Representative blot and images are shown. Data are shown as mean ± SEM unless otherwise indicated. p values were considered significant when p < 0.05 and denoted as p < 0.05, ∗∗∗p < 0.0002. See also Figure S4.
Figure S4
Figure S4
Modulating Coronavirus Egress, Related to Figure 4 (A) Extent of Arl8b depletion after siRNA treatment. Cell lysates probed with anti-Arl8b and anti-actin antibodies. (B) Quantification of Arl8b depletion from 4 independent experiments. (C) Effect of Rab27 depletion on MHV egress. TCID50/ml was calculated from extracellular media of non-target and Rab27a siRNA treated, MHV-infected cells (10hr pi). Mean data of 2 independent sets of experiments plotted. (D) Effect of GW4869 on MHV egress. Infected cells in serum-free media were treated with GW4869 (10 μM) or DMSO (8-14 hr pi); extracellular media and cell lysates collected at 14hrpi and MHV genomic RNA quantified. Mean data of 2 independent sets of experiments plotted. (E) Western blot of extracellular media from (D) probed with antibody against CD81, a marker for exosomes. (F) Effect of BAPTA-AM calcium chelation on MHV egress and replication. Infected cells treated with BAPTA-AM (30 μM) or DMSO (8-12 hr pi) in calcium-free media with EGTA. Mean data of 2 independent sets of experiments plotted. (G) Effect of Synaptotagmin VII depletion on MHV egress. Cells incubated with Synaptotagmin VII (50nM) or non-target siRNA (50nM) for 72 hr and infected with MHV. Extracellular medium and cell lysates collected at 14 hr pi. Mean data of 2 independent sets of experiments plotted. (H) Extent of Synaptotagmin VII depletion. Western blot of cell lysates from (G) probed with anti-synaptotagmin VII and anti-actin antibodies. Representative blots are shown. Data shown are mean ± SEM. p values were considered significant for p < 0.05 and denoted as where p < 0.05; ∗∗ where p < 0.01; ns = not significant
Figure 5
Figure 5
CID1067700 Blocks β-Coronavirus Egress (A) Immunoelectron micrographs of Rab7+ lysosomes with or without MHV particles. Cells were coimmunostained with anti-GFP, anti-MHV(MJ1.3), and gold-coupled secondary antibodies. Cartoon traces of viruses, electron-dense cargo, and membrane swirls are shown in parallel. Scale bars are indicated on the micrographs. (B) Intracellular LAMP1 levels in MHV-infected cells treated with CID1067700 (8–14 h pi) or DMSO. (C) LAMP1 and anti-MHV (MJ1.3) coimmunostaining in DMSO- and CID1067700-treated (40 μM, 8–14 h pi) cells. Scale bar, 5 μm. (D) Quantification of (C); n = 10 cells/DMSO or CID1067700. (E) Intracellular and extracellular MHV genomic RNA in DMSO- and CID1067700-treated (4 and 40 μM, 8–14 h pi) MHV-infected cells. MHV genomic RNA was plotted as fold change over uninfected from 3 independent experiments. Representative blots and images are shown. Data are shown as mean ± SEM. p values were considered significant when p < 0.05 and denoted as p < 0.05, ∗∗p < 0.01.
Figure 6
Figure 6
Lysosomes Are Deacidified and Lysosomal Enzymes Are Inactive in β-Coronavirus-Infected Cells (A) LysoTracker Red DND-99 and LAMP1 co-staining in HeLa-mCC1a and VeroE6 cells. Scale bar, 5 μm. (B) LysoTracker Red DND-99 staining of MHV-infected HeLa-mCC1a cells (12 h pi), primary mouse macrophages (12 h pi), and SARS-CoV-2-infected Vero E6 cells (24 h pi). Scale bars, 5 μm for HeLa-mCC1a and macrophages and 10 μm for Vero E6 cells. (C) Mean LysoTracker Red DND-99 fluorescence intensity per punctum (i.e., late endosome/lysosome) in MHV/HeLa-mCC1, MHV/primary mouse macrophage, and CoV-2/VeroE6 infected cell groups; n = 20 cells/group; 10 puncta/cell scored. (D) Number of LysoTracker Red DND-99 positive puncta (i.e., late endosome/lysosome) per MHV/HeLa-mCC1 or CoV-2/VeroE6 infected cell groups; n = 30 cells/group. (E) pH of lysosomes in MHV-infected HeLa-mCC1a cells. Mean LysoSensor Green fluorescence intensity in uninfected and MHV-infected cell groups (n = 18 cells/group, 10 lysosome/cell) was converted to a pH value from calibration of the dye. Data represented are mean ± SD. (F) Lysosome enzyme activity in uninfected and MHV-infected HeLa-mCC1a cell groups; n = 55 cells/group. The mean fluorescence intensity of lysosome substrate colocalizing with endocytosed dextran was measured for each group. Representative images are shown. Data are shown as mean ± SEM unless otherwise indicated. p values were considered significant when p < 0.05 and denoted as p < 0.05, ∗∗∗p < 0.0002. See also Figure S5.
Figure S5
Figure S5
SARS-CoV2-ORF3a and Lysosomes, Related to Figure 6 (A) Cells expressing strep-tagged SARS-CoV2-ORF3a were coimmunostained with anti-strep (red) and anti-LAMP1 (green). Inset shows extensive co-labeling of LAMP1 structures with ORF3a. Scale bar 5 μm. (B) Cells ectopically expressing SARS-CoV2-ORF3a-GFP labeled with LysoTracker Red DND-99. Scale bar 10 μm. Representative images shown.
Figure 7
Figure 7
Lysosome-Dependent Antigen Cross-Presentation Pathways Are Disrupted in β-Coronavirus-Infected Cells (A and B) Sketch and (B) timeline of assay to test the effect of MHV infection on antigen uptake and cross-presentation. (C) Measurement of fluorescent OVA uptake by bone marrow-derived macrophages with or without prior infection with MHV. (D) Measurement of OVA antigen presentation bone marrow-derived macrophages (with or without viral infection), measured as the percentage of CD69+ activated T cells. (E and F) Sketch and (F) Timeline of the assay to measure the amount of HLA-F open conformers on the surface of infected HeLa-mCC1a cells, using a Jurkat KIR3DL1 reporter cell. (G) ERK phosphorylation in KIR3DL1 reporter cells as a measure of the amount of open HLA-F conformers on the surface of HeLa cells (with or without viral infection). Phorbol myristate acetate (PMA) and null activation were used to normalize ERK phosphorylation, respectively. All experiments were done in triplicate. Data are shown as mean ± SEM. p values are indicated on the plots.

Comment in

Similar articles

Cited by

References

    1. Agola J.O., Hong L., Surviladze Z., Ursu O., Waller A., Strouse J.J., Simpson D.S., Schroeder C.E., Oprea T.I., Golden J.E., et al. A competitive nucleotide binding inhibitor: in vitro characterization of Rab7 GTPase inhibition. ACS Chem. Biol. 2012;7:1095–1108. - PMC - PubMed
    1. Aranda-Romo S., Garcia-Sepulveda C.A., Comas-García A., Lovato-Salas F., Salgado-Bustamante M., Gómez-Gómez A., Noyola D.E. Killer-cell immunoglobulin-like receptors (KIR) in severe A (H1N1) 2009 influenza infections. Immunogenetics. 2012;64:653–662. - PubMed
    1. Ballabio A., Bonifacino J.S. Lysosomes as dynamic regulators of cell and organismal homeostasis. Nat. Rev. Mol. Cell Biol. 2020;21:101–118. - PubMed
    1. Boda A., Lőrincz P., Takáts S., Csizmadia T., Tóth S., Kovács A.L., Juhász G. Drosophila Arl8 is a general positive regulator of lysosomal fusion events. Biochim. Biophys. Acta Mol. Cell Res. 2019;4:533–544. - PubMed
    1. Brazill D.T., Caprette D.R., Myler H.A., Hatton R.D., Ammann R.R., Lindsey D.F., Brock D.A., Gomer R.H. A protein containing a serine-rich domain with vesicle fusing properties mediates cell cycle-dependent cytosolic pH regulation. J. Biol. Chem. 2000;275:19231–19240. - PubMed

Publication types