. 2020 Dec 14;38(6):803-817.e4.
doi: 10.1016/j.ccell.2020.10.011. Epub 2020 Nov 5.

Molecular Subsets in Renal Cancer Determine Outcome to Checkpoint and Angiogenesis Blockade

Affiliations

Molecular Subsets in Renal Cancer Determine Outcome to Checkpoint and Angiogenesis Blockade

Robert J Motzer et al. Cancer Cell. .

Abstract

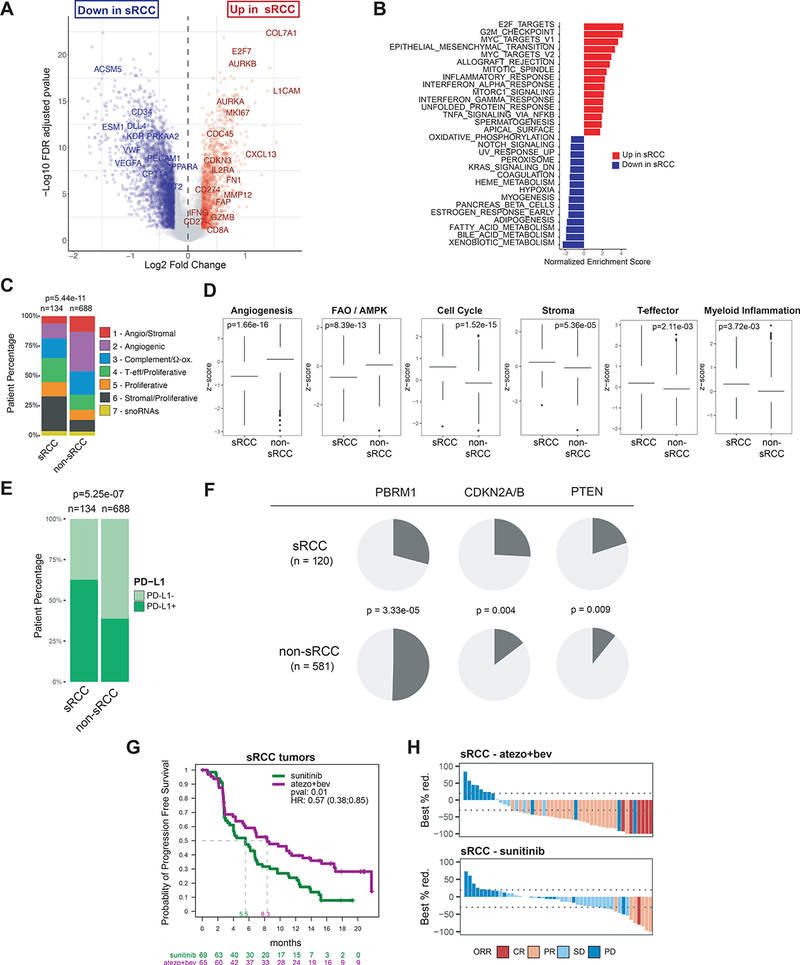
Integrated multi-omics evaluation of 823 tumors from advanced renal cell carcinoma (RCC) patients identifies molecular subsets associated with differential clinical outcomes to angiogenesis blockade alone or with a checkpoint inhibitor. Unsupervised transcriptomic analysis reveals seven molecular subsets with distinct angiogenesis, immune, cell-cycle, metabolism, and stromal programs. While sunitinib and atezolizumab + bevacizumab are effective in subsets with high angiogenesis, atezolizumab + bevacizumab improves clinical benefit in tumors with high T-effector and/or cell-cycle transcription. Somatic mutations in PBRM1 and KDM5C associate with high angiogenesis and AMPK/fatty acid oxidation gene expression, while CDKN2A/B and TP53 alterations associate with increased cell-cycle and anabolic metabolism. Sarcomatoid tumors exhibit lower prevalence of PBRM1 mutations and angiogenesis markers, frequent CDKN2A/B alterations, and increased PD-L1 expression. These findings can be applied to molecularly stratify patients, explain improved outcomes of sarcomatoid tumors to checkpoint blockade versus antiangiogenics alone, and develop personalized therapies in RCC and other indications.

Keywords: CDKN2A/B; PBRM1; PD-L1; VHL; atezolizumab; bevacizumab; checkpoint blockade; integrated genomics; renal cell carcinoma; sarcomatoid; sunitinib.


Conflict of interest statement

Declaration of Interests R.J.M. has received honoraria for advisory roles from Roche–Genentech (RGE), Pfizer, Novartis, Exelixis, Eisai, Lilly Oncology, AstraZeneca (AZ), Incyte, and Merck Sharp & Dohme (MSD), and institutional support from Bristol-Myers Squibb (BMS), RGE, Pfizer, Novartis, Exelixis, and Eisai outside of the submitted work. T.P. has received grants from AZ and RGE, and honoraria from AZ, RGE, BMS, Pfizer, Novartis, Exelixis, and MSD outside of the submitted work. DFM has received grants from BMS and Prometheus and honoraria for consulting roles from BMS, Pfizer, MSD, Novartis, Eisai, Exelixis, Array BioPharm, and RGE outside of the submitted work. M.B.A. has received grants from RGE during the conduct of the study and honoraria for consulting roles outside of the submitted work from RGE, BMS, MSD, Novartis, Pfizer, Exelixis, and Esai. B.E. has received grants and honoraria from BMS, Novartis, Ipsen, and EUSA outside of the submitted work. B.R. has received grants and honoraria from RGE and Pfizer during the conduct of the study and has received grants to his institution from MSD, Peloton, Aveo, BMS, AZ, and honoraria for consulting roles from Novartis, Synthorx, Compugen, Corvus, Exelixis, Arravive, Surface Oncology, 3D Medicines, and holds stock in PTC therapeutics, all outside of the submitted work. R.B., H.H., L.-F.L., N.L., A.R.A., J.F., H.K., J.L., S.M., M.G., D.T., and M.A.H. are employees of Genentech Inc. S.C. is an employee of Calithera Biosciences Inc. K.H. is an employee of Crescendo Biologics Inc. P.S.H. is an employee of Foundation Medicine Inc.

Figures

Figure 1:
Figure 1:. Transcriptional stratification identifies advanced RCC tumor subsets with distinct biologies.
A. Consensus matrix depicting clusters (k=7) identified by non-negative matrix factorization (NMF) clustering of 823 patient tumors. B. Heatmap representing MSigDb hallmark gene set QuSAGE enrichment scores for each NMF patient cluster compared to all other patients. Black cells represent non-significant enrichment after FDR correction. C. Heatmap of genes comprised in transcriptional signatures. Z-scores were calculated for each gene. Samples are grouped by NMF cluster. (FAO: fatty acid oxidation; FAS: fatty acid synthesis) D. Dot plot summarizing the heatmap in C. Samples were aggregated by NMF group using the mean across samples for each gene, and the mean z-score for each signature was calculated, resulting in one z-score per signature per NMF cluster. The horizontal bar chart on the right depicts the −log10(p-value) obtained from Kruskal-Wallis test for each signature across NMF clusters. E. Bar chart representing PD-L1 expression by immunohistochemistry in each NMF cluster. P-value was obtained from Pearson’s Chi-squared test.
Figure 2:
Figure 2:. Association between transcriptomic clusters and clinical outcomes to atezolizumab+bevacizumab or sunitinib in advanced RCC.
A. Bar charts representing non-negative matrix factorization (NMF) cluster distribution by Memorial-Sloan Kettering Cancer Center (MSKCC, left panel) or International Metastatic Renal Cell Carcinoma Database Consortium (IMDC, right panel) clinical risk categories. P-values were obtained from Pearson’s Chi-squared test. B. Kaplan-Meier curves of progression-free survival (PFS) in NMF clusters of patients treated with atezolizumab+bevacizumab or sunitinib. C. Bar chart representing objective response rate by treatment arm in each NMF cluster. P-value was obtained using Pearson’s Chi-squared test. [NE, not evaluable; PD, progressive disease; SD, stable disease; PR, partial response; CR, complete response; n.s., not statistically significant (p-value > 0.05); A/B, atezolizumab+bevacizumab; Sun, sunitinib]. D. Forest plots for PFS hazard ratios in patients treated with atezolizumab+bevacizumab (A/B) vs. sunitinib, by NMF cluster. mPFS = median PFS.
Figure 3:
Figure 3:. Association between somatic alterations and transcriptome in advanced RCC tumors.
A. Oncoprint of genes with alterations in at least 10% of 715 tumors. Tumor mutation burden (TMB) is represented for individual samples as a bar chart above the oncoprint. B. Oncoprints displaying alterations in non-negative matrix factorization (NMF) clusters. The horizontal bar charts to the right of each oncoprint represent the number of patients with alterations for each gene. P-values were obtained using the Pearson’s Chi-squared test (**: p<0.01; ***: p<0.001). C. NMF cluster distribution in patients with somatic alterations in PBRM1, KDM5C, CDKN2A/B, TP53, and BAP1 D. Left panel: Hierarchical cluster depicting the ratio of transcriptional signature z-scores (columns) between altered and non-altered tumor samples for each gene considered (rows). Only genes with alterations in >=10% of patients and significant differences (p<0.05) between altered and non-altered tumors as measured by the two-side Mann-Whitney test for at least one of the transcriptional signatures considered are displayed. Right panel: Boxplots representing the z-scores of gene signatures in samples with genomic alterations in PBRM1 (n=328), KDM5C (n=100), TP53 (n=107) and/or CDKN2A/B (n=116). P-values represent the statistical significance of the comparison of signature z-scores between patients with PBRM1 and/or KDM5C alterations vs. patients with TP53 and/or CDKN2A/B alterations using the two-side Mann-Whitney test.
Figure 4:
Figure 4:. Association between tumor somatic alterations and clinical outcomes.
A. Kaplan-Meier curves of progression-free survival (PFS) by treatment arm in patients with altered or non-altered tumors. B. Bar charts depicting objective response (OR) by arm and by alteration status for the same genes. P-values were obtained from Pearson’s Chi-squared test. [NE, not evaluable; PD, progressive disease; SD, stable disease; PR, partial response; CR, complete response; n.s., not statistically significant (p-value > 0.05); A/B, atezolizumab+bevacizumab; Sun, sunitinib]. C. Forest plot representing PFS hazard ratios in patients with altered vs non-altered tumors, by gene and treatment arm. (mPFS = median PFS).
Figure 5:
Figure 5:. Genomic landscape and clinical outcomes in sarcomatoid tumors.
A. Volcano plot representing differentially expressed genes between sarcomatoid RCC (sRCC) and non sarcomatoid (non-sRCC) tumors. Genes with FDR-corrected p<0.05 and absolute log-fold change >= 0.25 are represented in red or blue. B. Bar chart representing pathway enrichment scores for the top 15 upregulated or downregulated MSigDb hallmark gene sets within the differentially expressed genes identified in A. C. Bar chart representing the distribution of non-negative matrix factorization (NMF) defined transcriptomic subgroups. D. Bar charts representing transcriptional signature z-scores, with p-values obtained from two-sided Mann-Whitney test. E. Bar chart depicting prevalence of PD-L1 expression by immunohistochemistry. F. Pie charts representing the distribution of somatic alterations for select genes in sRCC vs. non-sRCC tumors, with p-values obtained from Pearson’s Chi-squared test. G. Kaplan-Meier curves of progression-free survival (PFS) in sRCC patients treated with atezolizumab+bevacizumab or sunitinib. H. Waterfall plots depicting the best percent reduction from baseline in sum of longest diameters (SLD). Bar color indicates objective response defined by RECIST1.1. Objective response rate was 49% in sRCC patients treated with atezolizumab+bevacizumab, and 14% in sRCC patients treated with sunitinib, p=7.7e-05 with Pearson’s Chi-squared test. CR, complete response; PR, partial response; SD, stable disease; PD, progressive disease.
Figure 6:
Figure 6:. Summary of molecular characteristics in transcriptomic subsets in tumors from advanced RCC patients.
Radar charts in the RNA profile panel represent mean z-scores for each gene signature in the respective cluster. MSKCC = Memorial Sloan-Kettering Cancer Center; FAS, fatty acid synthesis; AMPK, AMP-activated protein kinase.

Similar articles

Cited by

References

    1. Aran D, Hu Z, and Butte AJ (2017). xCell: digitally portraying the tissue cellular heterogeneity landscape. Genome Biol 18, 220. - PMC - PubMed
    1. Beuselinck B, Job S, Becht E, Karadimou A, Verkarre V, Couchy G, Giraldo N, Rioux-Leclercq N, Molinie V, Sibony M, et al. (2015). Molecular subtypes of clear cell renal cell carcinoma are associated with sunitinib response in the metastatic setting. Clin Cancer Res 21, 1329–1339. - PubMed
    1. Brady OA, Jeong E, Martina JA, Pirooznia M, Tunc I, and Puertollano R (2018). The transcription factors TFE3 and TFEB amplify p53 dependent transcriptional programs in response to DNA damage. Elife 7. - PMC - PubMed
    1. Braicu C, Zimta AA, Harangus A, Iurca I, Irimie A, Coza O, and Berindan-Neagoe I (2019). The Function of Non-Coding RNAs in Lung Cancer Tumorigenesis. Cancers (Basel) 11. - PMC - PubMed
    1. Brannon AR, Reddy A, Seiler M, Arreola A, Moore DT, Pruthi RS, Wallen EM, Nielsen ME, Liu H, Nathanson KL, et al. (2010). Molecular Stratification of Clear Cell Renal Cell Carcinoma by Consensus Clustering Reveals Distinct Subtypes and Survival Patterns. Genes Cancer 1, 152–163. - PMC - PubMed

Publication types

MeSH terms