. 2020 Dec 14;38(6):829-843.e4.
doi: 10.1016/j.ccell.2020.10.008. Epub 2020 Nov 5.

Large-Scale Characterization of Drug Responses of Clinically Relevant Proteins in Cancer Cell Lines

Affiliations

Large-Scale Characterization of Drug Responses of Clinically Relevant Proteins in Cancer Cell Lines

Wei Zhao et al. Cancer Cell. .

Abstract

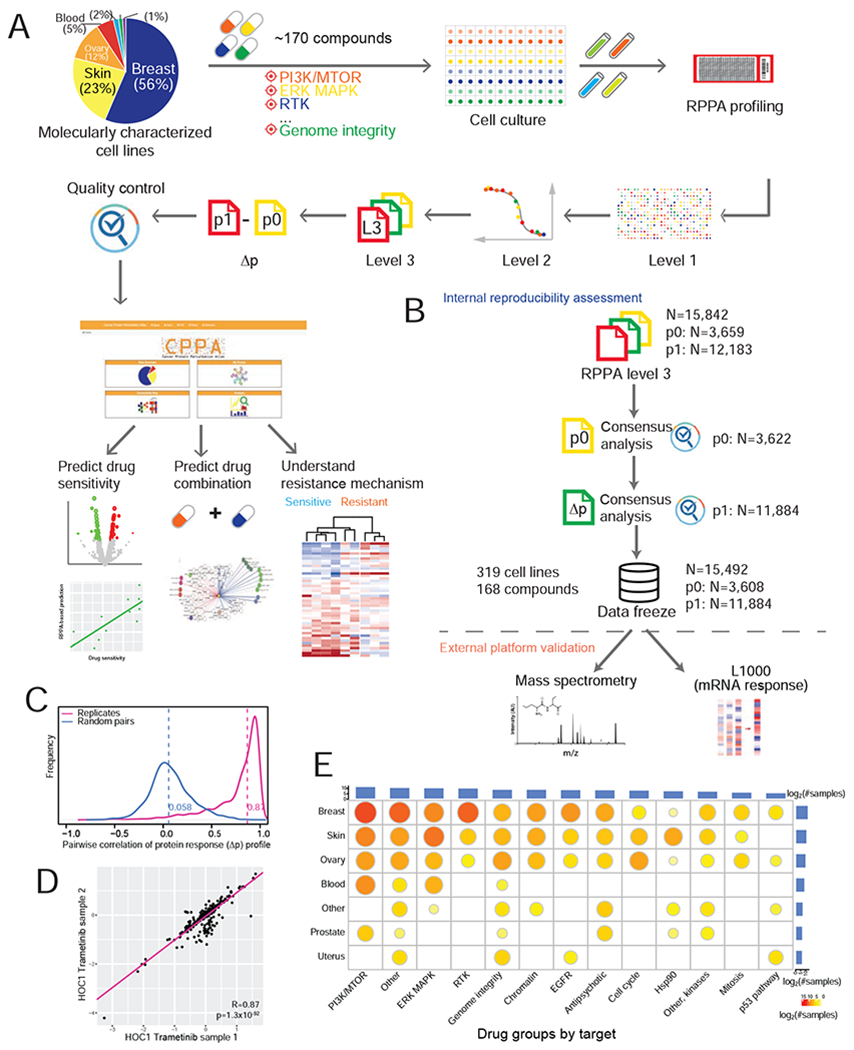
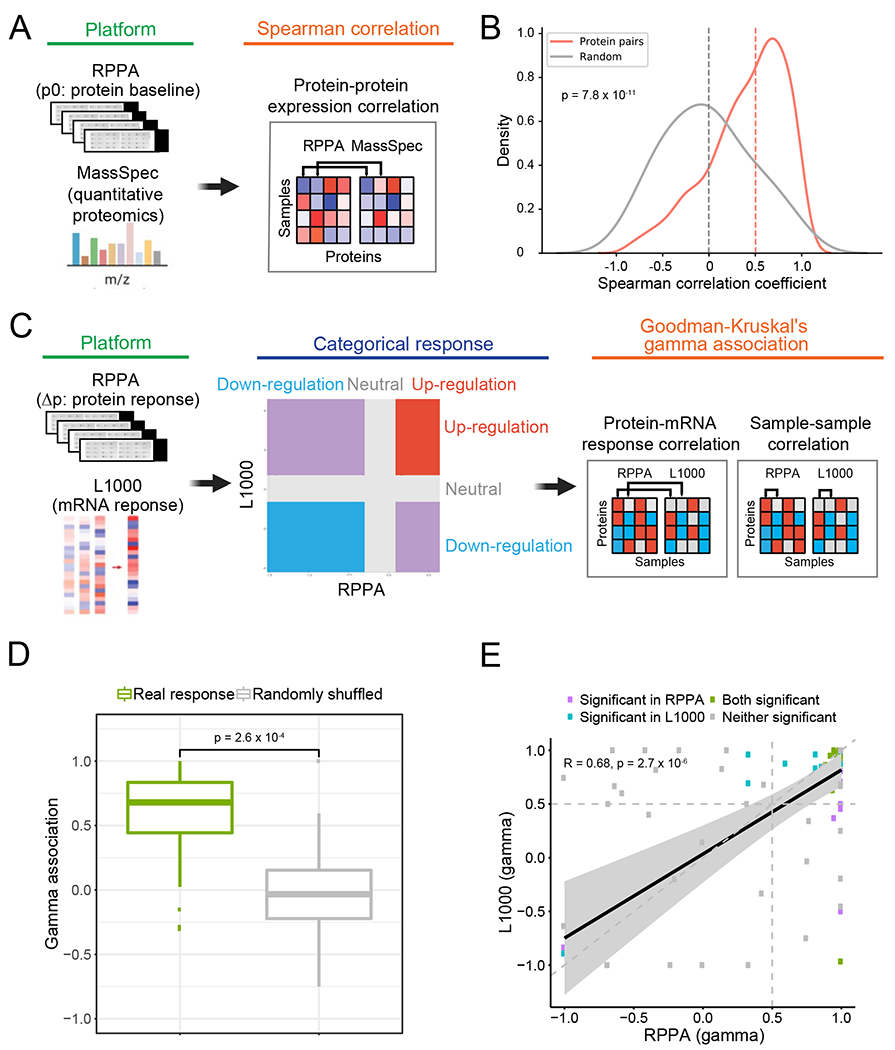
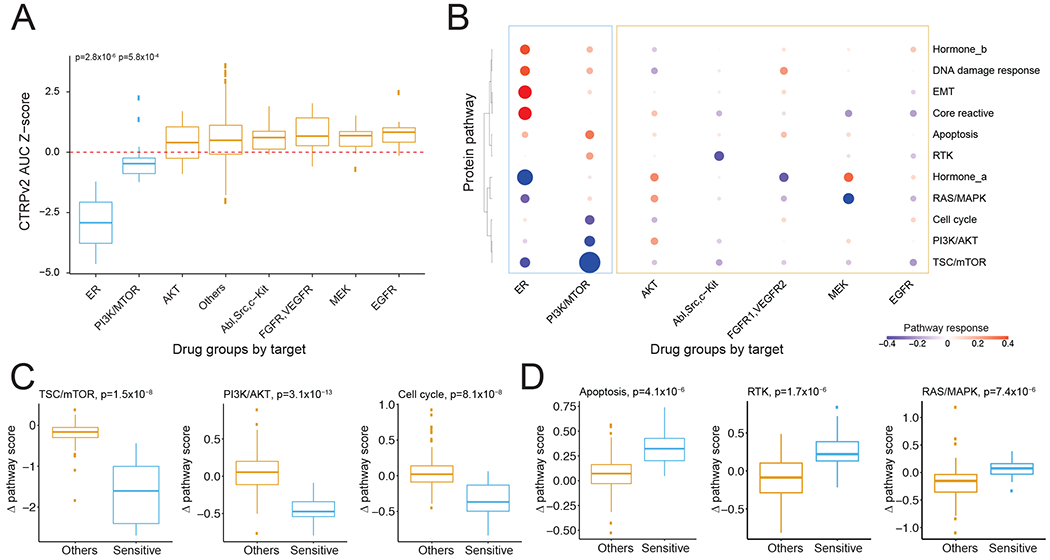
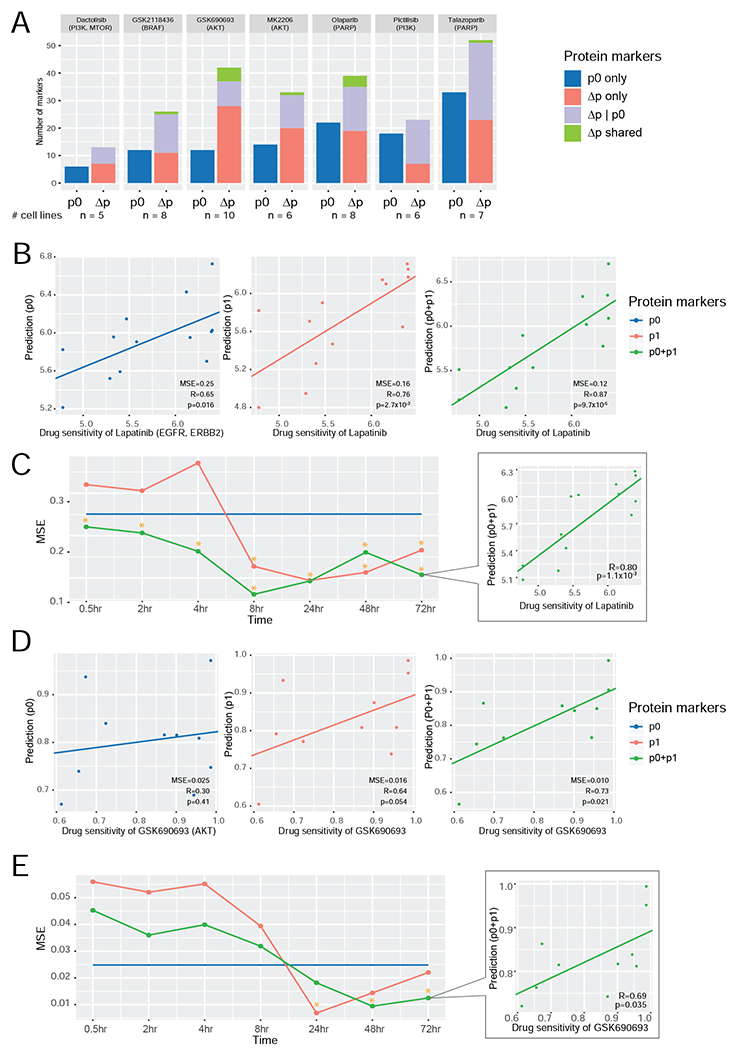
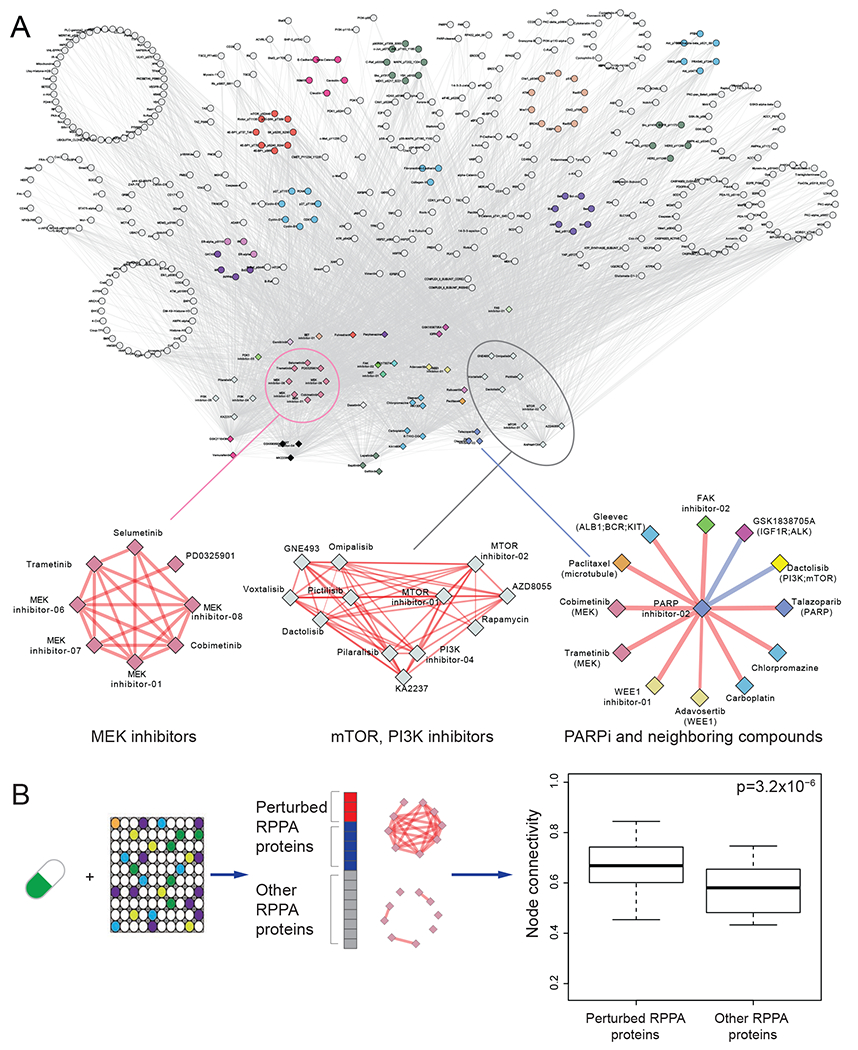
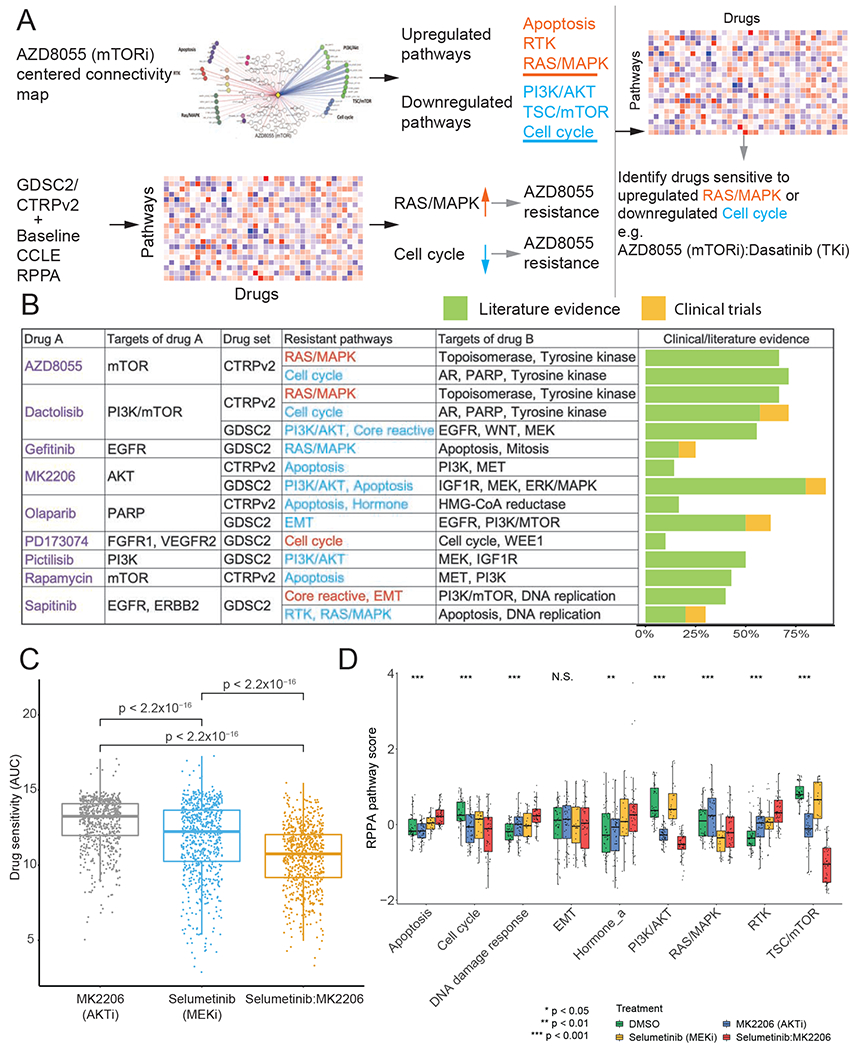
Perturbation biology is a powerful approach to modeling quantitative cellular behaviors and understanding detailed disease mechanisms. However, large-scale protein response resources of cancer cell lines to perturbations are not available, resulting in a critical knowledge gap. Here we generated and compiled perturbed expression profiles of ∼210 clinically relevant proteins in >12,000 cancer cell line samples in response to ∼170 drug compounds using reverse-phase protein arrays. We show that integrating perturbed protein response signals provides mechanistic insights into drug resistance, increases the predictive power for drug sensitivity, and helps identify effective drug combinations. We build a systematic map of "protein-drug" connectivity and develop a user-friendly data portal for community use. Our study provides a rich resource to investigate the behaviors of cancer cells and the dependencies of treatment responses, thereby enabling a broad range of biomedical applications.

Keywords: biomarker; cancer signaling pathway; drug response; protein array.


Conflict of interest statement

Declaration of Interests R.A. is a bioinformatics consultant for the University of Houston. G.B.M. is on the scientific advisory board or a consultant for AstraZeneca, ImmunoMet, Lilly, Nuevolution, PDX Pharmaceuticals, Symphogen, and Tarveda; has stock options with Catena Pharmaceuticals, ImmunoMet, SignalChem, and Tarveda; and has licensed technologies to Myriad and Nanostring. H.L. is a shareholder and scientific advisor of Precision Scientific Ltd.

Figures

Figure 1.
Figure 1.. Summary of the perturbed RPPA profiling data in this study.
(A) Overview of the RPPA profiling experiments and data processing of cell line perturbations. The pie chart shows the lineage distribution of cancer cell lines profiled (n = 319). (B) The RPPA quality control pipeline, which contains within-platform assessment and external validation using independent platforms. (C) Reproducibility of perturbed RPPA data based on protein response (Δp) profiles of technical replicates (n = 2,753 pairs). (D) A representative scatter plot showing the correlation of Δp between two replicate samples across protein markers. (E) The distribution of drug-treated samples by cell lineages and drug groups. The bar plots show the numbers of samples profiled for each lineage or drug group, and the size of the circle is proportional to the number of samples profiled for each lineage-drug combination. See also Figure S1, Figure S6 and Table S1.
Figure 2.
Figure 2.. Quality assessment of RPPA-based protein expression data using independent platforms
(A) Overview of the comparison between RPPA-based and mass spectrometry-based protein expression data. (B) The distribution of correlation coefficients of matched and random protein pairs between RPPA and mass spectrometry. The median values are marked by dash lines. (C) Overview of the comparison between RPPA-based protein response and L1000-based mRNA response (see STAR Methods for details). (D) Boxplots of protein-mRNA response associations between the RPPA and L1000 platforms using the same perturbations (i.e., the same cell line and the same compound, n = 46). The gamma associations from the real responses (green box) were compared to those from the randomly shuffled background distribution (grey box). The p-value is based on a paired Student’s t-test. The middle line in the box is the median, the bottom and top of the box are the first and third quartiles, and the whiskers extend to 1.5 IQR of the lower and upper quartiles, respectively. (E) Scatter plot showing the correlation of sample-sample gamma associations from the RPPA (x-axis) and L1000 (y-axis) platforms. Only significant data points (γ associations) with FDR < 0.01 in either platform are shown. Pearson’s correlation coefficient and p-value are shown.
Figure 3.
Figure 3.. Protein responses to various drug treatments in MCF7 cells
(A) A comparison of MCF7 drug sensitivity data between different drug groups using CTRPv2 data. (B) Heatmap showing the pathway responses among drug groups. The size of the circle is proportional to the effect size of the protein changes. (C, D) Boxplots showing significantly down- (C) and up-regulated pathways (D) in sensitive drug groups. The p-values were calculated by Student’s t-test. See also Figure S2.
Figure 4.
Figure 4.. Differentially expressed protein markers between cobimetinib-sensitive and - resistant cell lines
(A, B) Heatmaps showing baseline (A) and perturbed protein expressions (B) with significant differences between sensitive and resistant cell lines (FDR < 0.1). Each protein marker is annotated by whether it is a dual marker (i.e., significant both in p0 and Δp), BCL-2 family member, or belongs to a specific pathway. (C) Cartoon summary of baseline protein levels and adaptive protein responses to MEK inhibitors between the two cell groups. The difference of pathway scores between the two groups was assessed based on the Student’s t-test. See also Figure S3.
Figure 5.
Figure 5.. Comparison of the predictive power of protein markers for drug sensitivity
(A) A summary of predictive markers based on baseline level (p0) and protein response (Δp) using drug response data from GDSC2. Given a specific drug, three types of predictive markers were identified: (i) proteins whose p0 level is significantly correlated with drug sensitivity; (ii) proteins whose Δp level is significantly correlated with drug sensitivity; and (iii) proteins whose Δp level is significantly correlated with drug sensitivity, given the p0 contribution. Protein markers identified based on both Δp only and Δp|p0 are called Δp shared. The number of cell lines for each compound is shown at the bottom. (B, D) The scatter plots showing the correlations between the predicted and measured drug sensitivity values of lapatinib (B) and GSK690693 (D) based on the multivariate models using three sets of protein markers, respectively (left, p0; middle, p1; and right, p0 + p1). Measured sensitivity data of lapatinib (n = 13 cell lines) and GSK690693 (n = 10 cell lines) were from Daemen et al. (2013) and GDSC2, respectively. (C, E) The MSE curves of the three predictive models at different time points for lapatinib (C) and GSK690693 (E). The time points with significant correlations between the predicted and measured values are indicated with *. The scatter plot at the last time point is shown.
Figure 6.
Figure 6.. A “drug-protein” connectivity map based on protein response signals
(A) A global view of the drug-protein connectivity map with highlighted examples of drug-drug correlation networks (i.e., MEK inhibitors, mTOR, PI3K inhibitors, and neighboring drugs of a PARP inhibitor). Red/blue edges represent positive/negative drug-drug correlations, respectively. Proteins were grouped and colored by their related functional pathways. Drugs were grouped and colored by their targeted genes or pathways. (B) Comparison of node connectivity between perturbed and neutral proteins in the protein interaction network. The p-value was computed based on a paired Wilcoxon test. The middle line in the box is the median, the bottom and top of the box are the first and third quartiles, and the whiskers extend to 1.5 IQR of the lower and upper quartiles, respectively. See also Figure S4 and S5.
Figure 7.
Figure 7.. Prediction of drug combinations based on connectivity maps
(A) The workflow of drug combination prediction. (B) Summary of predicted drug combinations and the corresponding literature/clinical evidence. (C) Boxplots showing CTRPv2 drug sensitivities of cell lines treated with MK2206 (AKT inhibitor), selumetinib (MEK inhibitor), and the combination (p-values were calculated by Wilcoxon tests; n = 706 cell lines for each treatment). (D) Protein pathway scores for samples treated with DMSO (n = 48 samples), MK2206 (n = 48 samples), selumetinib (n = 24 samples), and the combination (p-values were calculated by ANOVA tests; n = 48 samples). The middle line in the box is the median, the bottom and top of the box are the first and third quartiles, and the whiskers extend to 1.5 IQR of the lower and upper quartiles, respectively. See also Table S2.

References

    1. Akbani R, Ng PK, Werner HM, Shahmoradgoli M, Zhang F, Ju Z, Liu W, Yang JY, Yoshihara K, Li J, et al. (2014). A pan-cancer proteomic perspective on The Cancer Genome Atlas. Nat Commun 5, 3887. - PMC - PubMed
    1. Barretina J, Caponigro G, Stransky N, Venkatesan K, Margolin AA, Kim S, Wilson CJ, Lehar J, Kryukov GV, Sonkin D, et al. (2012). The Cancer Cell Line Encyclopedia enables predictive modelling of anticancer drug sensitivity. Nature 492, 290–290. - PMC - PubMed
    1. Basu A, Bodycombe NE, Cheah JH, Price EV, Liu K, Schaefer GI, Ebright RY, Stewart ML, Ito D, Wang S, et al. (2013). An interactive resource to identify cancer genetic and lineage dependencies targeted by small molecules. Cell 154, 1151–1161. - PMC - PubMed
    1. Cragg MS, Jansen ES, Cook M, Harris C, Strasser A, and Scott CL (2008). Treatment of B-RAF mutant human tumor cells with a MEK inhibitor requires Bim and is enhanced by a BH3 mimetic. J Clin Invest 118, 3651–3659. - PMC - PubMed
    1. Daemen A, Griffith OL, Heiser LM, Wang NJ, Enache OM, Sanborn Z, Pepin F, Durinck S, Korkola JE, Griffith M, et al. (2013). Modeling precision treatment of breast cancer. Genome Biol 14, R110. - PMC - PubMed

Publication types

Substances