

Peptide-MHC Binding Reveals Conserved Allosteric Sites in MHC Class I- and Class II-Restricted T Cell Receptors (TCRs)
- PMID: 33157083
- PMCID: PMC8356565
- DOI: 10.1016/j.jmb.2020.10.031
Peptide-MHC Binding Reveals Conserved Allosteric Sites in MHC Class I- and Class II-Restricted T Cell Receptors (TCRs)
Abstract
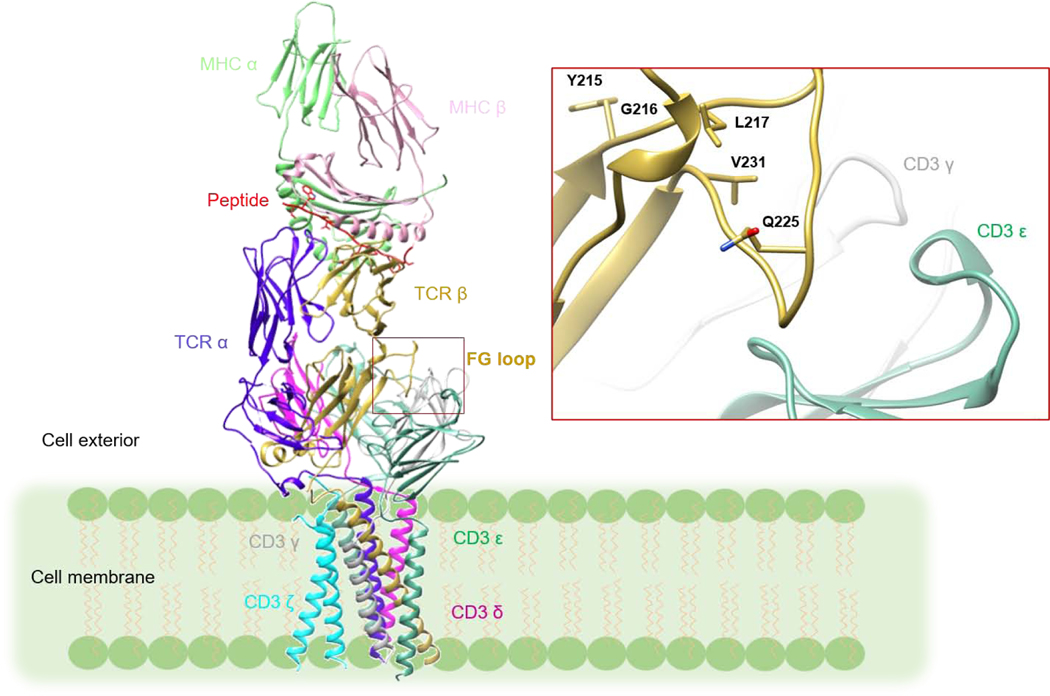
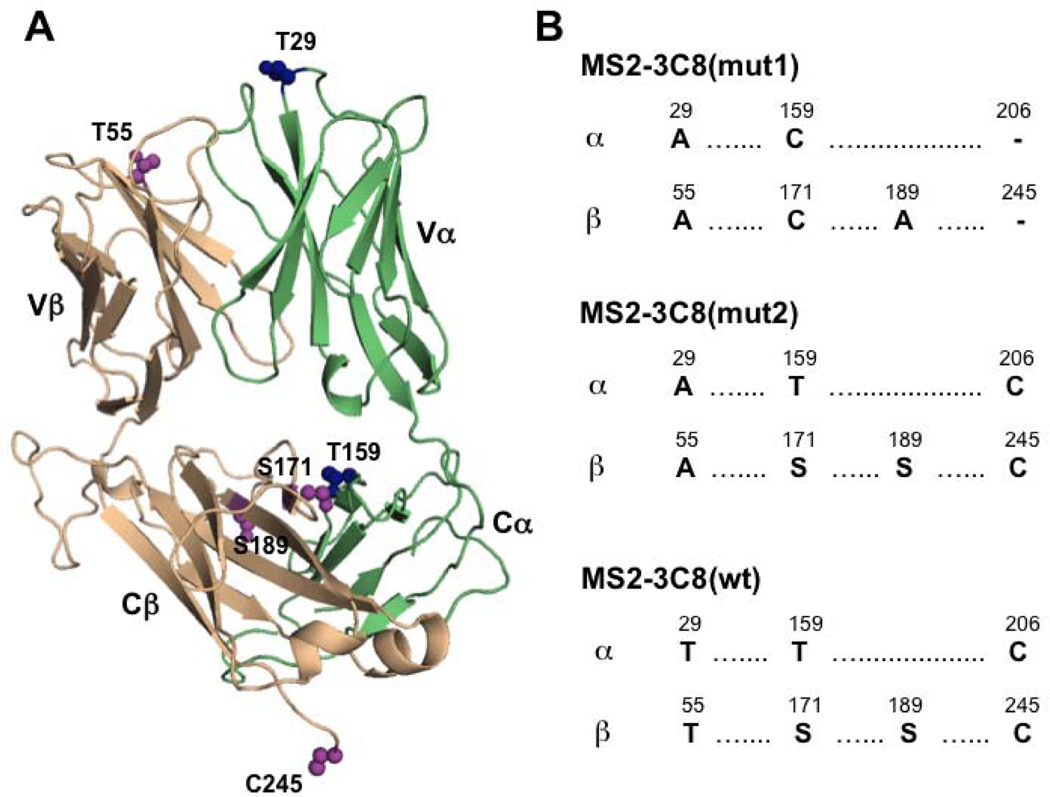
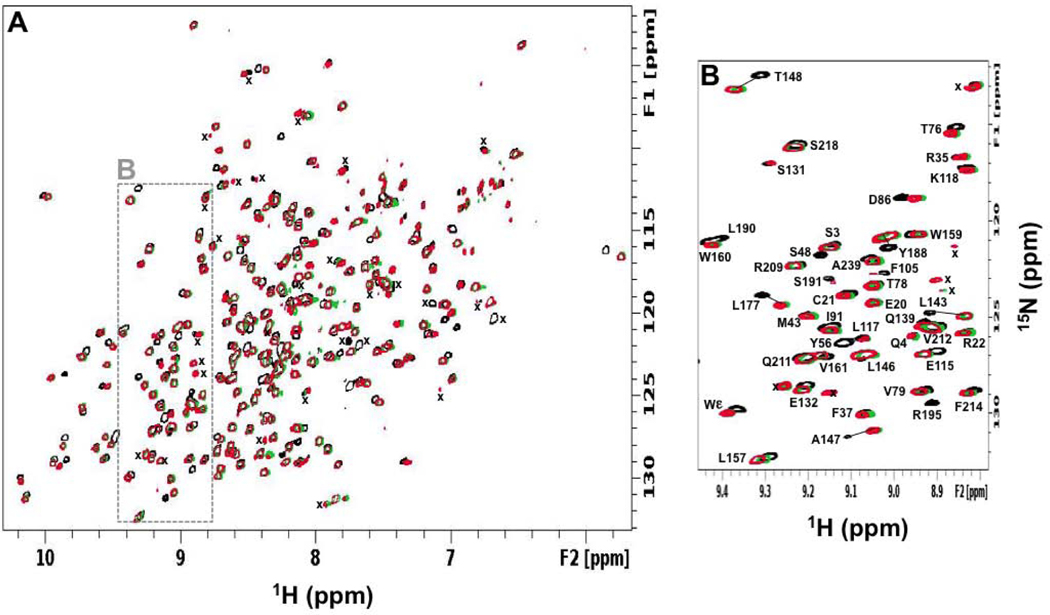
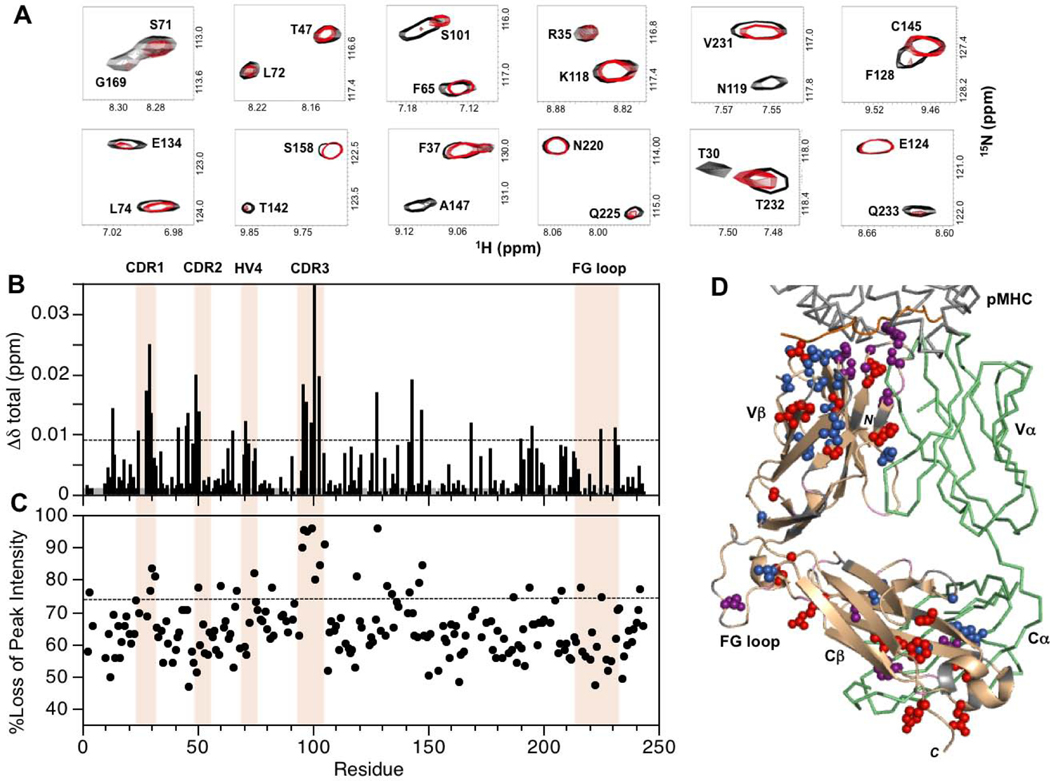
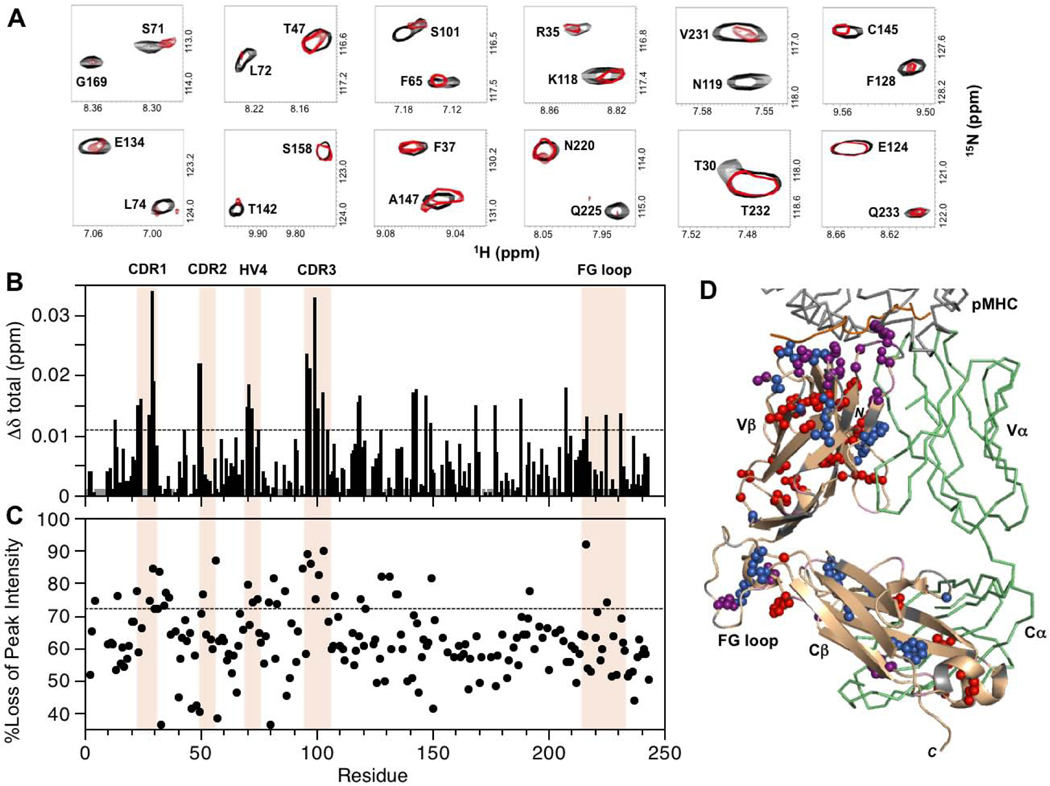
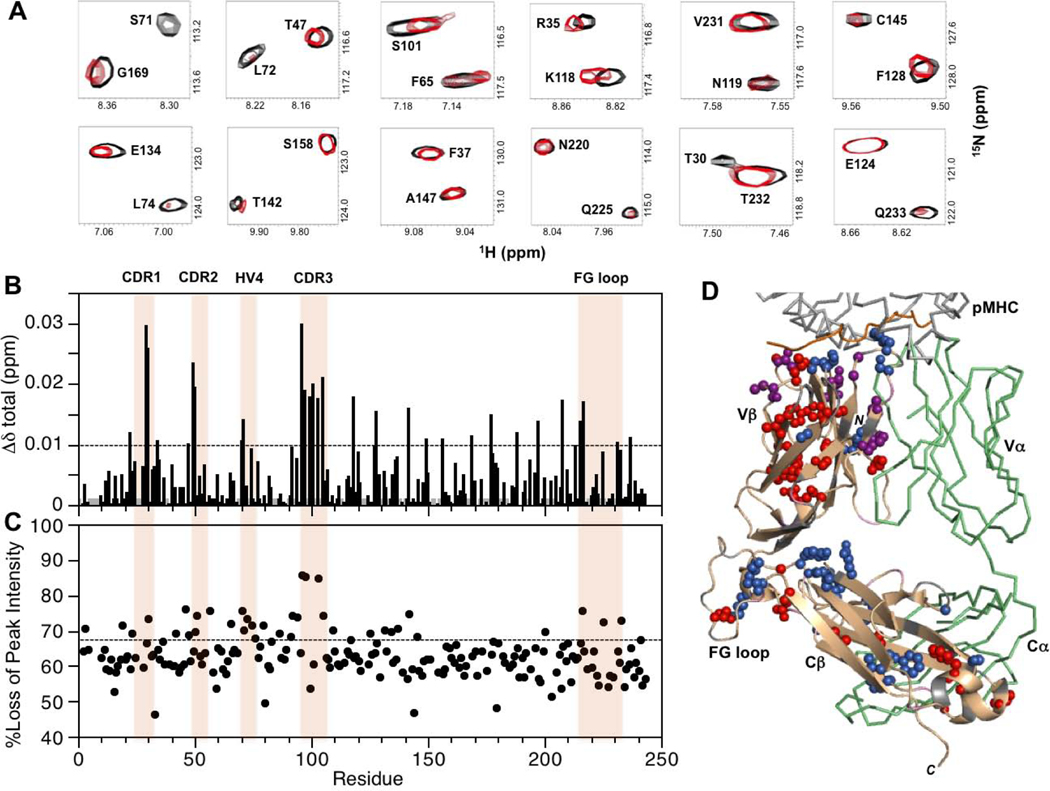
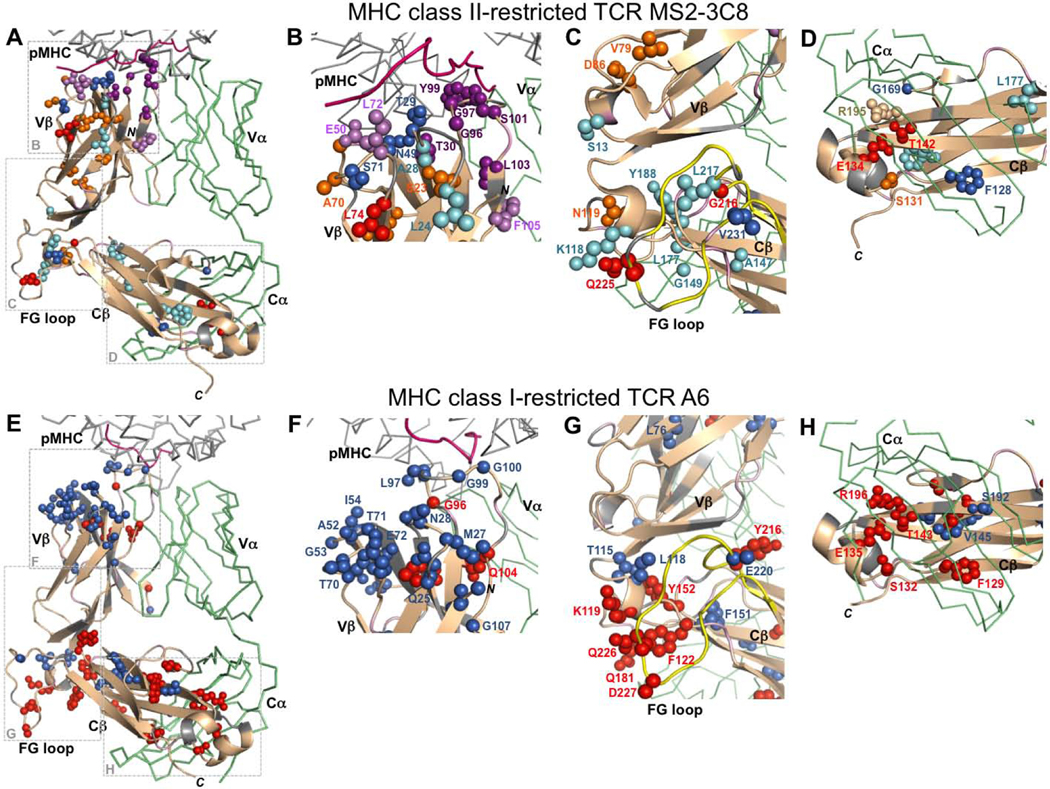
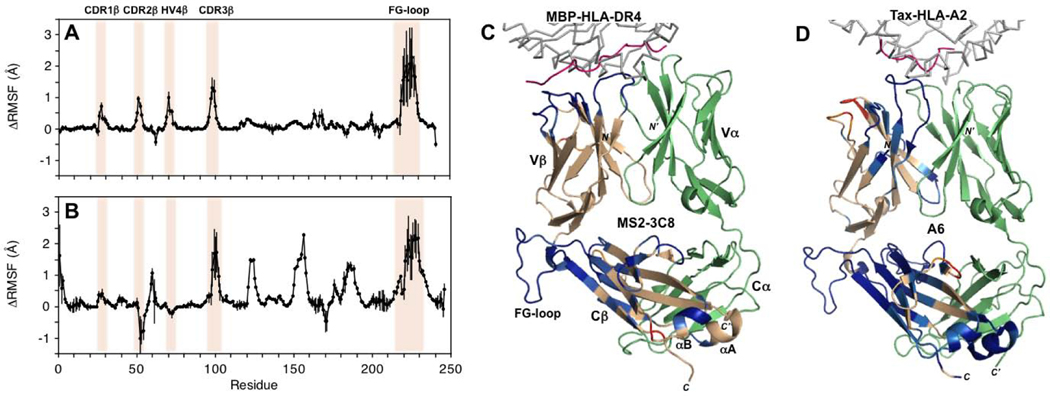
T cells are vital for adaptive immune responses that protect against pathogens and cancers. The T cell receptor (TCR)-CD3 complex comprises a diverse αβ TCR heterodimer in noncovalent association with three invariant CD3 dimers. The TCR is responsible for recognizing antigenic peptides bound to MHC molecules (pMHC), while the CD3 dimers relay activation signals to the T cell. However, the mechanisms by which TCR engagement by pMHC is transmitted to CD3 remain mysterious, although there is growing evidence that mechanosensing and allostery both play a role. Here, we carried out NMR analysis of a human autoimmune TCR (MS2-3C8) that recognizes a self-peptide from myelin basic protein presented by the MHC class II molecule HLA-DR4. We observed pMHC-induced NMR signal perturbations in MS2-3C8 that indicate long-range effects on TCR β chain conformation and dynamics. Our results demonstrate that, in addition to expected changes in the NMR resonances of pMHC-contacting residues, perturbations extend to the Vβ/Vα, Vβ/Cβ, and Cβ/Cα interfacial regions. Moreover, the pattern of long-range perturbations is similar to that detected previously in the β chains of two MHC class I-restricted TCRs, thereby revealing a common allosteric pathway among three unrelated TCRs. Molecular dynamics (MD) simulations predict similar pMHC-induced effects. Taken together, our results demonstrate that pMHC binding induces long-range allosteric changes in the TCR β chain at conserved sites in both representative MHC class I- and class II-restricted TCRs, and that these sites may play a role in the transmission of signaling information.
Keywords: Allostery; NMR; T cell receptor; T cell triggering; peptide–MHC.
Copyright © 2020 Elsevier Ltd. All rights reserved.
Conflict of interest statement
Declaration of Competing Interest The authors declare that they have no known competing financial interests or personal relationships that could have appeared to influence the work reported in this paper.
Figures
Similar articles
-
Peptide-MHC (pMHC) binding to a human antiviral T cell receptor induces long-range allosteric communication between pMHC- and CD3-binding sites.J Biol Chem. 2018 Oct 12;293(41):15991-16005. doi: 10.1074/jbc.RA118.003832. Epub 2018 Aug 22. J Biol Chem. 2018. PMID: 30135211 Free PMC article.
-
Geometrical characterization of T cell receptor binding modes reveals class-specific binding to maximize access to antigen.Proteins. 2020 Mar;88(3):503-513. doi: 10.1002/prot.25829. Epub 2019 Oct 21. Proteins. 2020. PMID: 31589793 Free PMC article.
-
Structure of a complex of the human alpha/beta T cell receptor (TCR) HA1.7, influenza hemagglutinin peptide, and major histocompatibility complex class II molecule, HLA-DR4 (DRA*0101 and DRB1*0401): insight into TCR cross-restriction and alloreactivity.J Exp Med. 2002 Mar 4;195(5):571-81. doi: 10.1084/jem.20011194. J Exp Med. 2002. PMID: 11877480 Free PMC article.
-
A structural voyage toward an understanding of the MHC-I-restricted immune response: lessons learned and much to be learned.Immunol Rev. 2012 Nov;250(1):61-81. doi: 10.1111/j.1600-065X.2012.01159.x. Immunol Rev. 2012. PMID: 23046123 Review.
-
The structural basis of T-cell receptor (TCR) activation: An enduring enigma.J Biol Chem. 2020 Jan 24;295(4):914-925. doi: 10.1074/jbc.REV119.009411. Epub 2019 Dec 17. J Biol Chem. 2020. PMID: 31848223 Free PMC article. Review.
Cited by
-
The Energetic Landscape of Catch Bonds in TCR Interfaces.J Immunol. 2023 Aug 1;211(3):325-332. doi: 10.4049/jimmunol.2300121. J Immunol. 2023. PMID: 37459192 Free PMC article. Review.
-
Evaluation of Molecular Simulations and Deep Learning Prediction of Antibodies' Recognition of TRBC1 and TRBC2.Antibodies (Basel). 2023 Sep 17;12(3):58. doi: 10.3390/antib12030058. Antibodies (Basel). 2023. PMID: 37753972 Free PMC article.
-
Limits on inferring T cell specificity from partial information.Proc Natl Acad Sci U S A. 2024 Oct 15;121(42):e2408696121. doi: 10.1073/pnas.2408696121. Epub 2024 Oct 7. Proc Natl Acad Sci U S A. 2024. PMID: 39374400 Free PMC article.
-
Allosteric activation of T cell antigen receptor signaling by quaternary structure relaxation.Cell Rep. 2021 Jul 13;36(2):109375. doi: 10.1016/j.celrep.2021.109375. Cell Rep. 2021. PMID: 34260912 Free PMC article.
-
Molecular dynamics simulations reveal membrane lipid interactions of the full-length lymphocyte specific kinase (Lck).Sci Rep. 2022 Dec 7;12(1):21121. doi: 10.1038/s41598-022-25603-6. Sci Rep. 2022. PMID: 36476673 Free PMC article.
References
-
- Dong D, Zheng L, Lin J, Zhang B, Zhu Y, Li N, Xie S, Wang Y, Gao N, & Huang Z. (2019). Structural basis of assembly of the human T cell receptor-CD3 complex. Nature 573, 546–552. - PubMed
-
- Guo X, Yan C, Li H, Huang W, Shi X, Huang M, Wang Y, Pan W, Cai M, Li L, Wu W, Bai Y, Zhang C, Liu Z, Wang X, Zhang XF, Tang C, Wang H, Liu W, Ouyang B, Wong CC, Cao Y, & Xu C. (2017). Lipid-dependent conformational dynamics underlie the functional versatility of T-cell receptor. Cell Res. 27, 505–525. - PMC - PubMed
Publication types
MeSH terms
Substances
Grants and funding
LinkOut - more resources
Full Text Sources
Research Materials
