Review
. 2021 Jan:335:113523.
doi: 10.1016/j.expneurol.2020.113523. Epub 2020 Nov 4.

Genes causing congenital hydrocephalus: Their chromosomal characteristics of telomere proximity and DNA compositions

Affiliations
Review

Genes causing congenital hydrocephalus: Their chromosomal characteristics of telomere proximity and DNA compositions

Ian McKnight et al. Exp Neurol. 2021 Jan.

Abstract

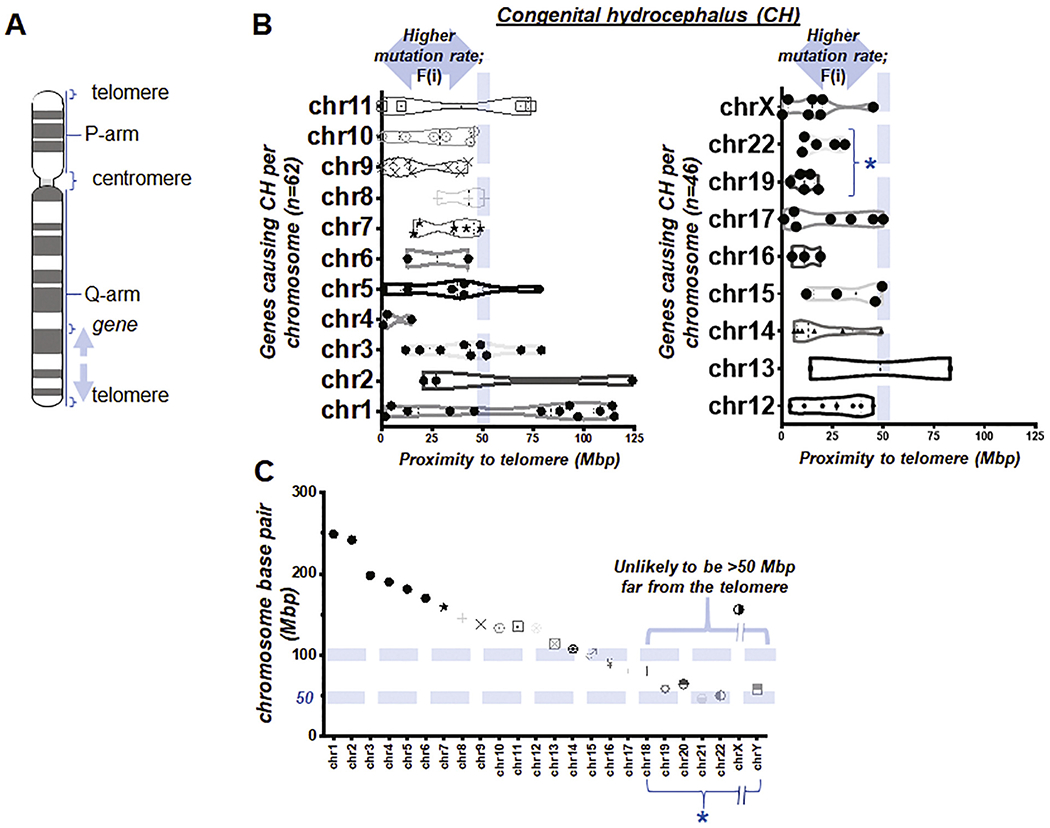
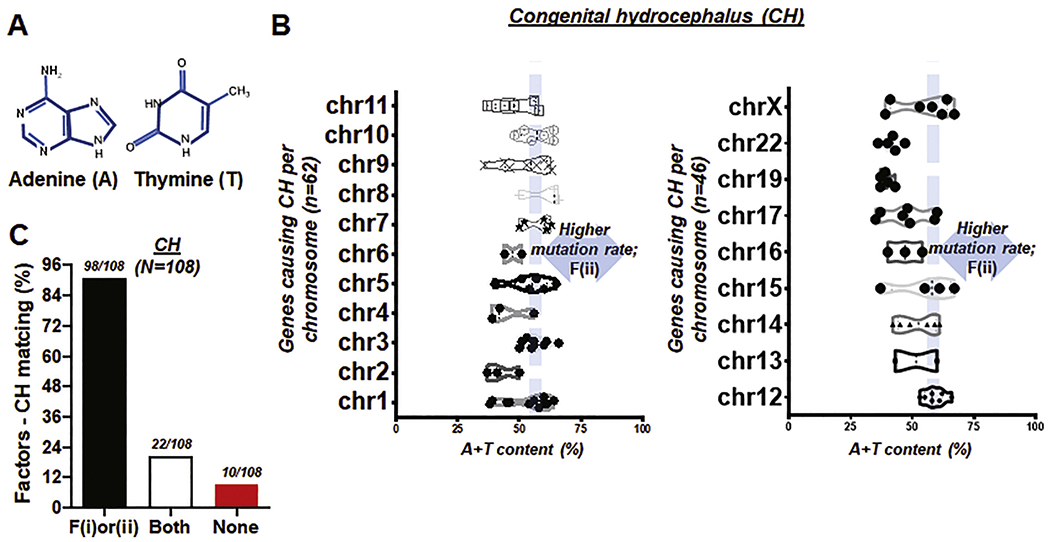
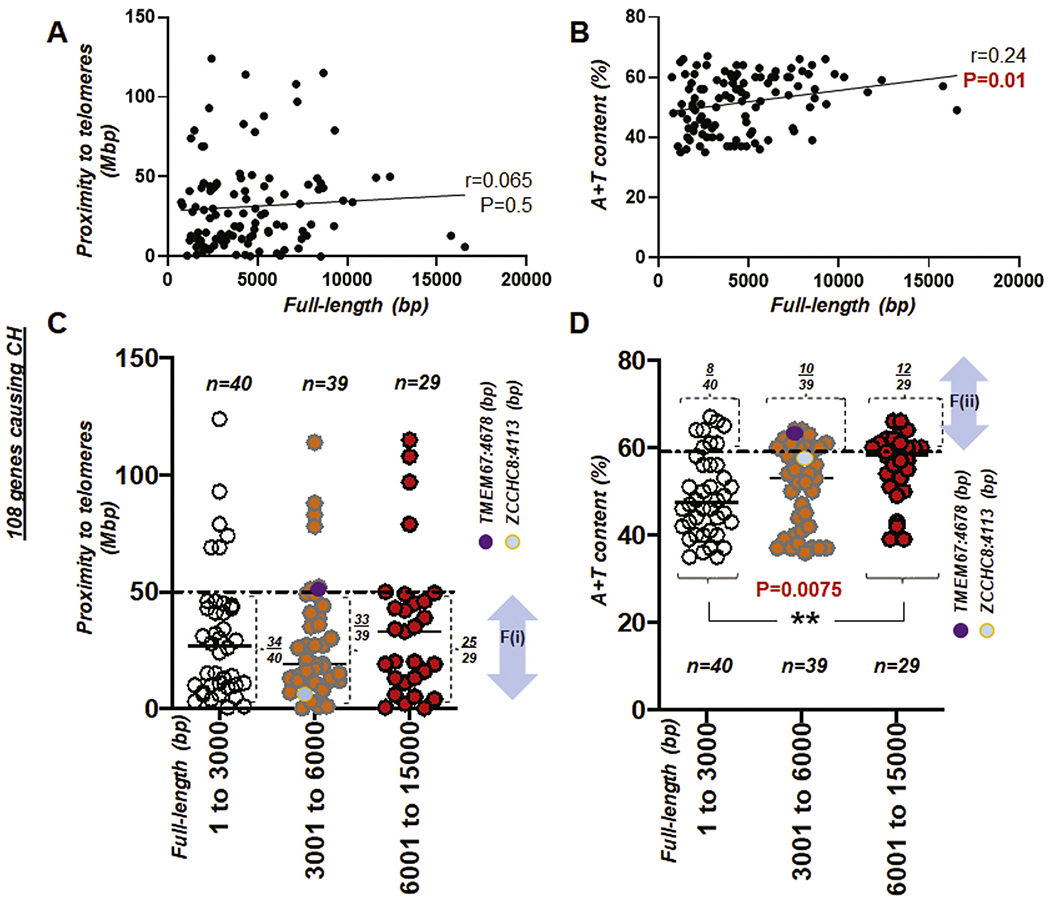
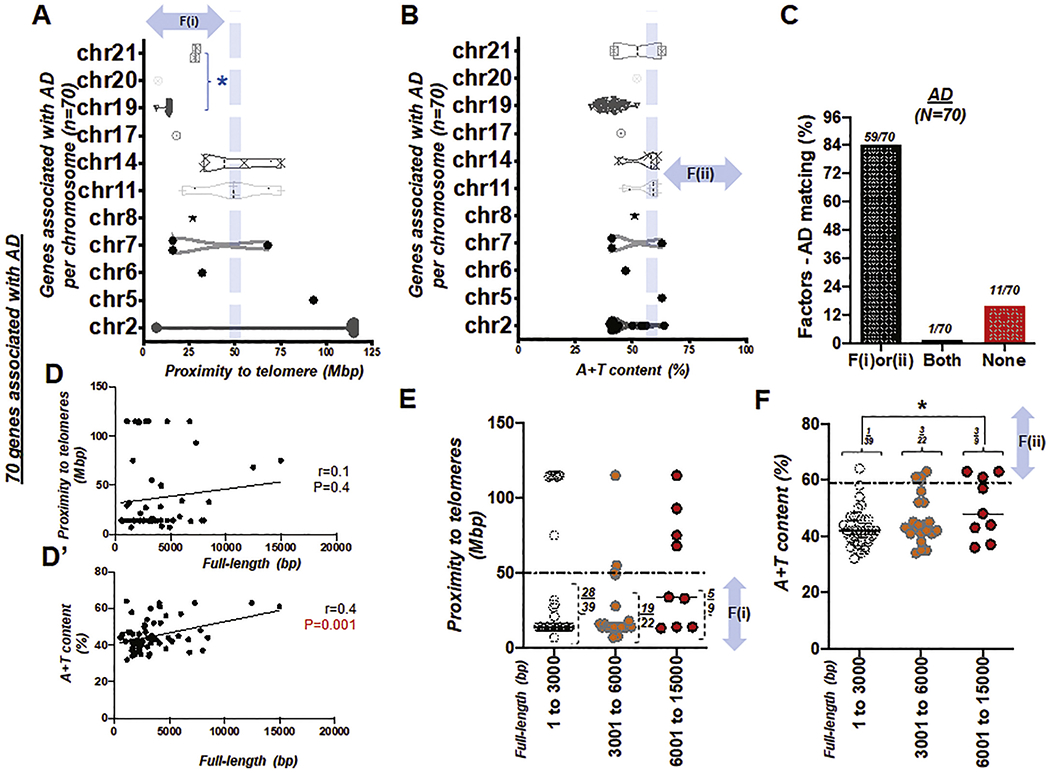
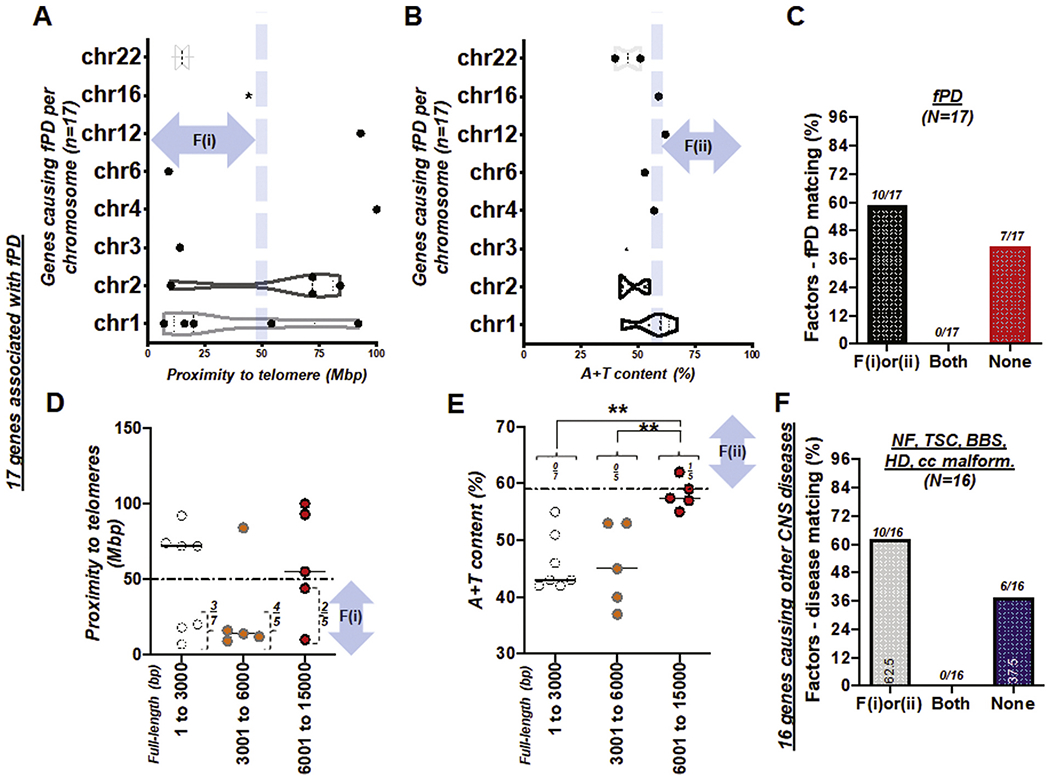
Congenital hydrocephalus (CH) is caused by genetic mutations, but whether factors impacting human genetic mutations are disease-specific remains elusive. Given two factors associated with high mutation rates, we reviewed how many disease-susceptible genes match with (i) proximity to telomeres or (ii) high adenine and thymine (A + T) content in human CH as compared to other disorders of the central nervous system (CNS). We extracted genomic information using a genome data viewer. Importantly, 98 of 108 genes causing CH satisfied (i) or (ii), resulting in >90% matching rate. However, such a high accordance no longer sustained as we checked two factors in Alzheimer's disease (AD) and/or familial Parkinson's disease (fPD), resulting in 84% and 59% matching, respectively. A disease-specific matching of telomere proximity or high A + T content predicts causative genes of CH much better than neurodegenerative diseases and other CNS conditions, likely due to sufficient number of known causative genes (n = 108) and precise determination and classification of the genotype and phenotype. Our analysis suggests a need for identifying genetic basis of both factors before human clinical studies, to prioritize putative genes found in preclinical models into the likely (meeting at least one) and more likely candidate (meeting both), which predisposes human genes to mutations.

Keywords: Alzheimer's disease; A + T content, mutation; Chromosome, homologous recombination, familial Parkinson's disease; Congenital hydrocephalus; Telomeres.


Conflict of interest statement

Conflict of interest

The authors declare no competing financial interests.

Figures

Fig. 1.
Fig. 1.. Classification of pediatric hydrocephalus
(A) Diagram summarizing sub-classification of hydrocephalus in children into post-hemorrhagic hydrocephalus (PHH) and not-PHH group involving diagnosis such as spina bifida (23%), myelomeningocele (MM; 13%), encephalocele (3%) and other conditions. Secondary causes such as hemorrhage leading to post-hemorrhagic hydrocephalus (PHH) accounted for fewer than one in three cases (26%). Collectively, 71% patients at age 0–26 years (n = 31) were diagnosed as hydrocephalus other than PHH (Not PHH). (B) Summary showing the gist of diagnosis for younger (upper) and older (lower) age group. (C) Sex was evenly distributed within control (n = 35) and hydrocephalus group (n = 31). However, when hydrocephalus group was sub-divided into two, female-male ratio became not even in Not PHH and PHH group (age 0–26 years). Single center study (Shim et al., 2013).
Fig. 2.
Fig. 2.. Proximity to telomeres in genes known to cause CH
(A) Illustration simplified to indicate relative positions of telomeres, centromere, each arm, and a gene in a human chromosome (Nusbaum et al., 2006). Arrows indicate a distance between the gene and a telomere. (B) Box and violin plots showing the full distribution of the gene proximity to its telomere over chromosome (chr) 1 to 11 (left) and 12 to X (right). F(i) and * indicate ‘the first factor or proximity to telomeres’ and ‘the group of chromosomes unlikely to be >50 Mbp distant from the telomere due to their short physical size (Morton, 1991)’ (C) Length of all human chromosomes reported previously (Morton, 1991). * indicates the same in (B).
Fig. 3.
Fig. 3.. A + T content of genes and factors-CH matching rate
(A) Illustration showing two of four chemical bases comprising DNA, adenine (A) and thymine (T) whose combined content is associated with high mutation rate in human chromosomes (Nusbaum et al., 2006). (B) Box and violin plots showing the full distribution of A + T content over chromosome (chr) 1 to 11 (left) and 12 to X (right). F(ii) indicates ‘the second factor or A+T content’ (C) Bar graph demonstrating factors-CH matching rate. ‘F(i)or(ii)’ represents the genes causing CH satisfying either proximity to telomeres within 50 Mbp or A + T content higher than 59%; ‘Both’ represents the genes meeting two factors alike. Total number of genes, N = 108. Matching rate at >90%.
Fig. 4.
Fig. 4.. Proximity to telomere and A + T content over gene length (bp)
(A) Scattered plot showing the Pearson correlation between the full length (bp) of genes causing CH and proximity to telomeres. (B) Scattered plot showing the Pearson correlation between the full length (bp) of genes causing CH and A + T content. r: Pearson coefficient (A-B). (C) Scattered plot showing 108 genes causing CH with proximity to telomeres over full-length size of the gene (bp). A horizontal dotted line indicates 50 Mbp. (D) Scattered plot summarizing 108 genes causing CH with A + T content over full-length size of the gene (bp). A horizontal dotted line indicates A + T content at 59%. F(i) and F(ii) indicate the first and second factor, respectively. Note that circles in purple and light blue indicate TMEM67 and ZCCHC8 gene in (C) and (D). **, P < 0.01.
Fig. 5.
Fig. 5.. Genes associated with Alzheimer’s disease (AD), satisfying either proximity to telomeres or high A + T content
(A) Box and violin plots showing the full distribution of the gene proximity to its telomere over chromosome (chr) 1 to 21. An asterisk in blue, *, indicates ‘the group of chromosomes unlikely to be >50 Mbp distant from the telomere due to their short physical size (Morton, 1991)’ (B) Box and violin plots showing the full distribution of A + T content over chromosome (chr) 1 to 21. (C) Bar graph demonstrating factors-AD matching rate. Total number of genes, N = 70. Success (matching) rate at 84%. (D) Scattered plot showing the Pearson correlation between the full length (bp) of genes associated with AD and proximity to telomeres. (D’) Scattered plot showing the Pearson correlation between the full length (bp) of genes associated with AD and A + T content, r: Pearson coefficient (D-D’). (E) Scattered plot showing 70 genes of AD with proximity to telomeres over full-length size of the gene (bp). A horizontal dotted line indicates 50 Mbp. (F) Scattered plot summarizing 70 genes of AD with A + T content over full-length size of the gene (bp). A horizontal dotted line indicates A + T content at 59%. F(i) and F(ii) indicate the first and second factor, respectively. An asterisk in black, *, P < 0.05.
Fig. 6.
Fig. 6.. Genes causing fPD and other genetic diseases of the CNS
(A) Box and violin plots showing the full distribution of the gene proximity to its telomere over chromosome (chr) 1 to 22. (B) Box and violin plots showing the full distribution of A + T content over chromosome (chr) 1 to 22. fPD: familial Parkinson’s disease (A and B). (C) Bar graph demonstrating factors-fPD matching rate. Total number of genes, N = 17. Success (matching) rate at 59%. See also Table S6. (D) Scattered plot showing 17 genes causing fPD with proximity to telomeres over full-length size of the gene (bp). A horizontal dotted line indicates 50 Mbp. (E) Scattered plot summarizing 17 genes causing fPD with A + T content over full-length size of the gene (bp). A horizontal dotted line indicates A + T content at 59%. F(i) and F(ii) indicate the first and second factor, respectively. **, P < 0.01 (F) Bar graph demonstrating the factor-other diseases of the CNS matching rate. Total number of genes, N = 16. NF; neurofibromatosis (n = 2); TSC; tuberous sclerosis disease (n = 2); BBS (n = 5); HD (n = 1); CNS malformations involving agenesis of corpus callosum (cc; n = 6). Success (matching) rate at ~60%. See also Table S7.

Similar articles

Cited by

References

    1. Abdelhamed ZA, Natarajan S, Wheway G, Inglehearn CF, Toomes C, Johnson CA, Jagger DJ, 2015. The Meckel-Gruber syndrome protein TMEM67 controls basal body positioning and epithelial branching morphogenesis in mice via the non-canonical Wnt pathway. Dis. Model. Mech 8, 527–541. - PMC - PubMed
    1. Alazami AM, Maddirevula S, Seidahmed MZ, Albhlal LA, Alkuraya FS, 2019. A novel ISLR2-linked autosomal recessive syndrome of congenital hydrocephalus, arthrogryposis and abdominal distension. Hum. Genet 138, 105–107. - PubMed
    1. Albright AL, Ferson S, Carlos S, 2005. Occult hydrocephalus in children with cerebral palsy. Neurosurgery 56, 93–96 (discussion 96-97). - PubMed
    1. Alby C, Piquand K, Huber C, Megarbane A, Ichkou A, Legendre M, Pelluard F, Encha-Ravazi F, Abi-Tayeh G, Bessieres B, El Chehadeh-Djebbar S, Laurent N, Faivre L, Sztriha L, Zombor M, Szabo H, Failler M, Garfa-Traore M, Bole C, Nitschke P, Nizon M, Elkhartoufi N, Clerget-Darpoux F, Munnich A, Lyonnet S, Vekemans M, Saunier S, Cormier-Daire V, Attie-Bitach T, Thomas S, 2015. Mutations in KIAA0586 Cause Lethal Ciliopathies Ranging from a Hydrolethalus Phenotype to Short-Rib Polydactyly Syndrome. Am J Hum Genet 97, 311–318. - PMC - PubMed
    1. Anderegg L, Im Hof Gut M, Hetzel U, Howerth EW, Leuthard F, Kyostila K, Lohi H, Pettitt L, Mellersh C, Minor KM, Mickelson JR, Batcher K, Bannasch D, Jagannathan V, Leeb T, 2019. NME5 frameshift variant in Alaskan Malamutes with primary ciliary dyskinesia. PLoS Genet 15, e1008378. - PMC - PubMed

Publication types