Review
. 2020 Nov 4;10(11):2198.
doi: 10.3390/nano10112198.

A Review on New 3-D Printed Materials' Geometries for Catalysis and Adsorption: Paradigms from Reforming Reactions and CO2 Capture

Affiliations
Review

A Review on New 3-D Printed Materials' Geometries for Catalysis and Adsorption: Paradigms from Reforming Reactions and CO2 Capture

Ahmad Soliman et al. Nanomaterials (Basel). .

Abstract

"Bottom-up" additive manufacturing (AM) is the technology whereby a digitally designed structure is built layer-by-layer, i.e., differently than by traditional manufacturing techniques based on subtractive manufacturing. AM, as exemplified by 3D printing, has gained significant importance for scientists, among others, in the fields of catalysis and separation. Undoubtedly, it constitutes an enabling pathway by which new complex, promising and innovative structures can be built. According to recent studies, 3D printing technologies have been utilized in enhancing the heat, mass transfer, adsorption capacity and surface area in CO2 adsorption and separation applications and catalytic reactions. However, intense work is needed in the field to address further challenges in dealing with the materials and metrological features of the structures involved. Although few studies have been performed, the promise is there for future research to decrease carbon emissions and footprint. This review provides an overview on how AM is linked to the chemistry of catalysis and separation with particular emphasis on reforming reactions and carbon adsorption and how efficient it could be in enhancing their performance.

Keywords: 3D printing; CO2 capture; additive manufacturing; adsorbents; carbon dioxide; catalysts; reforming.


Conflict of interest statement

The authors declare no conflict of interest.

Figures

Figure 1
Figure 1
Infographic materials and 3D printing technology mapping [33,34,35,36,37,38,39,40,41,42,43,44,45,46,47,48,49,50,51,52,59,60,61,62,63,64,65,66,67].
Figure 2
Figure 2
(A) Robocasting. (B) Fused deposition modeling. Stereolithography by (C) selective photo resin solidification is based on scanning a laser over the surface, or (D) by projecting an entire slice. Powder bed 3D printing methods by (E) 3D printing via binder deposition on a powder bed or (F) 3D printing via selective sintering on a powder bed. Reproduced with permission from [72]. Copyright The Royal Society of Chemistry, 2018.
Figure 3
Figure 3
(a) Mass and linear dimensional changes for oxide and metal-derived structures made of iron and nickel. Due to the loss of oxygen after oxide reduction, oxide-derived samples have greater changes in mass and dimensions than their metal-derived counterparts [82]. (b,f) Samples derived from Fe2O3 particle-based inks. (c,g) Samples derived from Fe particle-based inks. (d,h) Samples derived from NiO particle-based inks. (e,i) Samples derived from Ni-particle-based inks. Scale bars at 2 mm. Reproduced with permission from [117]. Copyright Wiley-VCH, 2016.
Figure 4
Figure 4
Schematic representation 3D printed AI preparation for water treatment. (a) Pristine PAI; (b) E-PAI (metal ions removal); (c) Fenton reaction catalyzer O-PAI [124,126]. Reproduced with permission from [124], Copyright Royal Society of Chemistry, 2013; [126], Copyright Wiley-VCH, 2018.
Figure 5
Figure 5
(a) SiO2 wood pile structure. SiO2 sintered structure scanning electron microscopy (SEM) images: (b) Top-view, (c) side-view and (d) X-ray diffraction XRD pattern. Optical images of the 3D-SiO2-APTS-Cu structure: (e) in the Kimble reactor, (f) top-view, (g) high-magnification top-view and (h) EDS spectrum. Optical images of 3D-SiO2-AAPTS-Pd structure: (i) in the Kimble reactor, (j) top-view, (k) high-magnification top-view and (l) EDS spectrum. Reproduced with permission from [128]. Copyright American Chemical Society, 2017.
Figure 6
Figure 6
(a) Co-self-catalytic reactor (SCR)-1; (b) longitudinal section of Co-SCR-1; (c) cross-section of Co-SCR-1; (d) cross-section of Co-SCR-2; (e) cross-section of Co-SCR-3; (f) cross-section of Co-SCR-4; (g) cross-section of Co-SCR; (h) cross-section of Co-SCR-5; (i) cross-section of Co-SCR-6. Reproduced with permission from [130]. Copyright Nature, 2020.
Figure 7
Figure 7
(a) The physical SCRs after polishing the outer surface. (b) Fe-SCR for F–T synthesis. (c) Fe-SCR for CO2 hydrogenation. (d) Co-SCR for F–T synthesis. (e), Ni-SCR for CO2/CH4 (dry reforming). Reproduced with permission from [130]. Copyright Nature, 2020.
Figure 8
Figure 8
The four Ms (4Ms) of AM: materials, making, metrology and market. Reproduced with permission from [154]. Copyright Elsevier, 2017.
Figure 9
Figure 9
Schematic of the relative suitability of AM for three major types of materials (polymers, ceramics and metals) in various feed forms and states using ASTM processes: binder jetting (BJ); directed energy deposition (DED); material extrusion (ME); (4) material jetting (MJ); powder bed fusion (PBF); sheet lamination (SL); and vat photopolymerization (VP). Reproduced with permission from [154]. Copyright Elsevier, 2017.
Figure 10
Figure 10
Energy used, speed and resolution of fabrication in different AM techniques. Reproduced with permission from [154]. Copyright Elsevier, 2017.
Figure 11
Figure 11
(A) Different TPMS topologies used as solid sheet reinforcement phases in IPC: (a) a single unit cell, (b) a 3 × 3 × 3 patterning of the TPMS, (c) the designed IPC, (d) a (111) plan cut to reveal the interconnectivity of the TPMS and (e) a sample fabricated using 3D printing. (B) TPMS-IWP vs. the idealized IWP. Reproduced with permission from [167]. Copyright Wiley-VCH, 2016.
Figure 12
Figure 12
(A) Illustration of sheet-based TPMS and strut-based TPMS structures with different unit cell sizes (L) and macroporosities (Φ). (B) Primitive sheets, (C) gyroid sheets, (D) crossed layers of parallel (CLP) sheets, (E) gyroid struts and (F) primitive struts. Reproduced with permission from [168]. Copyright The American Ceramic Society, 2019.
Figure 13
Figure 13
Pressure drop test according to the experiment design for (A) sheet-based substrates and (B) strut-based substrates for primitive, gyroid and CLP Structures. Reproduced with permission from [168]. Copyright The American Ceramic Society, 2019.
Figure 14
Figure 14
(A,B) N2 physisorption isotherms for 13X, pore size distribution of monoliths and powder zeolites. The pore size distribution was derived from the density functional theory (DFT) method, using the desorption branch of the N2 isotherm [65]. (C) XRD pattern for monolith R4 which includes 90 wt.% zeolites and powder analogue. (D) 3D printed monoliths from adsorbent material using robocasting technique. Reproduced with permission from [65]. Copyright American Chemical Society, 2016.
Figure 15
Figure 15
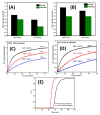
(A) CO2 adsorption capacities for 3D-printed monoliths and zeolite powders obtained at 25 °C using 0.3% and 0.5% CO2 in N2. (B) Breakthrough curves for 13X-R4 and 3D-printed monoliths and zeolite powders obtained at 25 °C and 1 bar. Reproduced with permission from [65]. Copyright American Chemical Society, 2016.
Figure 16
Figure 16
XRD patterns for 3D-printed (A) MOF-74(Ni) and UTSA-16(Co) monoliths with their powder counterparts. Nitrogen physisorption isotherms and pore size distribution curves for 3D-printed MOF monoliths: (B) MOF-74(Ni) and (C) UTSA-16(Co) and their corresponding powders. (D) SEM images of 3D-printed (a−c) MOF-74(Ni) and (d–f) UTSA-16(Co) monoliths. Reproduced with permission from [62]. Copyright American Chemical Society, 2017.
Figure 17
Figure 17
(A,B) CO2 capacities of 3D-printed MOF monoliths and corresponding powders under (A) 3000 and (B) 5000 ppm CO2/N2 at 25 °C and 1 bar [62]. (C,D) CO2 adsorption isotherms of 3D-printed (C) MOF-74(Ni) and (D) UTSA-16(Co) monoliths at 25, 50, and 75 °C. Symbols show the experimental data, and solid lines represent the fitted isotherms with the average relative error (ARE). (E) Breakthrough profiles of the 3D-printed UTSA-16(Co) monolith and its corresponding powder using 5000 ppm CO2/N2 at 25 °C. Reproduced with permission from [62]. Copyright American Chemical Society, 2017.
Figure 18
Figure 18
3D printed Cu/Al2O3 catalyst. (a,b) Optical images of the Cu/Al2O3 structure without sintering. (c,d) Optical images of the sintered Cu/Al2O3. (e) Schematic illustration and image of the experimental setup used for the catalytic tests. (fh) SEM images of sintered woodpile structure fabricated from a concentrated Cu/Al2O3 ink deposited through a 410 μm nozzle. Reproduced with permission [114]. Reproduced with permission from [114]. Copyright Elsevier, 2015.
Figure 19
Figure 19
A cell of the designed porous structure with two different crystal structures, Body Centered Cubic (BCC) and Face Centered Cubic (FCC). For the porous cell of BCC Ht represents the edge length of the cube structure model, as shown in (a). Moreover, Dt1 indicates the diameter of the atom at the center of the BCCS. Dt2 represents the diameter of eight atoms at the apex angle. Dtmi indicates the diameter of the interconnected hole. Furthermore, for the porous cell of FCCs, Hm represents the edge length of the cube structure model, as shown in (b). Dm1 indicates the diameter of atoms in the center of the FCCs. Dm2 represents the diameter of eight atoms at the apex angle. Dmmi indicates the diameter of the interconnected hole [181]. Reproduced with permission from [181]. Copyright Elsevier, 2020.
Figure 20
Figure 20
(a) Catalyst loading strength measurement starts by blowing dry air onto the loaded support and ends with weighing it to measure the weight difference. (b) Illustration of plate microreactor for methanol SR for hydrogen production. Reproduced with permission from [181]. Copyright Elsevier, 2020.
Figure 21
Figure 21
Optical image and SEM micrograph of 3D-printed porous stainless-steel supports with different crystal structures. (a) BCCs (b) FCCs. Reproduced with permission from [181]. Copyright Elsevier, 2020.
Figure 22
Figure 22
Reaction performances of microreactors with different 3D-printed porous stainless-steel supports for hydrogen production. (a) Methanol conversion. (b) H2 flow rate under different injection velocities. (c) Methanol conversion. (d) H2 flow rate under different reaction temperatures. Reproduced with permission from [181]. Copyright Elsevier, 2020.
Figure 23
Figure 23
(A) Circular, square and biomimetic internal structure proposals. (B) Square-hole monolith with 35 mm diameter. (C) Heating of acrylonitrile butadiene styrene (ABS) catalyst substrates. (D) Different cross-sectional design for channels with substrate: (a) solid; (b) solid with gap; (c) squares; (d) squares with gap. Reproduced with permission from [119]. Copyright Nature, 2017.

References

    1. Hannah Ritchie M.R. CO2 and Greenhouse Gas Emissions. [(accessed on 2 August 2020)];2017 Available online: https://ourworldindata.org/co2-and-other-greenhouse-gas-emissions.
    1. Hertwich E. The Carbon Footprint of Material Production Rises to 23% of Global Greenhouse Gas Emissions. SocArXiv. 2019 doi: 10.31235/osf.io/n9ecw. - DOI
    1. Kontos A.G., Likodimos V., Veziri C.M., Kouvelos E., Moustakas N., Karanikolos G.N., Romanos G.E., Falaras P. CO2 Captured in Zeolitic Imidazolate Frameworks: Raman Spectroscopic Analysis of Uptake and Host-Guest Interactions. ChemSusChem. 2014;7:1696–1702. doi: 10.1002/cssc.201301323. - DOI - PubMed
    1. Department of the Environment and Heritage Sulfur Dioxide (SO2), Air Quality Fact Sheet. [(accessed on 2 August 2020)];2005 Available online: https://www.environment.gov.au/protection/publications/factsheet-sulfur-....
    1. Talapaneni S.N., Buyukcakir O., Je S.H., Srinivasan S., Seo Y., Polychronopoulou K., Coskun A. Nanoporous Polymers Incorporating Sterically Confined N-Heterocyclic Carbenes for Simultaneous CO2 Capture and Conversion at Ambient Pressure. Chem. Mater. 2015;27:6818–6826. doi: 10.1021/acs.chemmater.5b03104. - DOI

LinkOut - more resources