

Rapid growth of an intact human liver transplanted into a recipient larger than the donor
- PMID: 3315827
- PMCID: PMC3004220
- DOI: 10.1016/0016-5085(87)90274-5
Rapid growth of an intact human liver transplanted into a recipient larger than the donor
Abstract
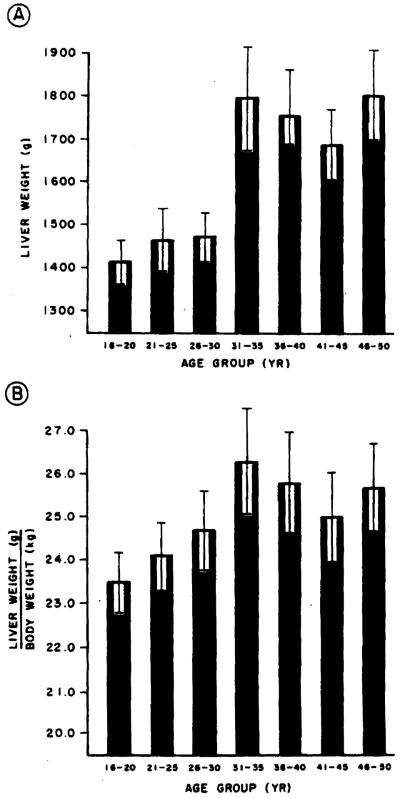
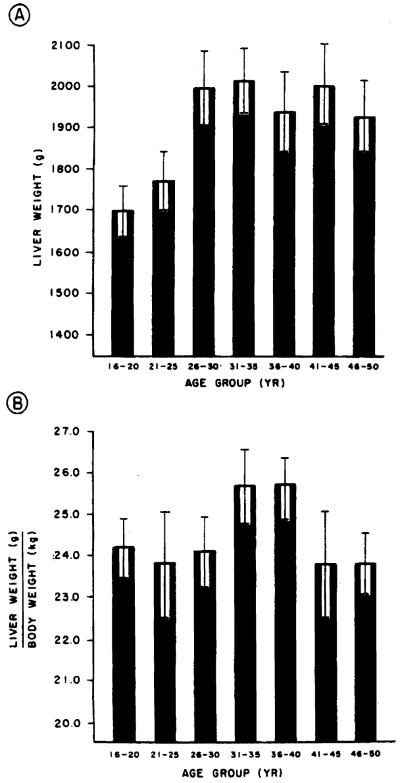
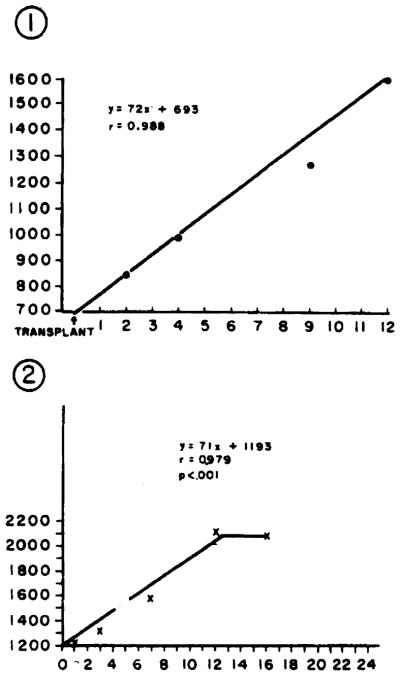
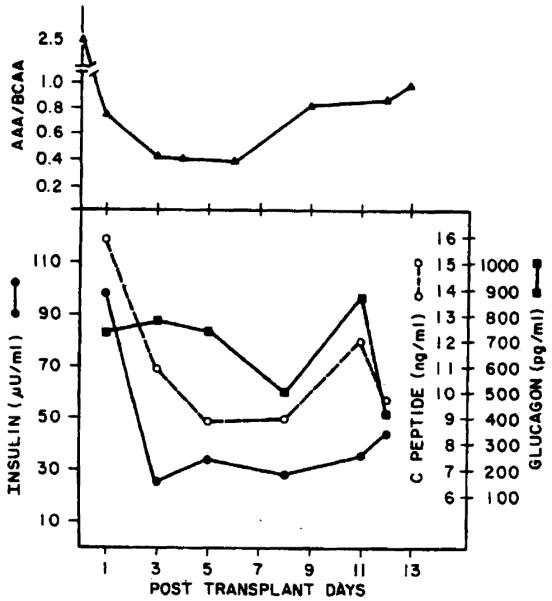
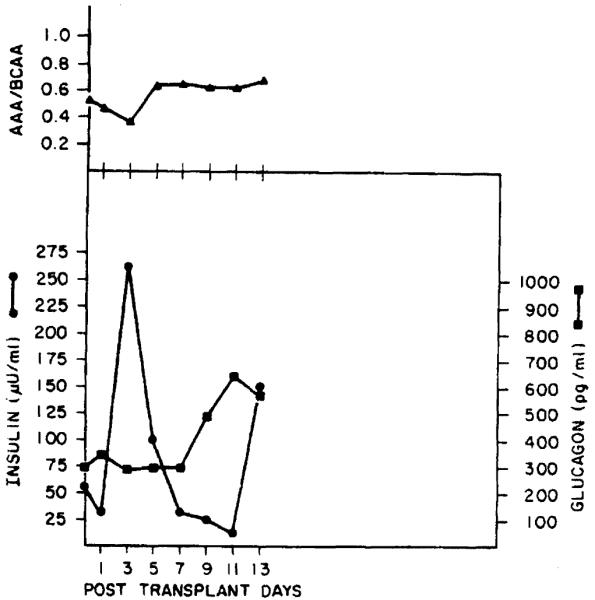
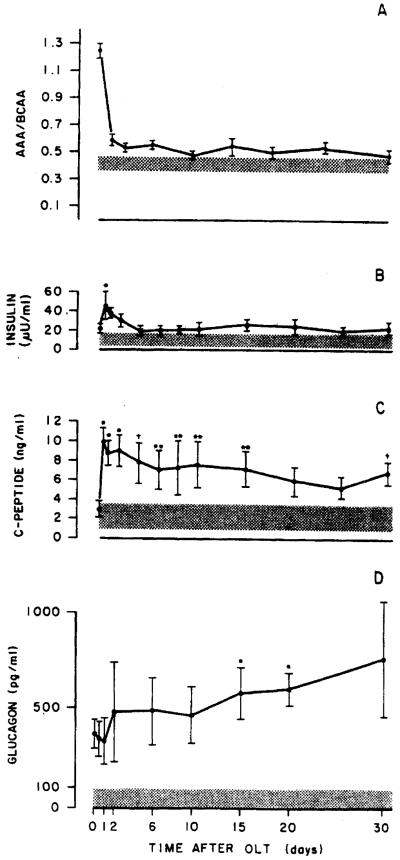
Two individuals undergoing orthotopic hepatic transplantation received livers from donors who were on average 10 kg smaller than themselves based on recipient ideal body weight. As a result, the donor livers in these 2 cases were 29%-59% smaller than would be expected had the donor liver and recipient been matched ideally. The liver grafts in the recipients steadily increased in size, as determined by serial computed tomography scanning, to achieve new volumes consistent with those that would have been expected in a normal individual of the recipient's size, sex, and age. Fasting plasma levels of amino acids, glucagon, insulin, and standard liver injury tests were monitored to determine which measure best reflected the changes observed in the size of the grafts over time. No relationship between the changes observed in any of these parameters and hepatic growth was apparent. In both cases, the liver increased in volume at a rate of approximately 70 ml/day. These data demonstrate that a small-for-size liver transplanted into a larger recipient increases in size at a rate of approximately 70 ml/day until it achieves a liver volume consistent with that expected given the recipient's size, age, and sex.
Figures
Similar articles
-
[Analysis of fifty adult to adult living donor liver transplantation].Sichuan Da Xue Xue Bao Yi Xue Ban. 2007 Jun;38(3):513-7. Sichuan Da Xue Xue Bao Yi Xue Ban. 2007. PMID: 17593845 Chinese.
-
Liver regeneration in recipients and donors after transplantation.Lancet. 1992 Mar 7;339(8793):580-1. doi: 10.1016/0140-6736(92)90867-3. Lancet. 1992. PMID: 1347095
-
Liver regeneration after living donor transplantation: adult-to-adult living donor liver transplantation cohort study.Liver Transpl. 2015 Jan;21(1):79-88. doi: 10.1002/lt.23966. Epub 2014 Oct 6. Liver Transpl. 2015. PMID: 25065488 Free PMC article.
-
Size mismatch in liver transplantation.J Hepatobiliary Pancreat Sci. 2016 Aug;23(8):457-66. doi: 10.1002/jhbp.371. Epub 2016 Jul 28. J Hepatobiliary Pancreat Sci. 2016. PMID: 27474079 Review.
-
Small-for-size syndrome in living donor liver transplantation.Hepatobiliary Pancreat Dis Int. 2012 Dec 15;11(6):570-6. doi: 10.1016/s1499-3872(12)60227-6. Hepatobiliary Pancreat Dis Int. 2012. PMID: 23232627 Review.
Cited by
-
Hepatic hyperplasia associated with discordant xenogeneic parenchymal-nonparenchymal interactions in human hepatocyte-repopulated mice.Am J Pathol. 2010 Aug;177(2):654-65. doi: 10.2353/ajpath.2010.090430. Epub 2010 Jun 3. Am J Pathol. 2010. PMID: 20522646 Free PMC article.
-
The role of cells refractory to productive infection in acute hepatitis B viral dynamics.Proc Natl Acad Sci U S A. 2007 Mar 20;104(12):5050-5. doi: 10.1073/pnas.0603626104. Epub 2007 Mar 14. Proc Natl Acad Sci U S A. 2007. PMID: 17360406 Free PMC article.
-
Liver Regeneration: Changes in Oxidative Stress, Immune System, Cytokines, and Epigenetic Modifications Associated with Aging.Oxid Med Cell Longev. 2022 Jul 28;2022:9018811. doi: 10.1155/2022/9018811. eCollection 2022. Oxid Med Cell Longev. 2022. PMID: 35936214 Free PMC article. Review.
-
Small-for-size liver transplanted into larger recipient: a model of hepatic regeneration.Hepatology. 1994 Jan;19(1):210-6. Hepatology. 1994. PMID: 8276357 Free PMC article.
-
Role of the Hippo pathway in liver regeneration and repair: recent advances.Inflamm Regen. 2022 Dec 5;42(1):59. doi: 10.1186/s41232-022-00235-5. Inflamm Regen. 2022. PMID: 36471376 Free PMC article. Review.
References
Publication types
MeSH terms
Grants and funding
LinkOut - more resources
Full Text Sources
Medical
Research Materials
