Review
. 2020 Nov 4;20(21):6289.
doi: 10.3390/s20216289.

Optical Biosensors for the Detection of Rheumatoid Arthritis (RA) Biomarkers: A Comprehensive Review

Affiliations
Review

Optical Biosensors for the Detection of Rheumatoid Arthritis (RA) Biomarkers: A Comprehensive Review

José Javier Imas et al. Sensors (Basel). .

Abstract

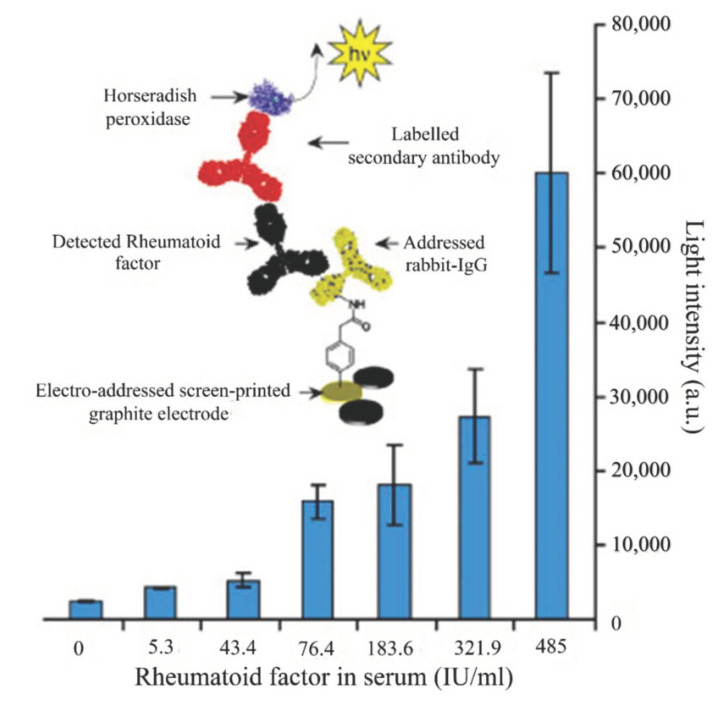
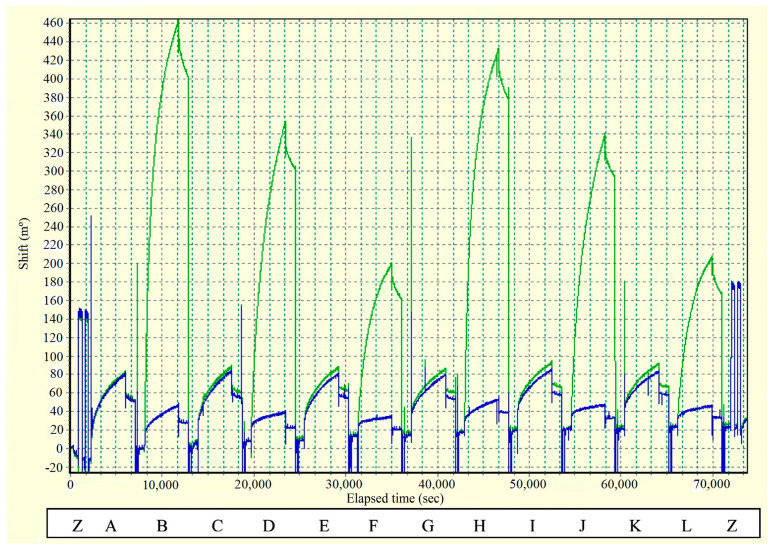
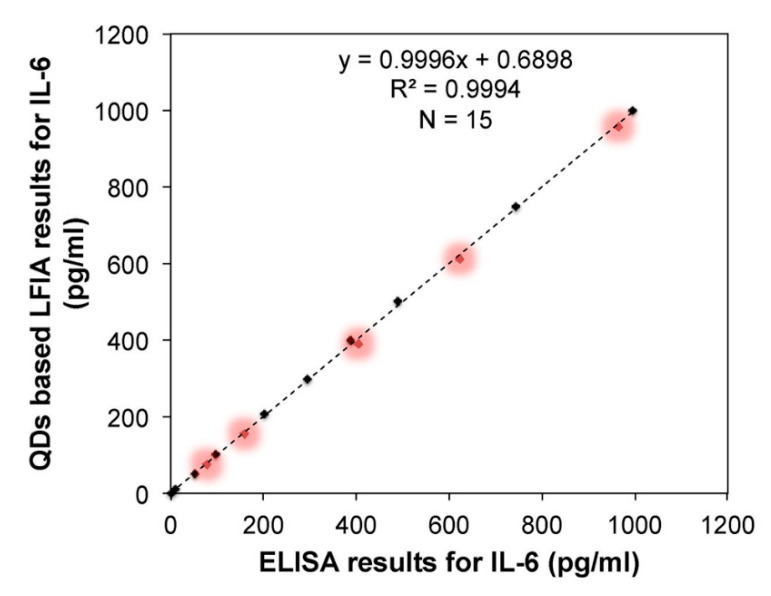
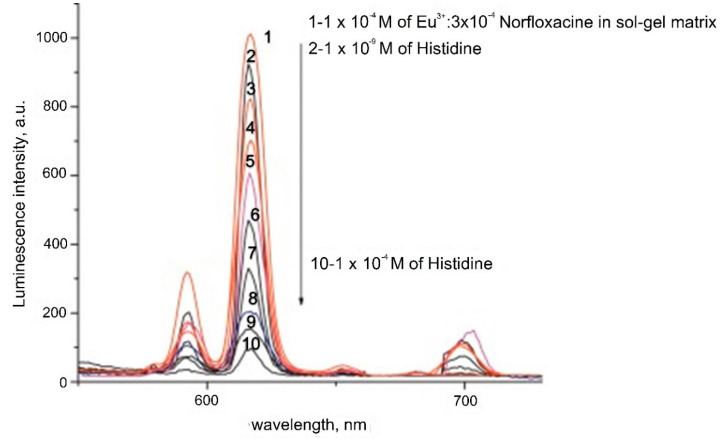
A comprehensive review of optical biosensors for the detection of biomarkers associated with rheumatoid arthritis (RA) is presented here, including microRNAs (miRNAs), C-reactive protein (CRP), rheumatoid factor (RF), anti-citrullinated protein antibodies (ACPA), interleukin-6 (IL-6) and histidine, which are biomarkers that enable RA detection and/or monitoring. An overview of the different optical biosensors (based on fluorescence, plasmon resonances, interferometry, surface-enhanced Raman spectroscopy (SERS) among other optical techniques) used to detect these biomarkers is given, describing their performance and main characteristics (limit of detection (LOD) and dynamic range), as well as the connection between the respective biomarker and rheumatoid arthritis. It has been observed that the relationship between the corresponding biomarker and rheumatoid arthritis tends to be obviated most of the time when explaining the mechanism of the optical biosensor, which forces the researcher to look for further information about the biomarker. This review work attempts to establish a clear association between optical sensors and rheumatoid arthritis biomarkers as well as to be an easy-to-use tool for the researchers working in this field.

Keywords: CRP; biomarkers; miRNA; optical biosensors; rheumatoid arthritis (RA).


Conflict of interest statement

The authors declare no conflict of interest.

Figures

Figure 1
Figure 1
Biosynthesis pathway for miRNA. Reproduced under the terms of the Creative Commons Attribution-Non Commercial 3.0 Unported License (https://creativecommons.org/licenses/by-nc/3.0/) [29]. Copyright 2010, The Authors. Published by Avicenna Research Institute (ARI).
Figure 2
Figure 2
Schematic illustration of the hybridization-based total internal reflection fluorescence microscopy (TIRFM) assay for the detection of single miR-21 molecules in solution in which the fluorophore YOYO-1 is used. Reproduced with permission from [42]. Copyright 2010 American Chemical Society.
Figure 3
Figure 3
Basic operation principle of a fluorescent sensor for miRNA detection that employs graphene oxide (GO). (a) DNA probe is adsorbed by GO and the fluorophore is quenched. (b) miRNA hybridizes with DNA probe and both desorb from GO, the fluorophore emits light.
Figure 4
Figure 4
(a) Paper platform for the detection of miR-21. (b) Case where the target is not detected, the fluorescence is quenched and the color changes from orange to purple. (c) Case where the target miRNA is detected and orange fluorescence is maintained. Reproduced with permission [37]. Copyright 2012 American Chemical Society.
Figure 5
Figure 5
(a) Histograms of the peak areas on the test lines that correspond to a negative control and miR-21 in different concentrations. Inset shows the calibration plot of the peak area of the test line versus miR-21 concentration. (b) Histograms of the peak areas on the test lines in a specificity assay: negative control, miR-214, miR-210-3p (indicated as miR-210) and miR-21. (a,b). Reprinted [49], Copyright 2017, with permission from Elsevier.
Figure 6
Figure 6
(a) Fluorescence spectra of the HCR/GO biosensor in the presence of different concentrations of let-7a (from bottom to top 0, 10 fM, 50 fM, 100 fM, 200 fM, 1 pM, 1.5 pM, 2 pM). Inset: linear relationship between the fluorescence intensity change (F–F0) and let-7a concentration. (b) Specificity assay with let-7b, let-7e, let-7f, let-7g, let-7i (concentration 2 pM). (a,b) Reprinted [53], Copyright 2018, with permission from Elsevier.
Figure 7
Figure 7
(a) Fluorescence spectra of samples with different concentrations of miR-21 and miR-155 (control represents the sample without any miRNA) (b) Specificity assay with no miRNA (Control), miR-210-3p (indicated as miR-210) and miR-214 (concentration 100 pM). (a,b) Reprinted [55], Copyright 2017, with permission from Elsevier.
Figure 8
Figure 8
Sensor operation based on Au NPs for miR-155 detection. (a) Citrate-capped Au NPs (C-Au NPs) and DNA probes binding (b) PEI-capped Au NPs (Au NPs) and miR-155 binding. (c) MiR-155 detection based on the color change from red to pinkish/purple. (ac) Reproduced under the terms of the Creative Commons Attribution 4.0 International License (https://creativecommons.org/licenses/by/4.0/) [60]. Copyright 2018, The Authors. Published by Scientific reports.
Figure 9
Figure 9
(a) Surface plasmon resonance (SPR) spectra with miR-155 concentrations ranging from 10−17 to 10−11 M obtained using gold nanorod (Au NR) amplification. The arrow denotes the shift in the SPR angle. (b) Relationship between the SPR angle and miR-155 concentration using DNA probes with and without Au NRs. (a,b) Adapted under the terms of the Creative Commons Attribution 4.0 International License (https://creativecommons.org/licenses/by/4.0/) [63]. Copyright 2019, The Authors. Published by Nature Communications.
Figure 10
Figure 10
(a) Microring resonators with amplification strategy based on using anti DNA:RNA antibodies. (b) Calibration curves for miR-16, miR-21, miR-24 (designed as miR-24-1) and miR-26a. Plots were constructed from the relative shifts at 40 min. (a,b) Adapted with permission [67]. Copyright 2011 American Chemical Society.
Figure 11
Figure 11
(a) SERS sensing of miR-155 using DNA microcapsules and DSN amplification. (b) Linear curve of Raman intensity (1627 cm−1) for concentrations of miR-155 from 1 fM to 10 nM. (a,b) Adapted with permission [72]. Copyright 2018 American Chemical Society.
Figure 12
Figure 12
(a) Biosensor configuration without protein G. (b) Biosensor configuration with protein G. Key: CRP Ab: anti-CRP antibody, CRP Ag: CRP antigen, BSA: bovine serum albumin, PG: protein G. (c) SPRi signal versus time for different concentrations of CRP in human plasma: with protein G (black), without protein G (red). (ac) Adapted under the terms of the Creative Commons Attribution 4.0 International License (https://creativecommons.org/licenses/by/4.0/) [137]. Copyright 2014, The Authors. Published by Scientific Research Publishing Inc.
Figure 13
Figure 13
(a) Schematic cross-sectional figure showing the structure of a fabricated anodicaluminum oxide (AAO) chip for CRP detection. (b) The linear regression of the resonance wavelength shift after CRP antigen–antibody reaction (black squares) and after gold nanoparticle labelled CRP secondary antibody reaction (red circles). (a,b) Reprinted [141], Copyright 2013, with permission from Elsevier.
Figure 14
Figure 14
The Bragg wavelength shift ∆λB of biofunctionalized eFBG fibers as a function of CRP concentration (i) without any interfering substances (black), (ii) in the presence of the interfering substances urea (1.8 g/L) and ascorbic acid (1.8 g/L) (grey), (iii) without fiber coupling of the CRP-specific aptamer and any interfering substance (brown), and (iv) in presence of diluted CRP deficient human plasma (blue). Data were fitted to the Langmuir–Freundlich isotherm. Reproduced under the terms of the Creative Commons Attribution 4.0 International License (https://creativecommons.org/licenses/by/4.0/) [145]. Copyright 2018, the Authors. Published by MDPI.
Figure 15
Figure 15
Schematic of the sensing platform using a swarm of single nanoparticle colorimetric sensors. Reprinted [147], Copyright 2019, with permission from Elsevier.
Figure 16
Figure 16
Laboratory-built TIRFM system used for the MSF-based detection of CRP. Key: L, laser; M, mirror; MS, mechanical shutter; P, prism; IO, immersion; OL, objective lens; EFL, evanescence field layer, ICCD, intensified charge-coupled device. Reprinted [150], Copyright 2010, with permission from Elsevier.
Figure 17
Figure 17
Schematic representation of the capture immunoassay performed on a screen-printed graphite electrode. Histogram: chemiluminescent detection of RF in human sera using screen-printed (SP) microarrays. Reprinted [168], Copyright 2007, with permission from Elsevier.
Figure 18
Figure 18
Sensorgram of citrulline peptide containing spot (green) and its arginine control spot (blue). The array was probed two times with three different RA sera: (B,H) serum 1, (D,J) serum 2, and (F,L) serum 3. Between probes, normal sheep serum was used (A,C,E,G,I,K) to increase the number of regenerations. After every serum (RA or sheep serum) the sensor was regenerated with 10 mM glycine‚ HCl. Reprinted with permission [169]. Copyright 2007 American Chemical Society.
Figure 19
Figure 19
Comparison of lateral flow immunoassay (LFIA) results with standard enzyme-linked immunosorbent assay (ELISA) results. Black points correspond to IL-6 detection in Tris buffer while points highlighted in red correspond to IL-6 spiked in human serum. Reprinted [149], 2019), Copyright 2019, with permission from Elsevier.
Figure 20
Figure 20
Luminescence emission spectra of nano Eu–norfloxacine complex doped in sol–gel matrix in the presence of different concentrations of histidine in acetonitrile (curve 1: control, curve 2: 1 nM–curve 10: 100 μM). Reprinted [172], Copyright 2015, with permission from Elsevier.

Similar articles

Cited by

References

    1. Duarte-Garcia A., reviewed by American Collegue of Rheumatology Diseases & Conditions. Rheumatoid Arthritis. [(accessed on 20 October 2020)]; Available online: https://www.rheumatology.org/I-Am-A/Patient-Caregiver/Diseases-Condition....
    1. Firestein G.S. Evolving concepts of rheumatoid arthritis. Nature. 2003;423:356–361. doi: 10.1038/nature01661. - DOI - PubMed
    1. Driver C.B., Stöppler M.C. Rheumatoid Arthritis (RA): Early Signs, Symptoms, Causes, Treatment & Diet. [(accessed on 5 May 2020)]; Available online: https://www.emedicinehealth.com/rheumatoid_arthritis/article_em.htm#rheu....
    1. Heidari B. Rheumatoid arthritis: Early diagnosis and treatment outcomes. Casp. J. Intern. Med. 2011;2:161–170. - PMC - PubMed
    1. England B.R., Tiong B.K., Bergman M.J., Curtis J.R., Kazi S., Mikuls T.R., O’Dell J.R., Ranganath V.K., Limanni A., Suter L.G., et al. 2019 Update of the American College of Rheumatology Recommended Rheumatoid Arthritis Disease Activity Measures. Arthritis Care Res. 2019;71:1540–1555. doi: 10.1002/acr.24042. - DOI - PMC - PubMed

MeSH terms