. 2021 Jan 1;81(1):158-173.
doi: 10.1158/0008-5472.CAN-20-1674. Epub 2020 Nov 6.

Enhanced Efficacy of Simultaneous PD-1 and PD-L1 Immune Checkpoint Blockade in High-Grade Serous Ovarian Cancer

Affiliations

Enhanced Efficacy of Simultaneous PD-1 and PD-L1 Immune Checkpoint Blockade in High-Grade Serous Ovarian Cancer

Changxin Wan et al. Cancer Res. .

Abstract

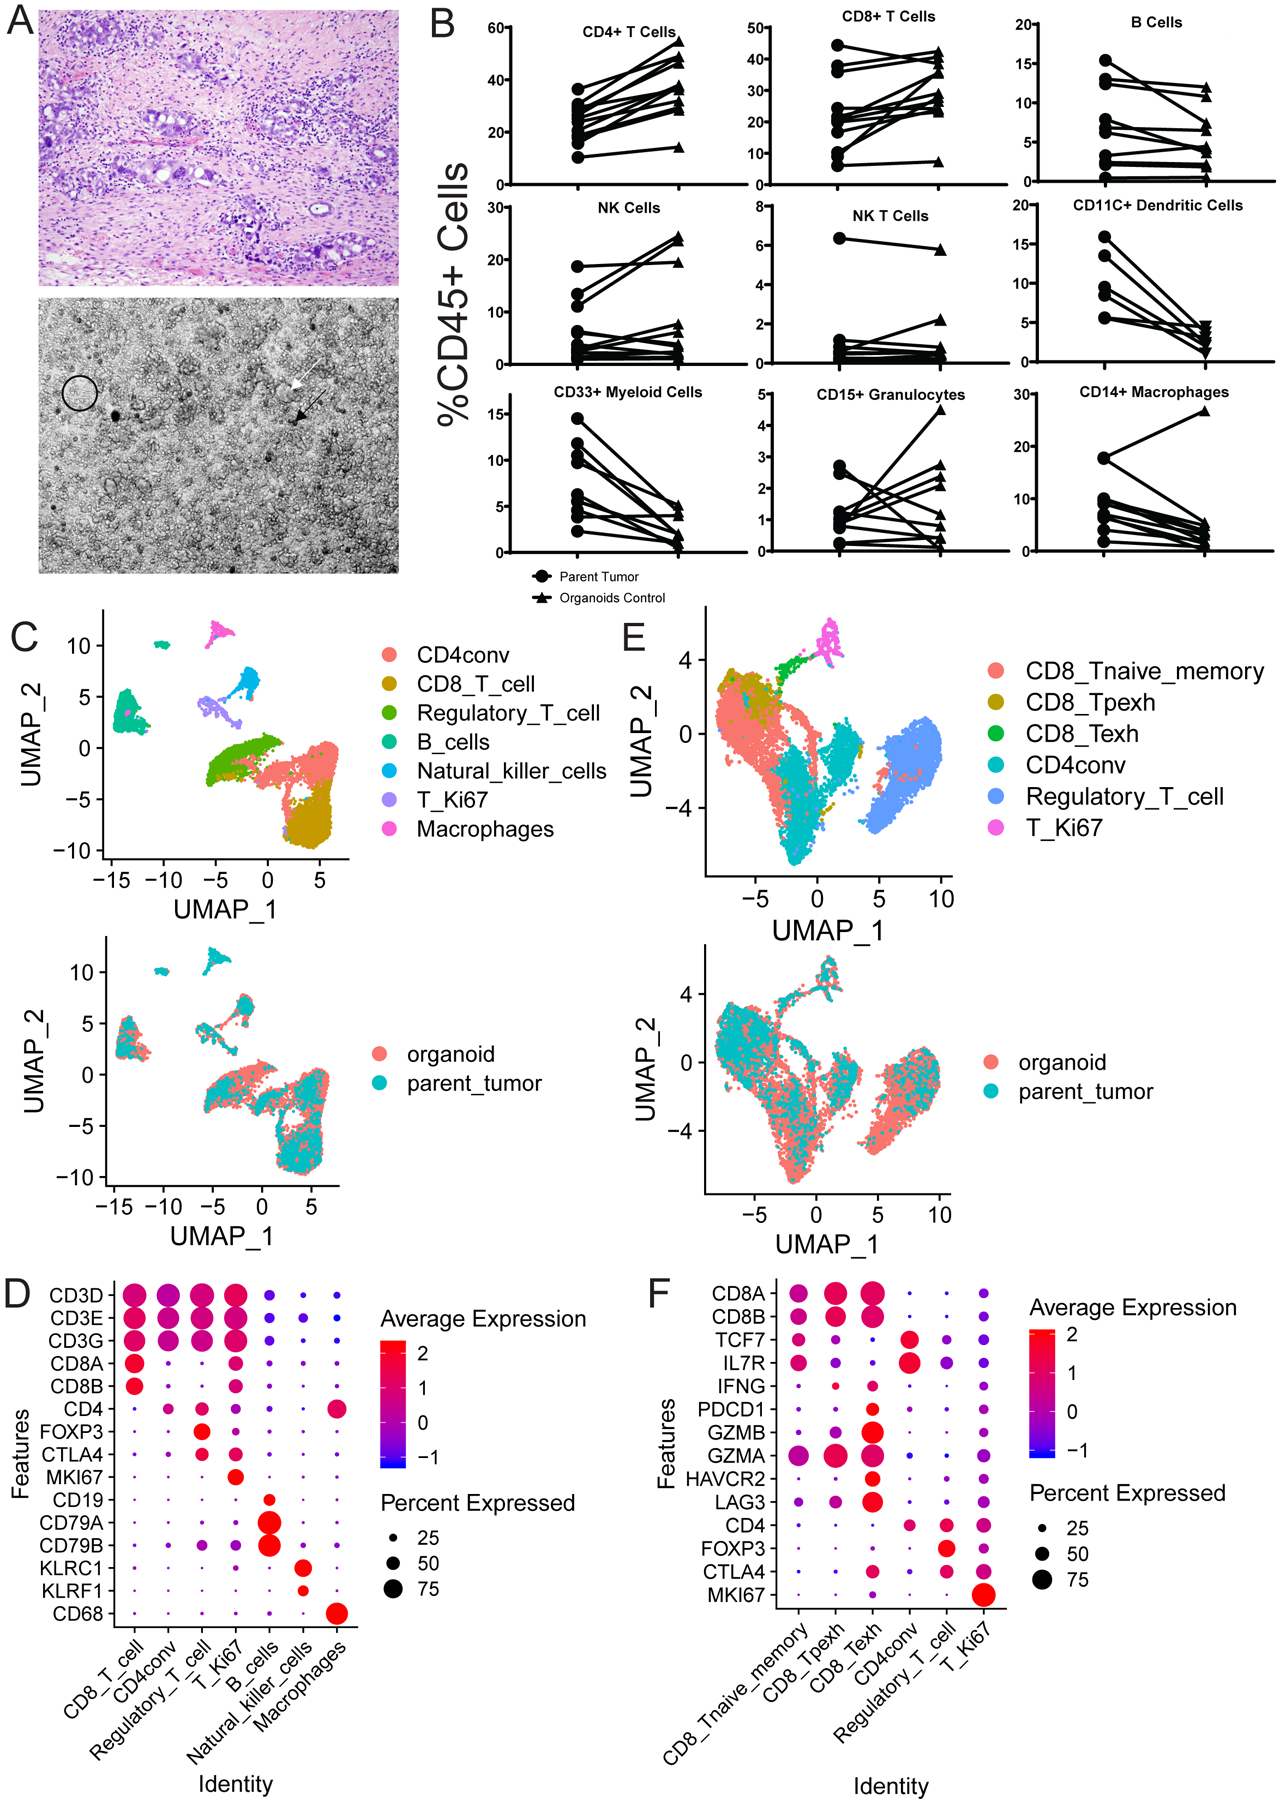
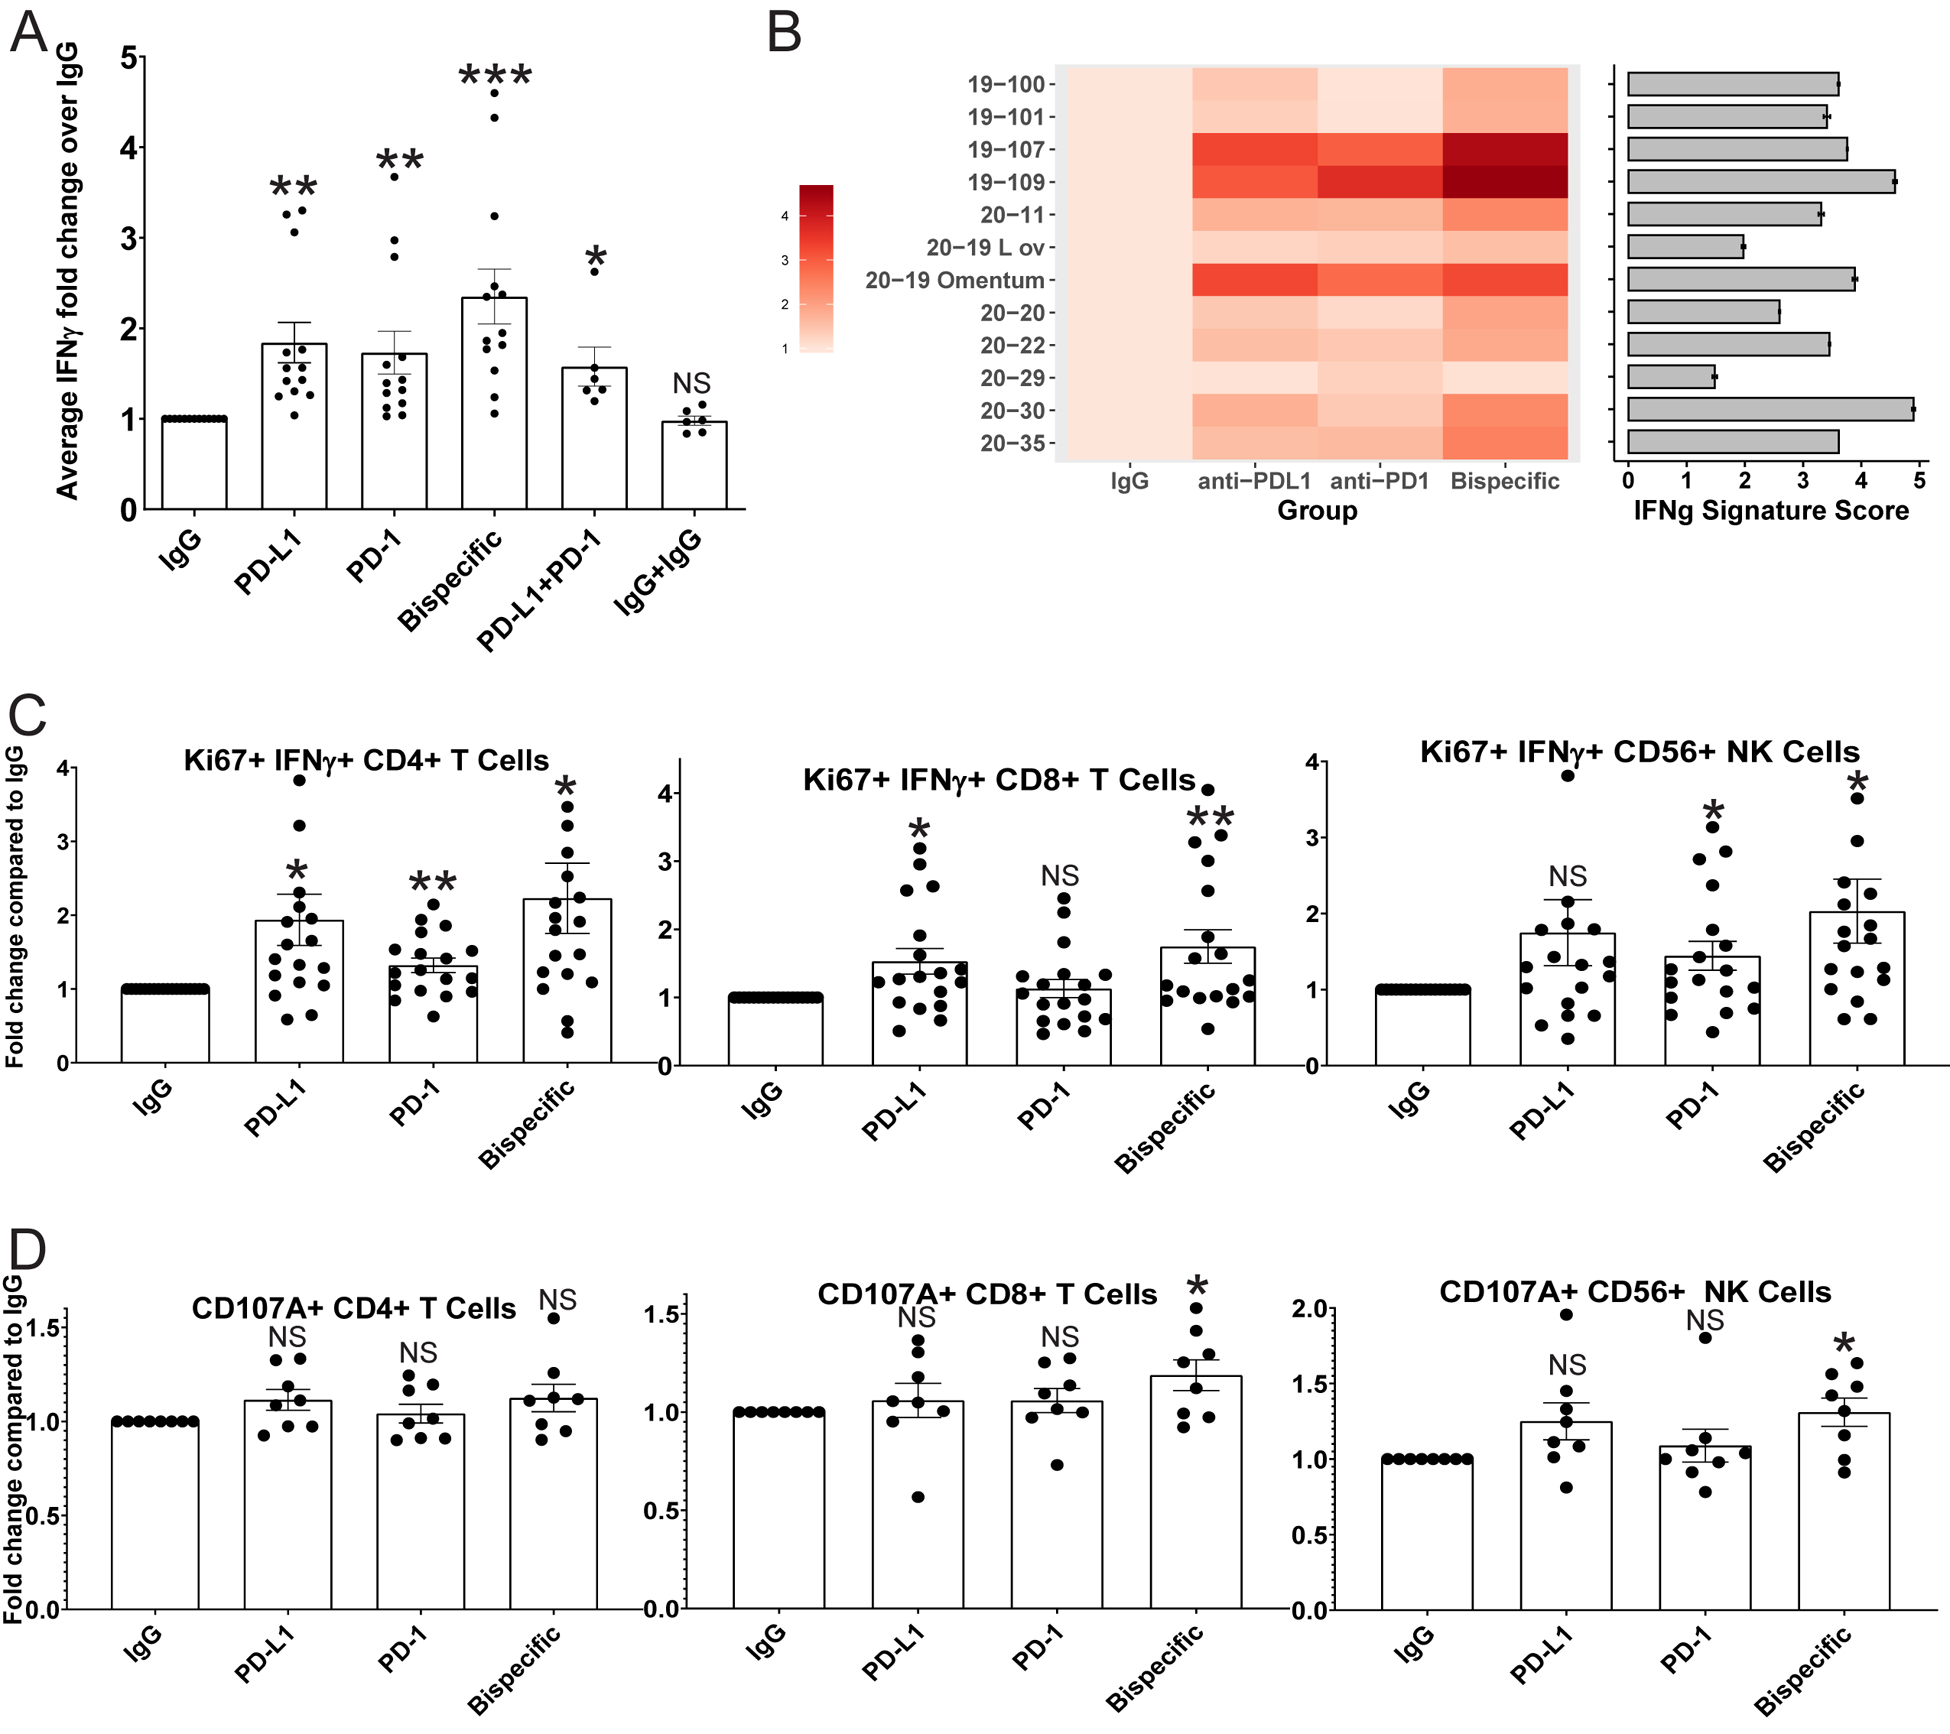
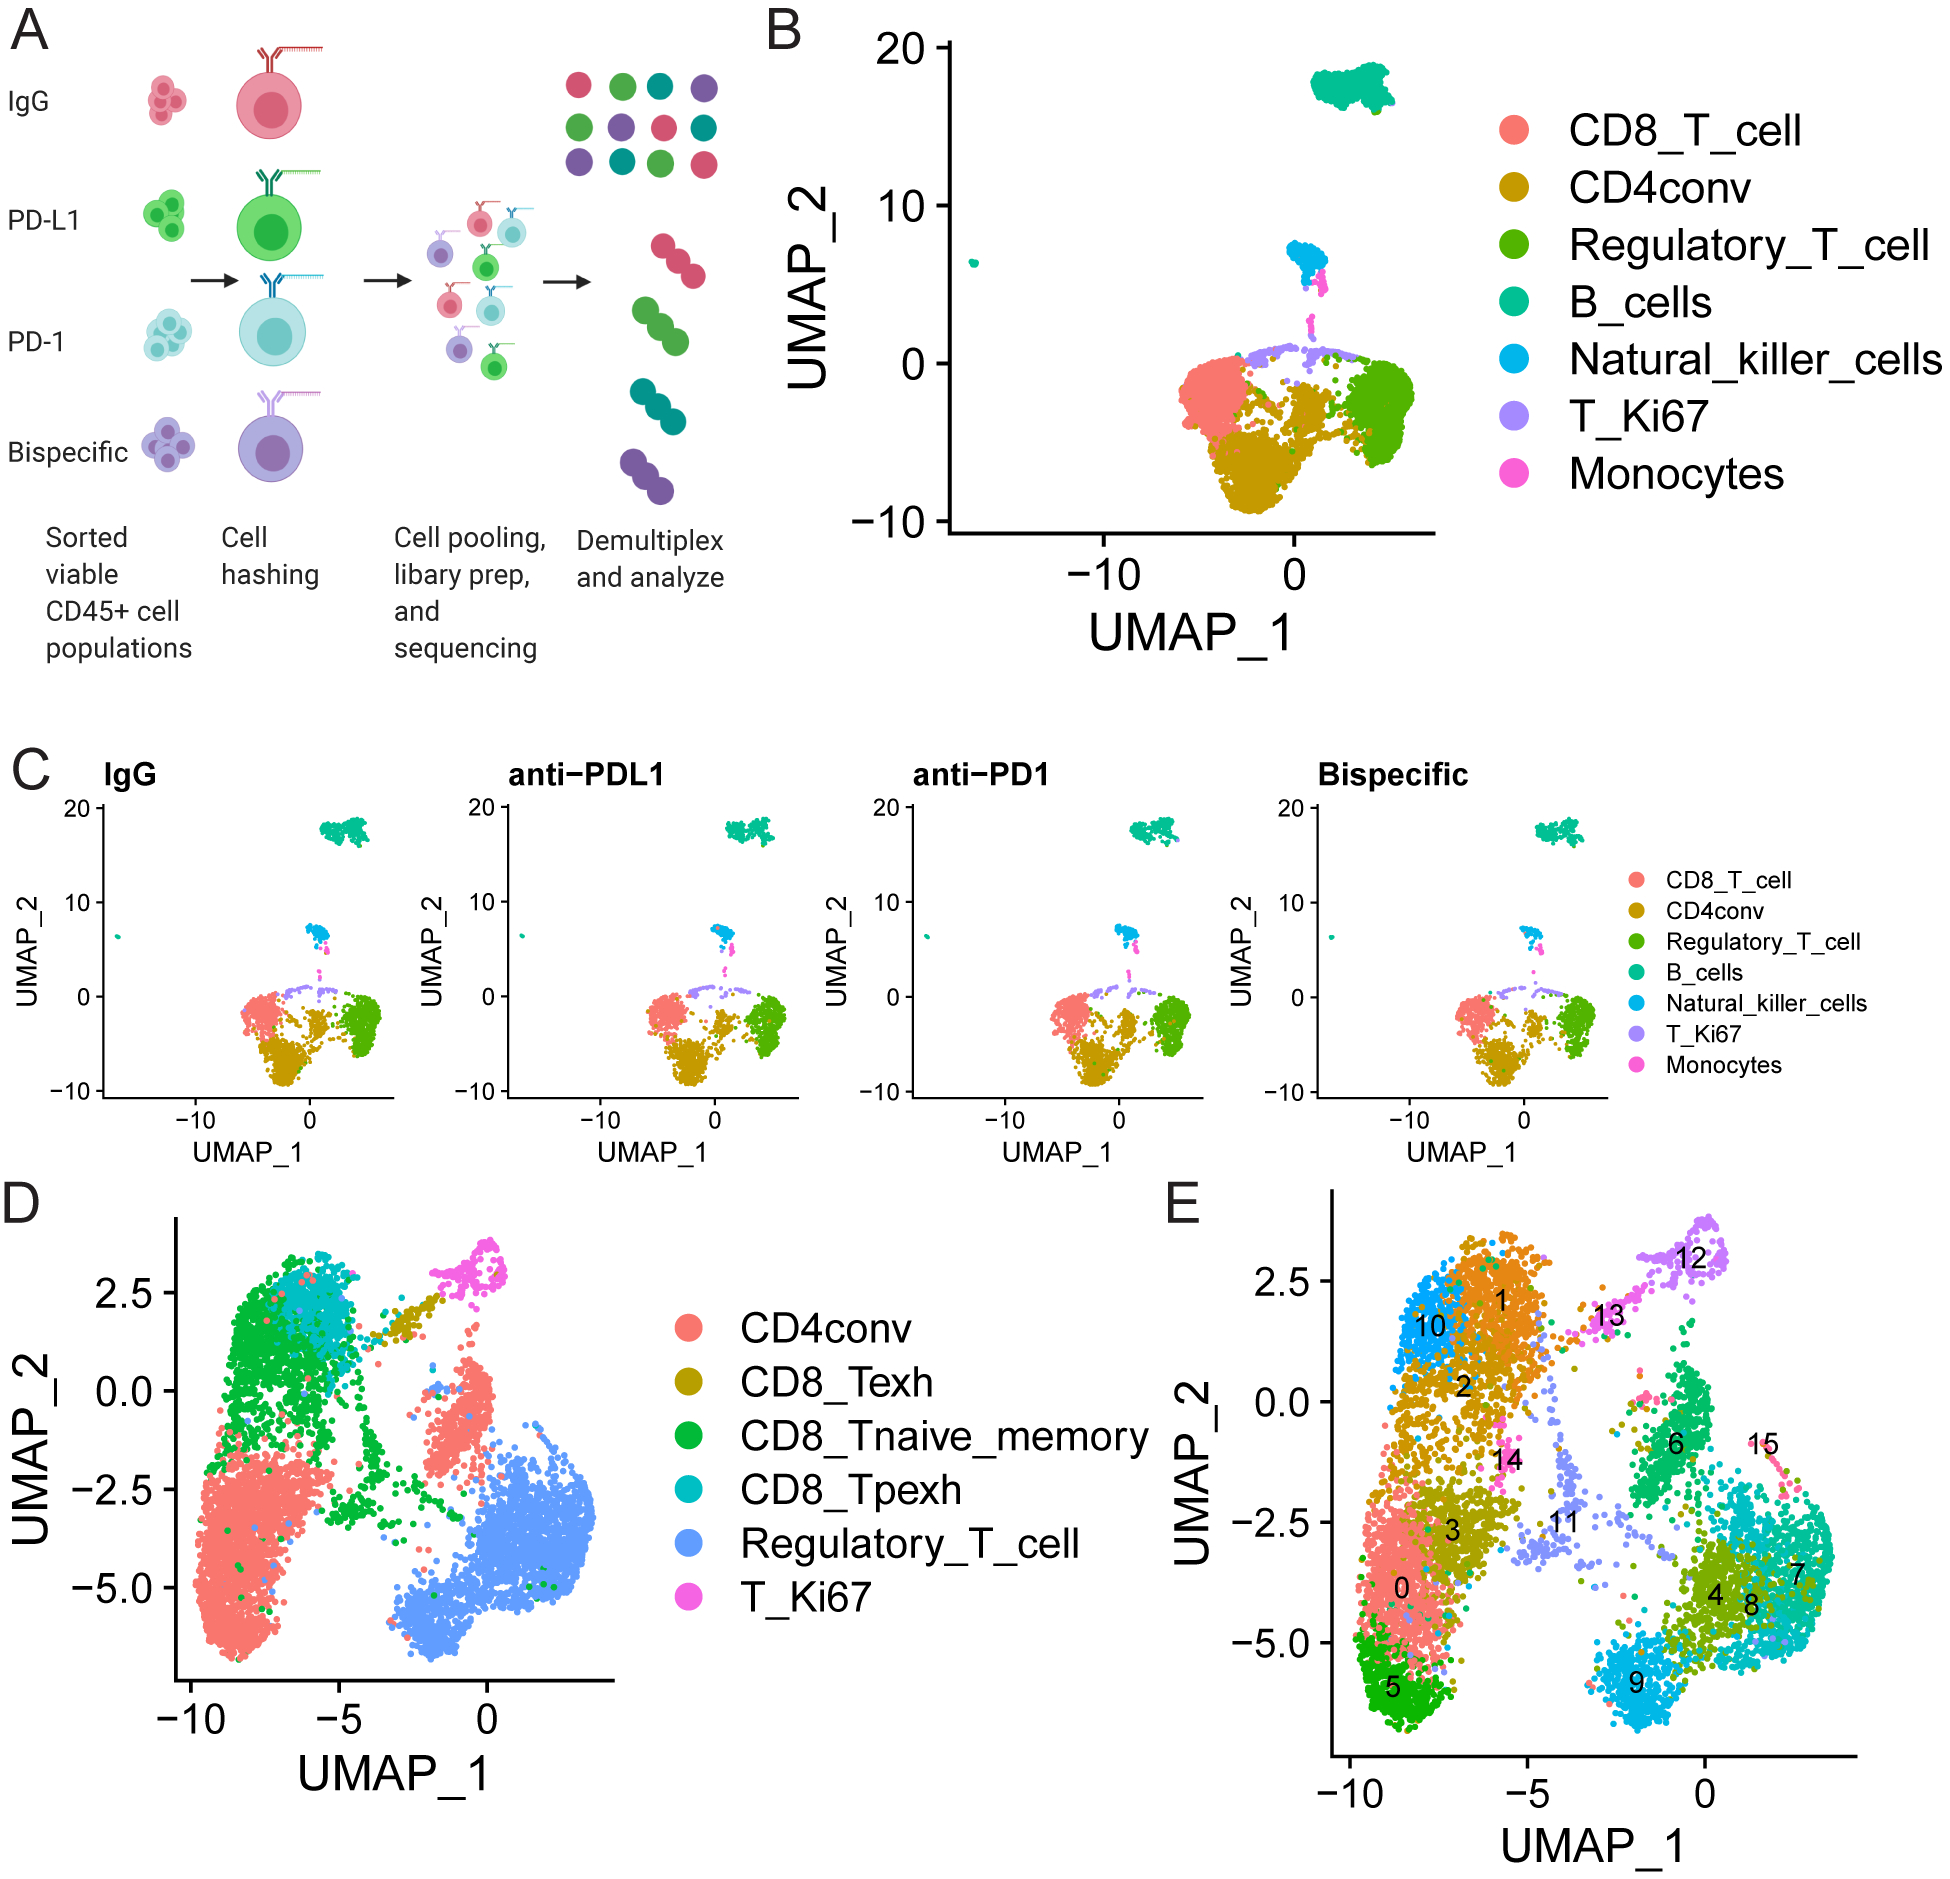
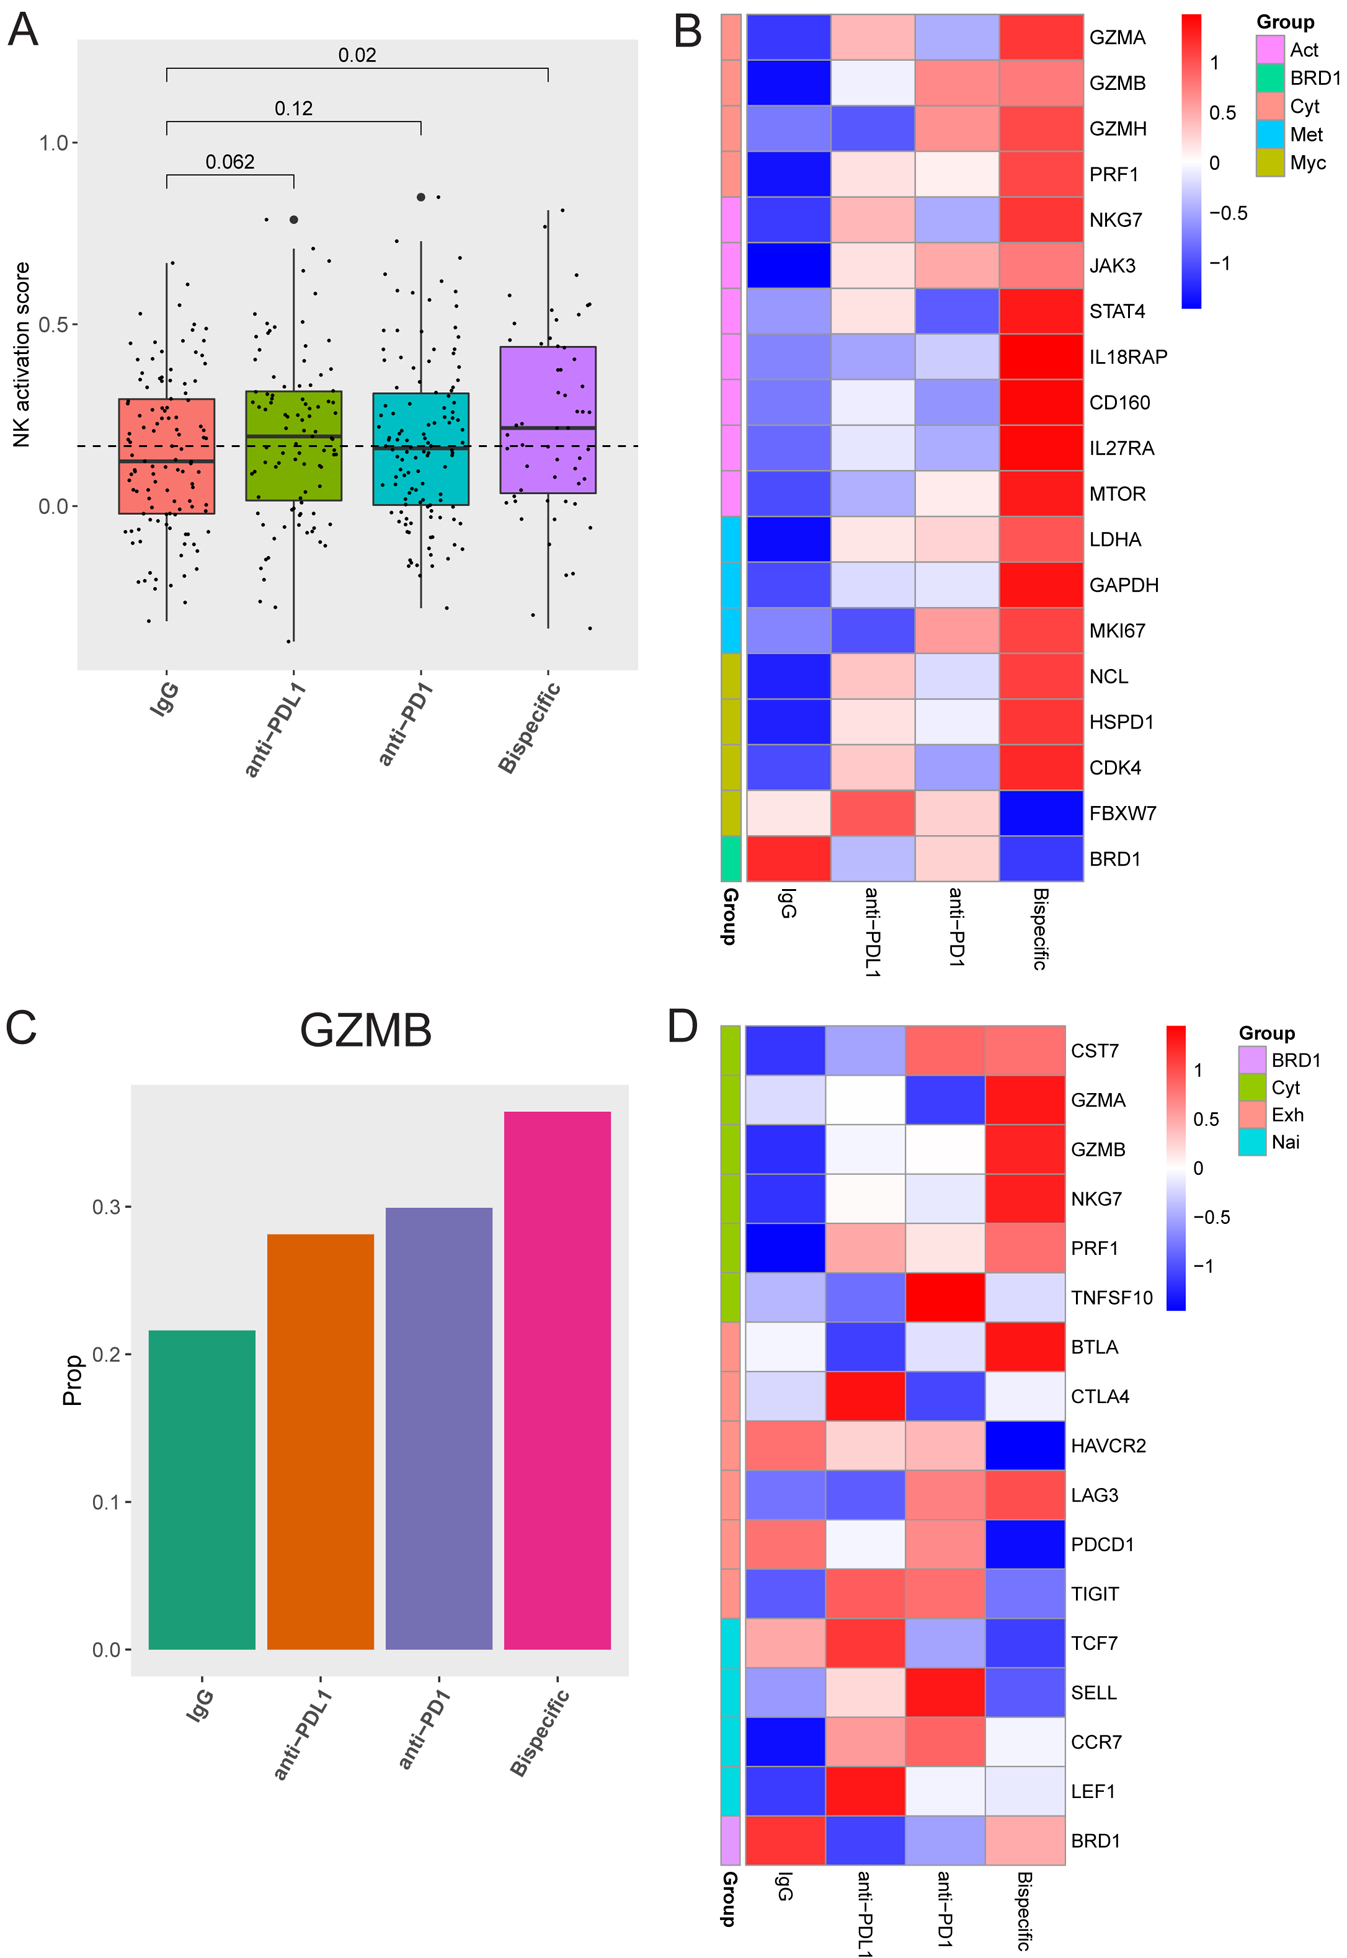
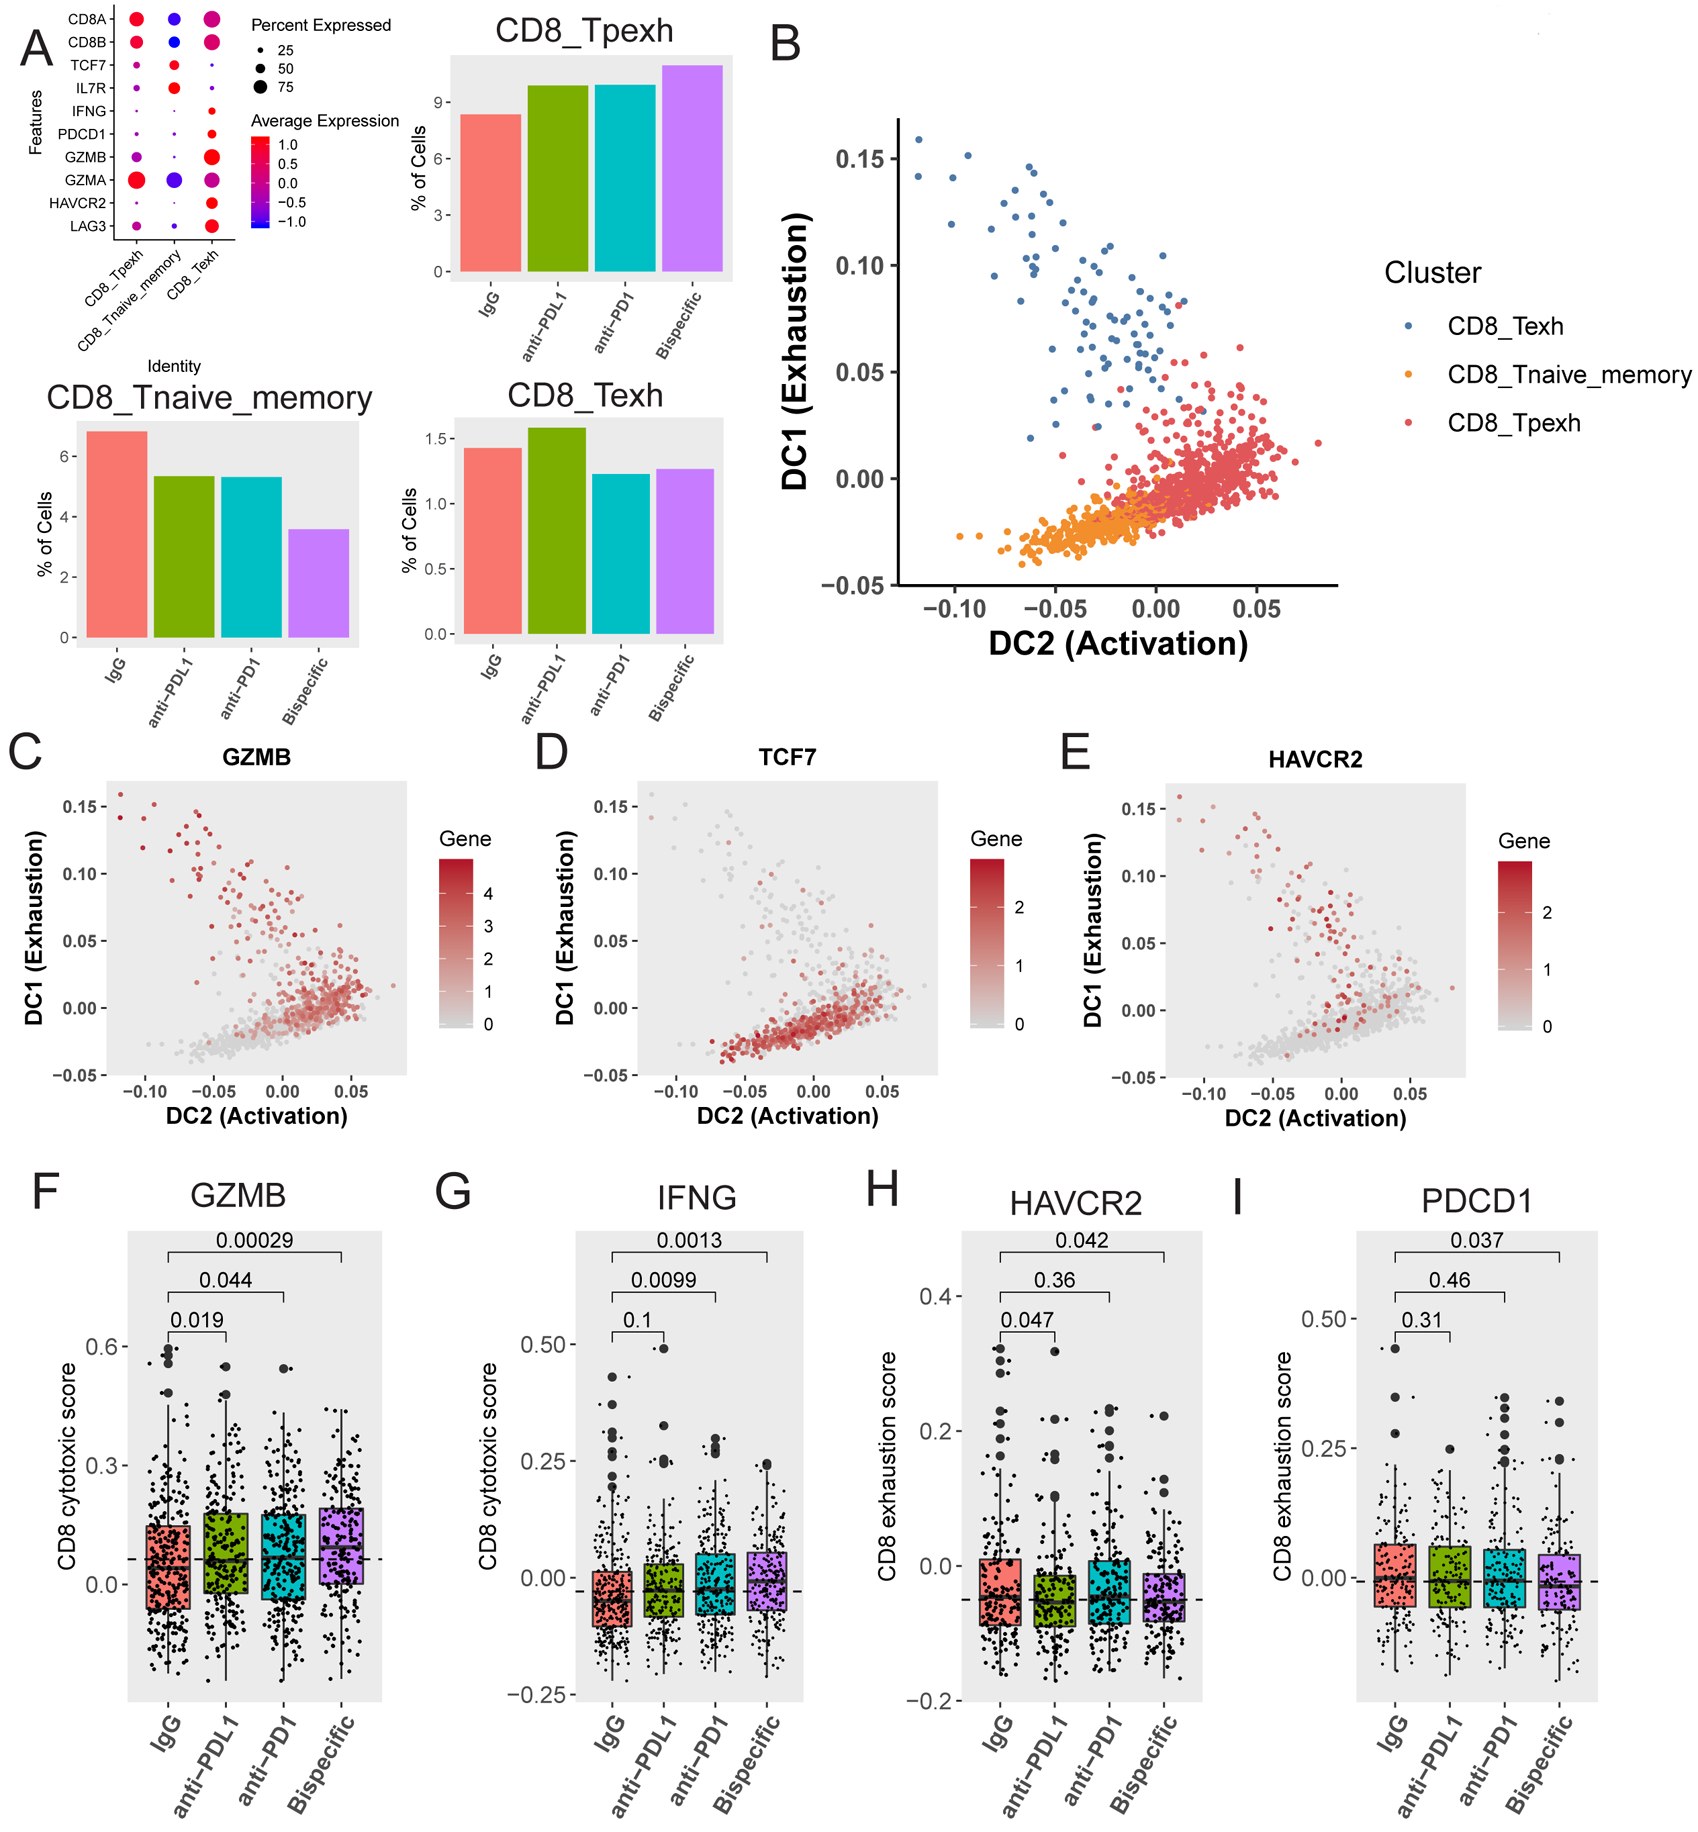
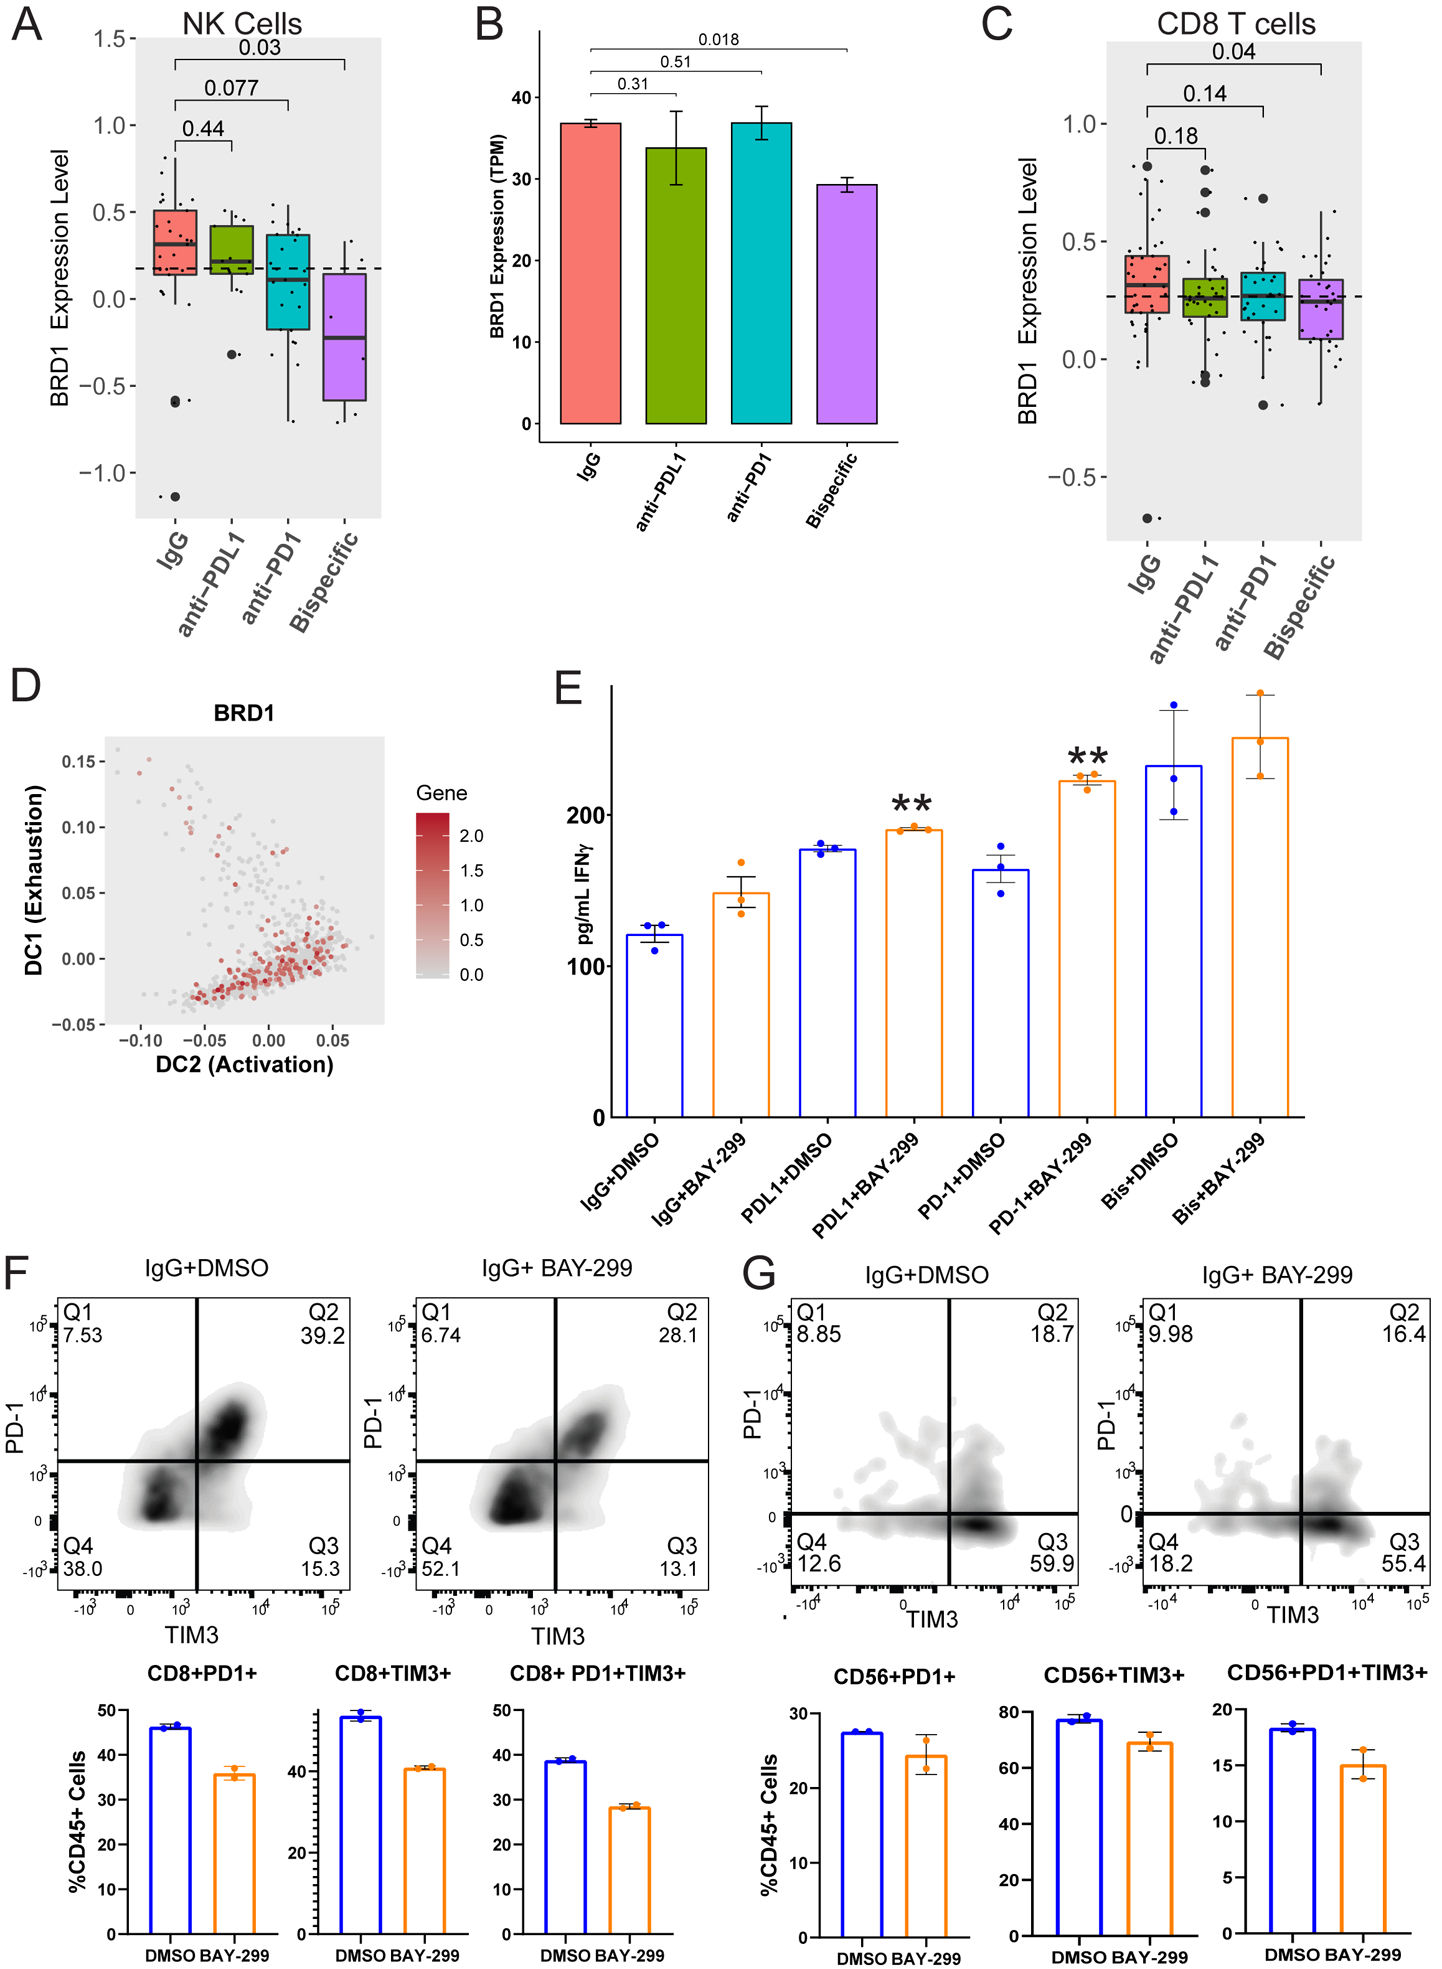
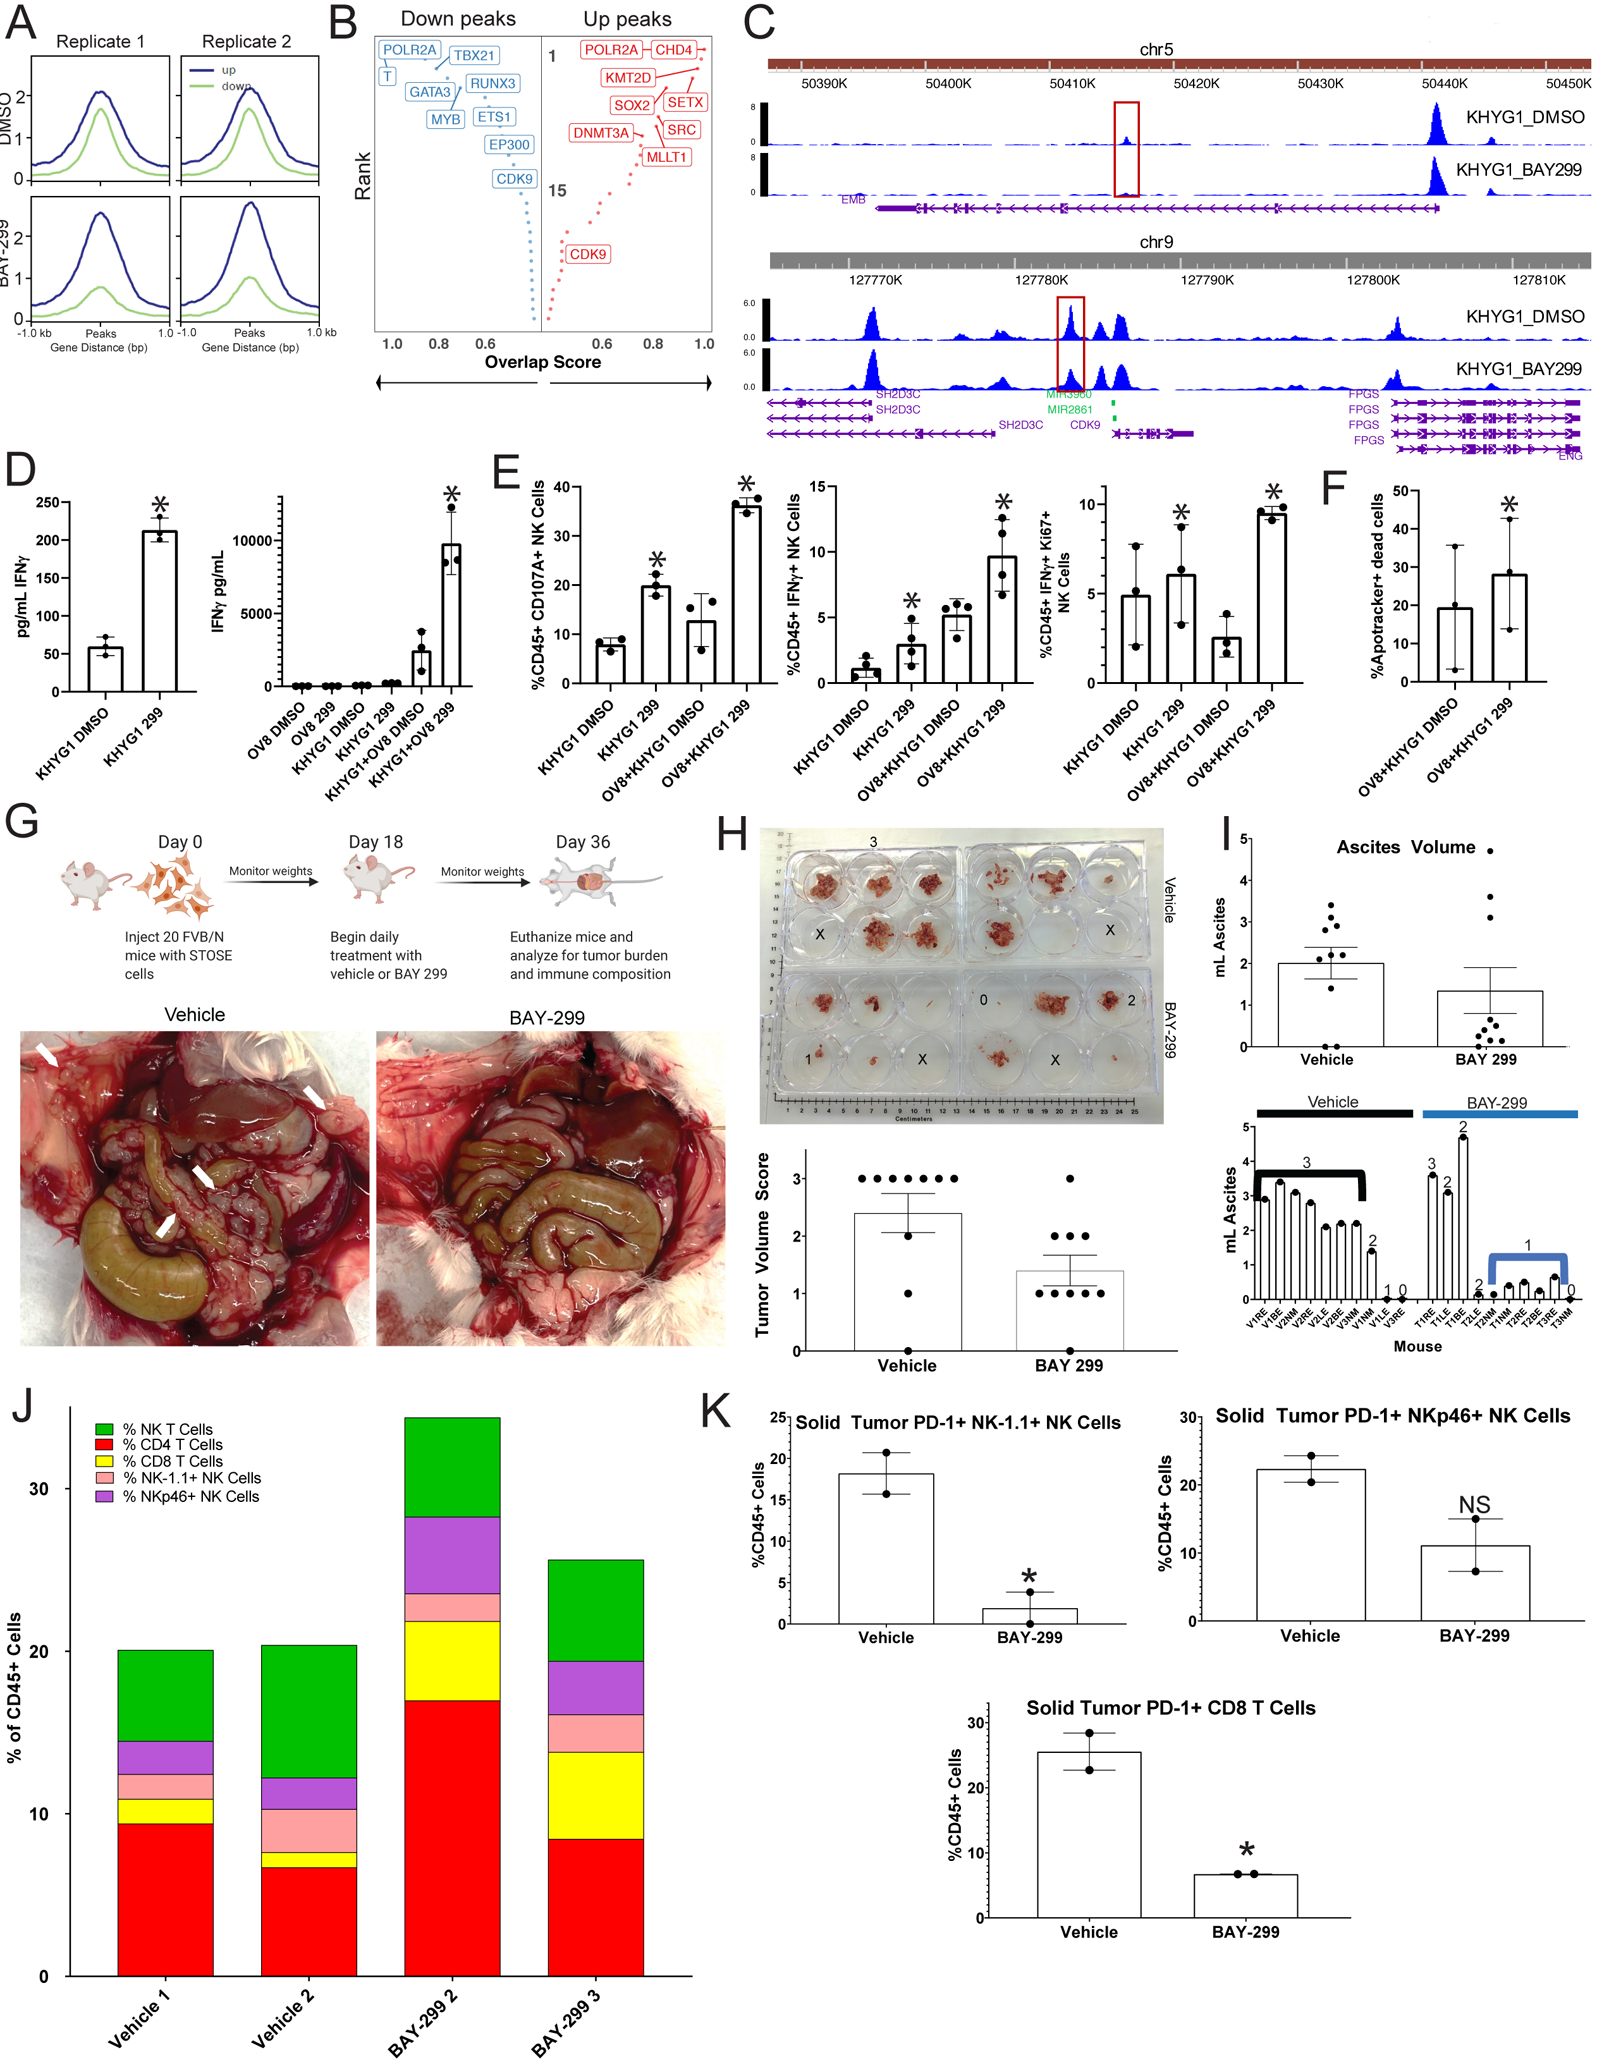
Immune therapies have had limited efficacy in high-grade serous ovarian cancer (HGSC), as the cellular targets and mechanism(s) of action of these agents in HGSC are unknown. Here we performed immune functional and single-cell RNA sequencing transcriptional profiling on novel HGSC organoid/immune cell co-cultures treated with a unique bispecific anti-programmed cell death protein 1 (PD-1)/programmed death-ligand 1 (PD-L1) antibody compared with monospecific anti-PD-1 or anti-PD-L1 controls. Comparing the functions of these agents across all immune cell types in real time identified key immune checkpoint blockade (ICB) targets that have eluded currently available monospecific therapies. The bispecific antibody induced superior cellular state changes in both T and natural killer (NK) cells. It uniquely induced NK cells to transition from inert to more active and cytotoxic phenotypes, implicating NK cells as a key missing component of the current ICB-induced immune response in HGSC. It also induced a subset of CD8 T cells to transition from naïve to more active and cytotoxic progenitor-exhausted phenotypes post-treatment, revealing the small, previously uncharacterized population of CD8 T cells responding to ICB in HGSC. These state changes were driven partially through bispecific antibody-induced downregulation of the bromodomain-containing protein BRD1. Small-molecule inhibition of BRD1 induced similar state changes in vitro and demonstrated efficacy in vivo, validating the co-culture results. Our results demonstrate that state changes in both NK and a subset of T cells may be critical in inducing an effective anti-tumor immune response and suggest that immune therapies able to induce such cellular state changes, such as BRD1 inhibitors, may have increased efficacy in HGSC. SIGNIFICANCE: This study indicates that increased efficacy of immune therapies in ovarian cancer is driven by state changes of NK and small subsets of CD8 T cells into active and cytotoxic states.


Conflict of interest statement

Competing interests: M.B. receives sponsored research support from Novartis. M.B. serves as a consultant and scientific advisor to Kronos Bio, H3 Biomedicine and GV20 Therapeutics. In the past M.B. served as a scientific advisor to GTx, Inc. and as consultant to Aleta BioTherapeutics. U.A.M. is a consultant for Novartis and Merck, is on the scientific advisory boards for 2X Oncology and the Clearity Foundation, and is an uncompensated advisor for AstraZeneca. X.S.L. is a cofounder and board member of GV20 Oncotherapy, on the scientific advisory board of 3DMed Care, a consultant for Genentech, and a stock holder of BMY, TMO, WBA, ABT, ABBV, and JNJ. S.J.H. receives sponsored research support from Eli Lilly and Company and AstraZeneca. B.R. is an uncompensated scientific advisory board member for VincenTech. B.R. receives sponsored research support from Palleon Pharmaceuticals and Mercy Bioanalytics. Neither is directly related to the proposed research.

Figures

FIGURE 1:
FIGURE 1:. HGSC organoid co-cultures accurately mimic the parent tumors from which they were derived:
A) Organoid co-cultures (bottom) physically resemble the diverse cellular environment of the parent tumor (top) which includes cancer, stromal, and immune cells. The co-cultures contain tumor spheres (white arrow), clusters of single immune and stromal cells (black circle), and psammoma body calcifications (black arrow). B) Flow cytometry analysis for all immune cell types was performed on parent tumors and control treated organoids. Comparisons of each individual immune cell type between parent tumor (circles) and control treated organoid co-culture (triangles) as a percentage of viable CD45 positive cells are shown. C-F) scRNA-seq analysis results comparing the parent tumor and treated organoid co-cultures for patient 20–11. C) UMAPs are shown here to demonstrate concordance across all immune cell types between the parent tumor and organoid co-culture. All populations detected are shown on top with a color key on the right, and an overlay of these populations in the parent tumor (blue) and organoid co-cultures (orange) is shown below. D) Markers (Y axis) used to define each of the individual immune cell populations (X axis) in C are shown here along with the expression level in each defined cell type. The average expression level (colors) is shown in the percentage of cells (sphere) expressing each marker for each cell type. E) UMAPs are shown here to demonstrate concordance across all T cell types between the parent tumor and organoid co-culture. All populations detected are shown on top with a color key on the right, and an overlay of these populations in the parent tumor (blue) and organoid co-cultures (orange) is shown below. F) Markers (Y axis) used to define each of the different T cell populations (X axis) in E are shown here along with the expression level in each defined cell type. The average expression level (colors) is shown in the percentage of cells (sphere) expressing each marker for each cell type. CD8_Tnaive_memory= Naïve and memory CD8 T cells, CD4conv=Conventional non-regulatory CD4 T cells, Regulatory_T_cell=Regulatory CD4 T cells, T_Ki67=Proliferating T cells, CD8_Texh=Terminally exhausted CD8 T cells, CD8_Tpexh=Progenitor exhausted CD8 T cells
FIGURE 2:
FIGURE 2:. ICB antibodies induce detectable IFNγ production in proportion to the parent tumor aggregate immune state, increased CD4, CD8, and NK cell activity, and a killing phenotype in CD8 T and NK cells in HGSC co-cultures:
A) IFNγ ELISA analysis was performed on media from organoid co-cultures treated with IgG control, anti-PD-L1, anti-PD-1, anti-PD-1/PD-L1 (bispecific), anti-PD-1+anti-PD-L1, and IgG+IgG. Average IFNγ amounts normalized to the IgG control are shown here across all experiments with error bars representing standard error of the mean. p-values were calculated for all comparisons using a paired t-test. Comparisons of key antibodies to the IgG control are shown. *<0.05, **<0.005, ***<0.0005. p-values for the significance of other treatment comparisons are shown in Figure S6. B) A heatmap is shown for the normalized ELISA results of each individual tumor for IgG, anti-PD-L1, anti-PD-1, and the bispecific antibody. The color code is shown on the left. In addition, bulk RNA sequencing was performed on the parent tumors used to generate the co-cultures, and an IFNG signature score was generated. Each tumor was sequenced twice, and the average IFNG score from each parent tumor is shown to the right of the heatmap as a horizontal bar graph with the number score key below. Error bars represent standard deviation. C) Flow cytometry analysis for IFNγ/Ki67 double positive CD4, CD8, and CD56 positive NK cells across treatments normalized to the IgG control. D) Flow cytometry analysis for CD107A expression on CD4, CD8, and CD56 positive NK cells across treatments normalized to the IgG control. *p<0.05, **p<0.005, NS=Not significant. Error bars represent standard error of the mean.
FIGURE 3:
FIGURE 3:. scRNA-seq analysis of treated organoid co-cultures offers a comprehensive assessment of all immune cell types post-ICB treatment:
A) Schematic of scRNA-seq experiment. A single organoid co-culture was treated with isotype control, anti-PD-L1, anti-PD-1, or anti-PD-1/PD-L1. Viable CD45+ cells were sorted 96 hours later, hashed with different barcodes for each treatment, mixed in equal proportion, and submitted for 10X Genomics library preparation and subsequent sequencing analysis. B-E) scRNA-seq analysis comparing results in the organoid co-cultures across treatments. B) UMAP demonstrating all immune cells detected in the pool of mixed cells from all treatments from the organoid co-cultures. The color code for each cell type is shown on the right. C) UMAPs demonstrating the cells detected in organoid co-cultures from each treatment in the populations in B shown separately to demonstrate equal distribution of all lineages across treatment. Treatment is indicated above the graph and cell type is indicated by a color code on the right. D and E) UMAPs are shown to demonstrate (D) all T cell subsets detected across the mixture of cells analyzed across all four treatments and (E) that within each of these subsets there are 15 separate clusters with unique transcriptional states. Cell types are indicated by color codes on the right, and clusters are numbered in E. CD4conv=conventional non-regulatory CD4 T cells, Regulatory_T_cell=regulatory CD4 T cells, T_Ki67=proliferating T cells, CD8_Tpexh=Progenitor exhausted CD8 T cells, CD8_Tnaive_memory=Naïve and memory CD8 T cells, Regulatory_T_cell=Regulatory CD4 T cells, CD8_Texh=Terminally exhausted CD8 T cells
FIGURE 4:
FIGURE 4:. scRNA-seq analysis reveals that the bispecific antibody induces an increased cytotoxic phenotype in CD8 T cells and NK cells and a decreased exhaustion and naivety phenotype in CD8 T cells:
A) Activation scores were generated by assessing a panel of 22 genes associated with NK cell activation. Box plots of the average scores for each treatment are shown with p-values on top generated using a one-tailed t-test compared to the isotype control. B) A heatmap demonstrating Z scores generated from mean expression in NK cells for genes related to cytotoxicity (cyt, top), activation, (act, second from top), metabolism (met, second from bottom), Myc signaling (Myc, third from bottom), and BRD1 (bottom) is shown comparing IgG, anti-PD-L1, anti-PD-1, and the bispecific antibody. C) The positive rate of Granzyme B (GZMB) expression across all treatments in all CD8 T cell populations combined is shown. D) A heatmap demonstrating Z scores generated from mean expression in all CD8 T cell populations combined for genes related to cytotoxicity (cyt, top), exhaustion (exh, second from top), naivety (nai, second from bottom), and BRD1 (bottom) is shown comparing IgG, anti-PD-L1, anti-PD-1 and the bispecific antibody.
FIGURE 5:
FIGURE 5:. scRNA-seq analysis reveals state changes in CD8 T cells between distinct subsets:
A) Definition of and percentage of CD8 T cells in naïve (CD8_Tnaive_memory), progenitor exhausted (CD8_Tpexh), and terminally exhausted (CD8_Texh) CD8 T cell groups (mapped in Figure 3D–E). On the top left is a bubble map demonstrating markers used to define these three groups. Markers (Y axis) used to define each of the different groups (X axis) are shown here along with the expression level in each defined cell type. The average expression level (colors) is shown in the percentage of cells (sphere) expressing each marker for each cell type. Bar graphs demonstrating the proportion of CD8 T cells in progenitor exhausted (top right), naïve (bottom left), and terminally exhausted (bottom right) CD8 T cell groups across antibody treatments are shown. B) Diffusion map demonstrating transition between 1) naïve (orange) and progenitor exhausted (red) cells, and 2) terminally exhausted (blue) and progenitor exhausted (red) cells over pseudotime. The X axis represents increasing activation, and the Y axis represents increasing exhaustion. The color code for the different clusters/subgroups is shown on the top right. C, D, E) Diffusion maps demonstrating transition between naïve and progenitor exhausted cells and terminally exhausted and progenitor exhausted cells (mapped in B) over pseudotime for C) the activation marker GZMB (Granzyme B), D) the naivety marker TCF7, and E) the exhaustion marker HAVCR2 (TIM3). The X axis represents increasing activation, and the Y axis represents increasing exhaustion. The color code for gene expression level is shown on the right. F and G) Activation scores were generated by assessing a panel of 50 genes associated with (F) GZMB (Granzyme B) or (G) IFNG expression in CD8 T cells in naïve and progenitor exhausted CD8 T cells. Box plots of the average scores for each treatment are shown with p-values compared to the IgG control for (F) GZMB and (G) IFNG. H and I) Exhaustion scores were generated by assessing a panel of 50 genes associated with (H) HAVCR2 (TIM3) expression or (I) PDCD1 (PD-1) expression in CD8 T cells in both naïve and progenitor exhausted cells. Box plots of the average scores for each treatment are shown with p-values compared to the control for (H) HAVCR2 and (I) PDCD1. All p-values were generated using a one-tailed t-test.
FIGURE 6:
FIGURE 6:. The bispecific antibody acts, in part, through strongly depleting BRD1 expression leading to increased immune activity through activation and state changes in T and NK cells:
A) BRD1 expression was analyzed across different treatment groups from the scRNA-seq experiment (Figure 3) for NK cells. Bar graph demonstrating the expression level of BRD1 in NK cells for each ICB antibody compared to the IgG control. p-values were generated using a one-tailed t-test. B) To verify the BRD1 depletion induced by the bispecific antibody in NK cells, another organoid co-culture from an untreated HGSC patient (–35) was treated with isotype control, anti-PD-1, anti-PD-L1, or anti-PD-1/PD-L1. NK cells were sorted from the treated cultures at the 96 hour timepoint and sent for bulk RNA sequencing. The BRD1 expression across treatments is shown here as transcripts per million (TPM). p-values were generated using a one-tailed t-test. C) BRD1 expression was analyzed across different treatment groups from the scRNA-seq experiment (Figure 3) for the naïve and progenitor exhausted CD8 T cell subgroups combined. Shown here is a bar graph demonstrating the expression level of BRD1 in the combined ICB responsive naïve and progenitor exhausted CD8 T cells compared to the IgG control. p-values were generated using a one-tailed t-test. D) Diffusion map demonstrating BRD1 expression in CD8 T cell subgroups transitioning between naïve and progenitor exhausted CD8s and terminally exhausted and progenitor exhausted CD8s (mapped in Figure 5B). The X axis represents increasing activation, and the Y axis represents increasing exhaustion. The color code for gene expression level is shown on the right. E) The same organoid co-culture from figure 6B (–35) was treated with isotype control, anti-PD-1, anti-PD-L1, or anti-PD-1/PD-L1 combined with either DMSO (blue) or the BRD1 inhibitor BAY-299 (orange). The co-culture media supernatants underwent IFNγ ELISA analysis shown here as the average pg/mL of IFNγ for the treatment with error bars representing standard error. **p<0.005 F and G) The treated organoid co-cultures from Figure 6B and 6E underwent flow cytometry analysis for PD-1 and TIM3 single positive and double positive cells. Only the IgG and PD-L1 treated cultures could be analyzed here because the anti-PD-1 and bispecific antibody treated co-cultures show decreased PD-1 due to the treatment antibody blocking the flow antibody. F) The flow quadrant plots for IgG+DMSO and IgG+BAY-299 are shown for CD8 T cells on the top. PD-1 is on the Y axis and TIM3 is on the X axis. The percentage of PD-1 (Q1) and TIM3 (Q3) single positive and double positive (Q2) CD8 T cells is shown on the bottom as a percent of CD45 positive cells. Error bars represent standard error across two replicates. G) The flow quadrant plots for IgG+DMSO and IgG+BAY-299 are shown for NK cells on the top. PD-1 is on the Y axis and TIM3 is on the X axis. The percentage of PD-1 (Q1) and TIM3 (Q3) single positive and double positive (Q2) NK cells is shown on the bottom as a percent of CD45 positive cells. Error bars represent standard error across two replicates.
Figure 7:
Figure 7:. A BRD1 inhibitor causes increased anti-tumor immunity in HGSC by altering immune cell chromatin state:
A) ATAC-seq was performed in duplicate on KHYG1 cells treated with either vehicle or BAY-299. Aggregated reads within 1kb on either side of center for up (blue) and down (green) differentially accessible chromatin sites for the two replicates for DMSO (top) and BAY-299 (bottom) treated cells are shown here. B) The transcription factors (TF) associated with the most strongly altered up (right red) and down (left blue) peaks are shown here. The Y axis represents rank of the transcription factor from 1 (highest rank at top) to 30 (lowest rank at bottom) for number of overlapping sites, and the X axis represents the overlap score increasing from left to right for up peaks and right to left for down peaks. Highest ranking TFs are on the top left for down peaks and top right for up peaks. C) Chromatin peaks surrounding and within the EMB (top) and CDK9 (bottom) genomic locus for DMSO treated KHYG1 cells (top in each panel) and BAY-299 treated KHYG1 cells (bottom in each panel). The taller the peak the more open the chromatin. The scale for peak size is on the y-axis and the x axis represents location in the genome. D) KHYG1 cells treated with DMSO vehicle or BAY-299 (299) were plated either alone or in co-culture with OVCAR8 (OV8) tumor cells, and the media was subsequently tested for IFNγ presence by ELISA. Bar graphs for the ELISA for KHYG1 cells alone is shown on the left and for the co-cultures on the right. The error bars represent the standard deviation between three replicates of the experiment *=p<0.05 using a paired t-test. E) KHYG1 cells treated with vehicle DMSO or BAY-299 (299) were plated either alone or in co-culture with OVCAR8 (OV8) tumor cells, and the cultures were analyzed by flow cytometry for NK cell CD107A expression (left), IFNγ expression (middle), and IFNγ/Ki67co-expression (right). Error bars represent standard deviation between 3–4 replicates. *=p<0.05 using a paired t-test. F) KHYG1 cells treated with DMSO vehicle or BAY-299 (299) were plated in co-culture with OVCAR8 (OV8) tumor cells, and six hours later the OVCAR8 cells were analyzed for apoptotic death. The percentage of non-viable apoptotic cells (Apotracker+ Dead Cells) from three separate experiments is shown here for each group with error bars representing standard deviation. *=p<0.05 using a paired t-test. G) A schematic of the in vivo experiment is shown in the top panel. In the bottom panel, gross images of the tumor burden in vehicle and BAY-299 treated mice are shown with white arrows pointing to solid tumor deposits on the peritoneum and bowel. The animals shown are representative of the most common tumor burden levels in each group. H) Grossly visible solid tumors were dissected from each mouse in each group, and a photo of tumor volume is shown in the top panel. Solid tumors from each animal were placed in a well of a six well plate for visual volume scoring. A three represents high tumor burden, a two medium tumor burden, a one limited tumor burden, and a zero no tumor burden. Numbers are placed in representative 3, 2, 1, and 0 wells, and an X is placed in empty wells. In the bottom panel, the tumor volume scores are shown for all ten animals per group in a bar graph with error bars representing standard error of the mean (SEM). I) Ascites was aspirated from each animal and the volume measured. The top panel represents a bar graph of the ascites volumes for all animals in each group with the error bars representing SEM. The bottom panel shows the individual animal ascites volumes with the numeric tumor volume score for each animal over the volume bar. Black and blue lines mark the vehicle (V) and treatment (T) groups most common volume and tumor burdens. J) Solid tumors were harvested from each animal in both the vehicle and treatment groups. For each treatment group, the tumors for 3–4 animals were combined. There were only enough cells from two combined groups each for vehicle and BAY-299 to perform flow analysis. The single cell suspensions of the solid tumors were analyzed for T and NK composition which is shown here. Each color represents a cell type and each bar represents a group. The color code is at the top left. K) PD-1 expression was analyzed in both solid tumor treatment groups on NK-1.1+ NK cells (top left), NKp46+ NK cells (top right), and CD8 T cells (bottom), and the percent of PD-1+ T or NK cells for each treatment group is shown here as a percentage of CD45+ cells. Error bars represent standard deviation. *=p<0.05 generated using an unpaired t-test, NS=not significant with an unpaired t-test.

References

    1. Siegel RL, Miller KD, Jemal A. Cancer statistics, 2019. CA Cancer J Clin 2019;69:7–34 - PubMed
    1. Narod S Can advanced-stage ovarian cancer be cured? Nat Rev Clin Oncol 2016;13:255–61 - PubMed
    1. Ghisoni E, Imbimbo M, Zimmermann S, Valabrega G. Ovarian Cancer Immunotherapy: Turning up the Heat. Int J Mol Sci 2019;20 - PMC - PubMed
    1. Odunsi K Immunotherapy in ovarian cancer. Ann Oncol 2017;28:viii1–viii7 - PMC - PubMed
    1. Thorsson V, Gibbs DL, Brown SD, Wolf D, Bortone DS, Ou Yang TH, et al. The Immune Landscape of Cancer. Immunity 2018;48:812–30 e14 - PMC - PubMed

Publication types

MeSH terms