. 2021 Feb;11(2):362-383.
doi: 10.1158/2159-8290.CD-20-0455. Epub 2020 Nov 6.

Genetically Defined, Syngeneic Organoid Platform for Developing Combination Therapies for Ovarian Cancer

Affiliations

Genetically Defined, Syngeneic Organoid Platform for Developing Combination Therapies for Ovarian Cancer

Shuang Zhang et al. Cancer Discov. 2021 Feb.

Abstract

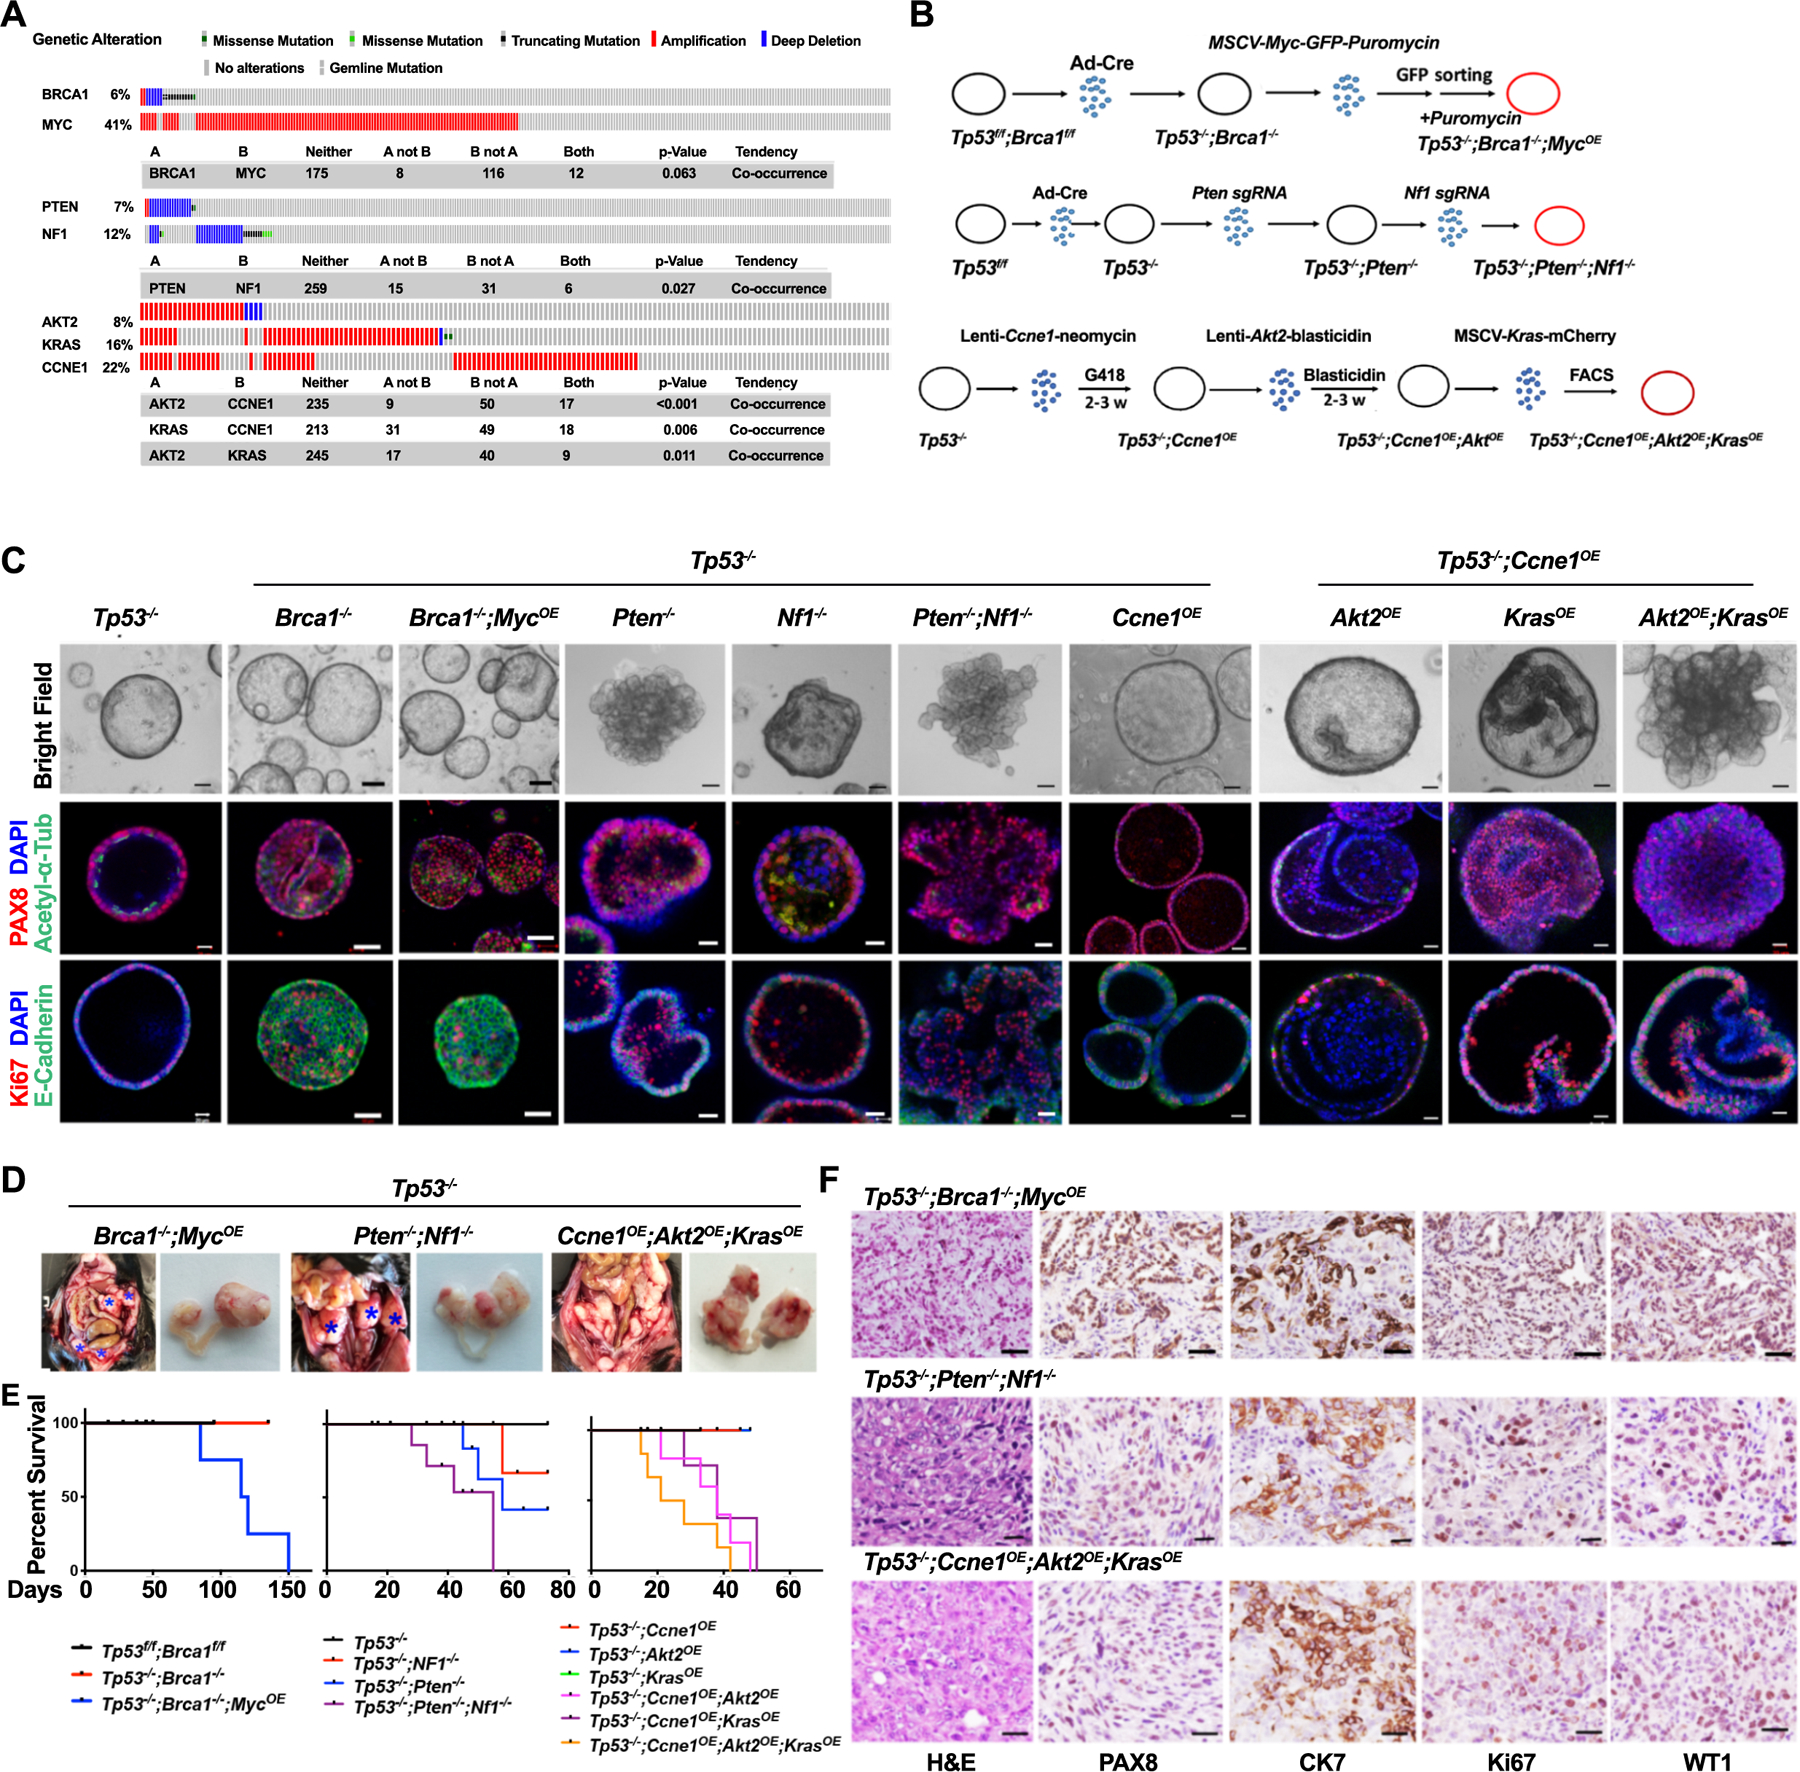
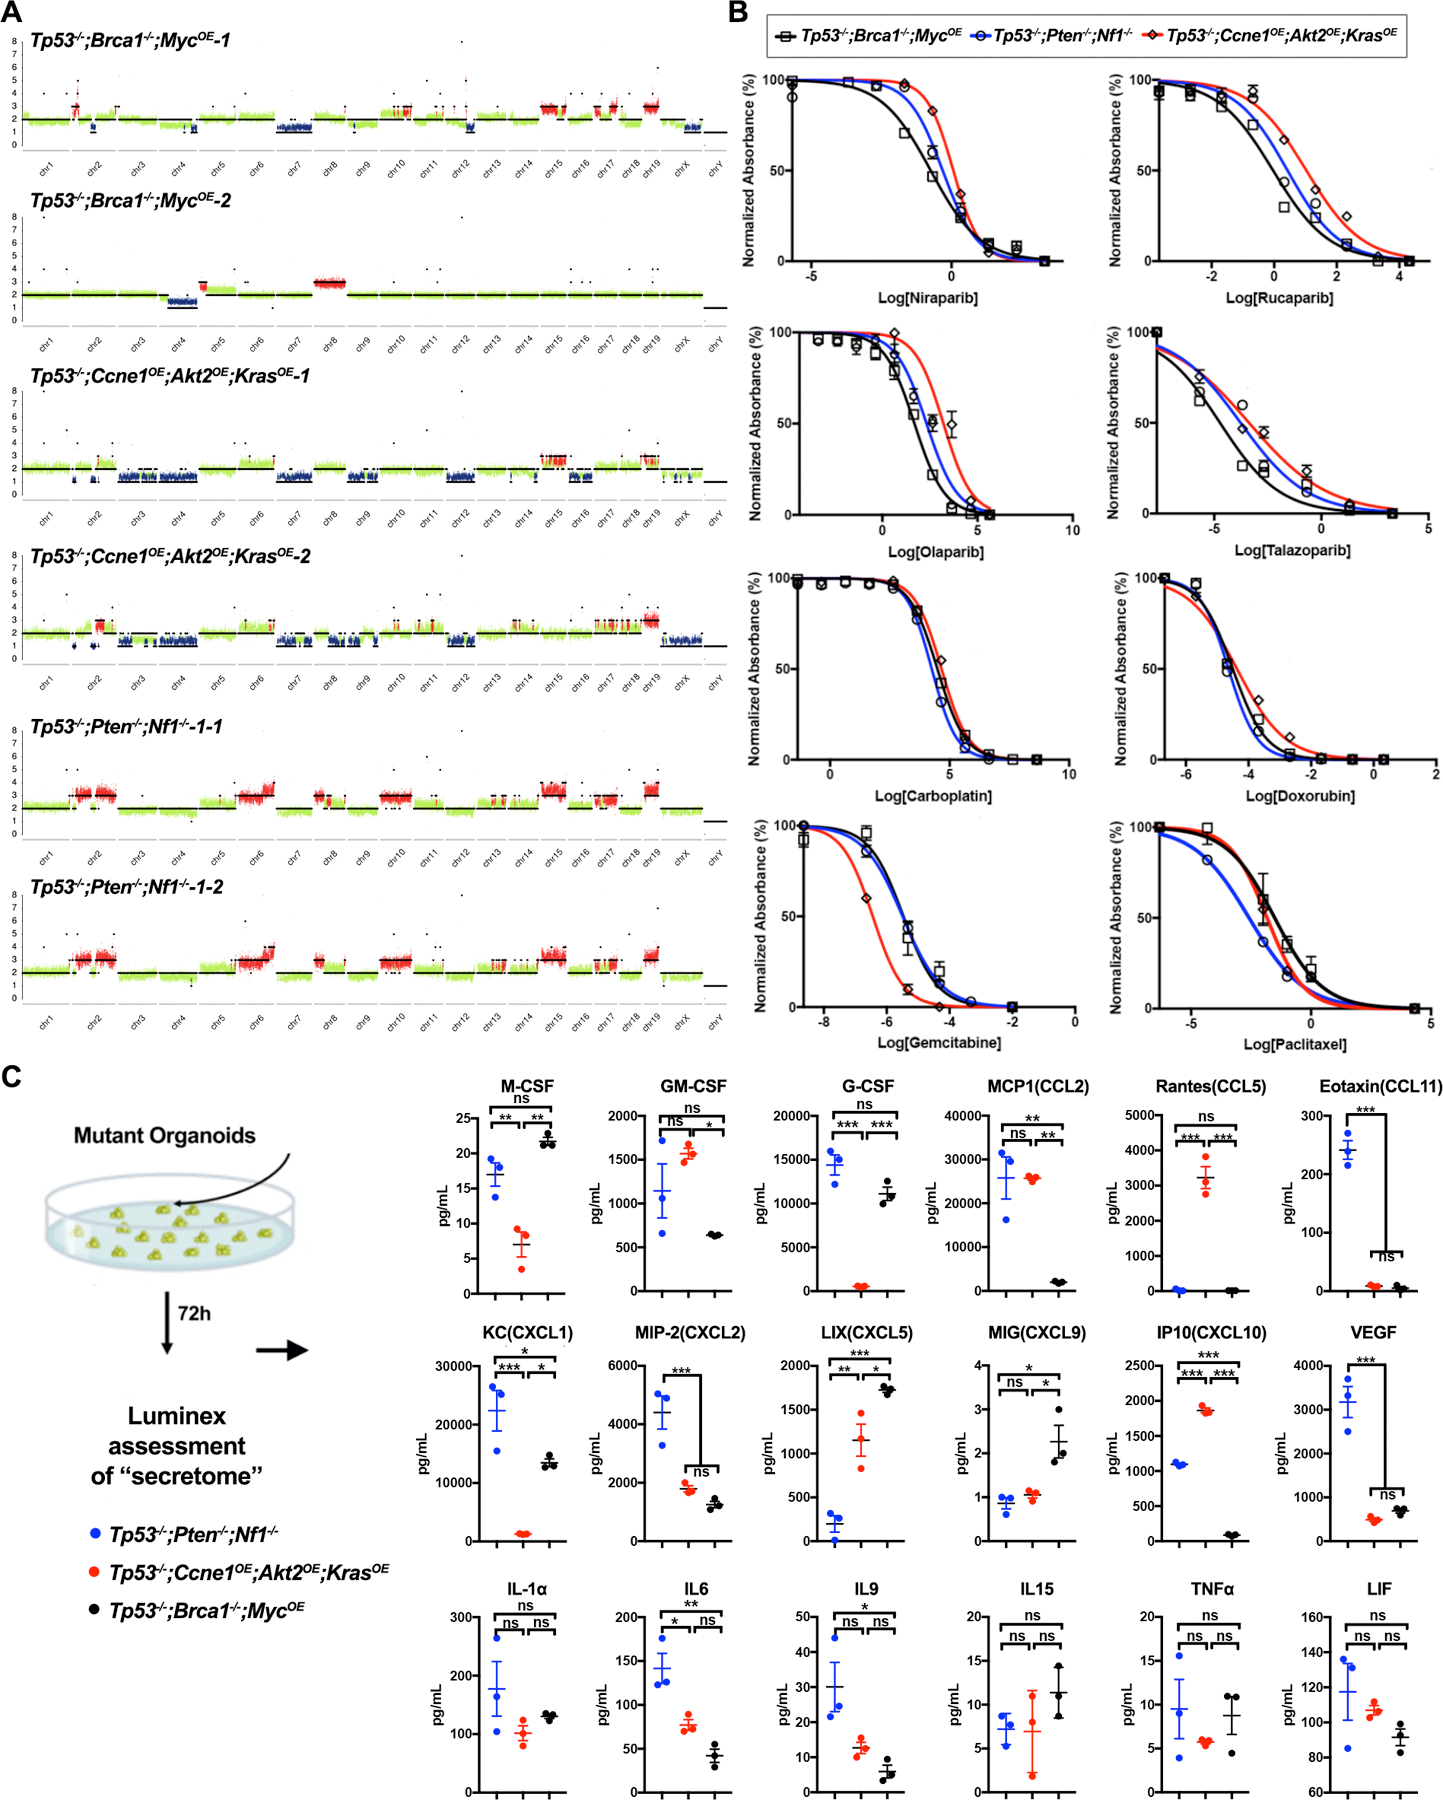
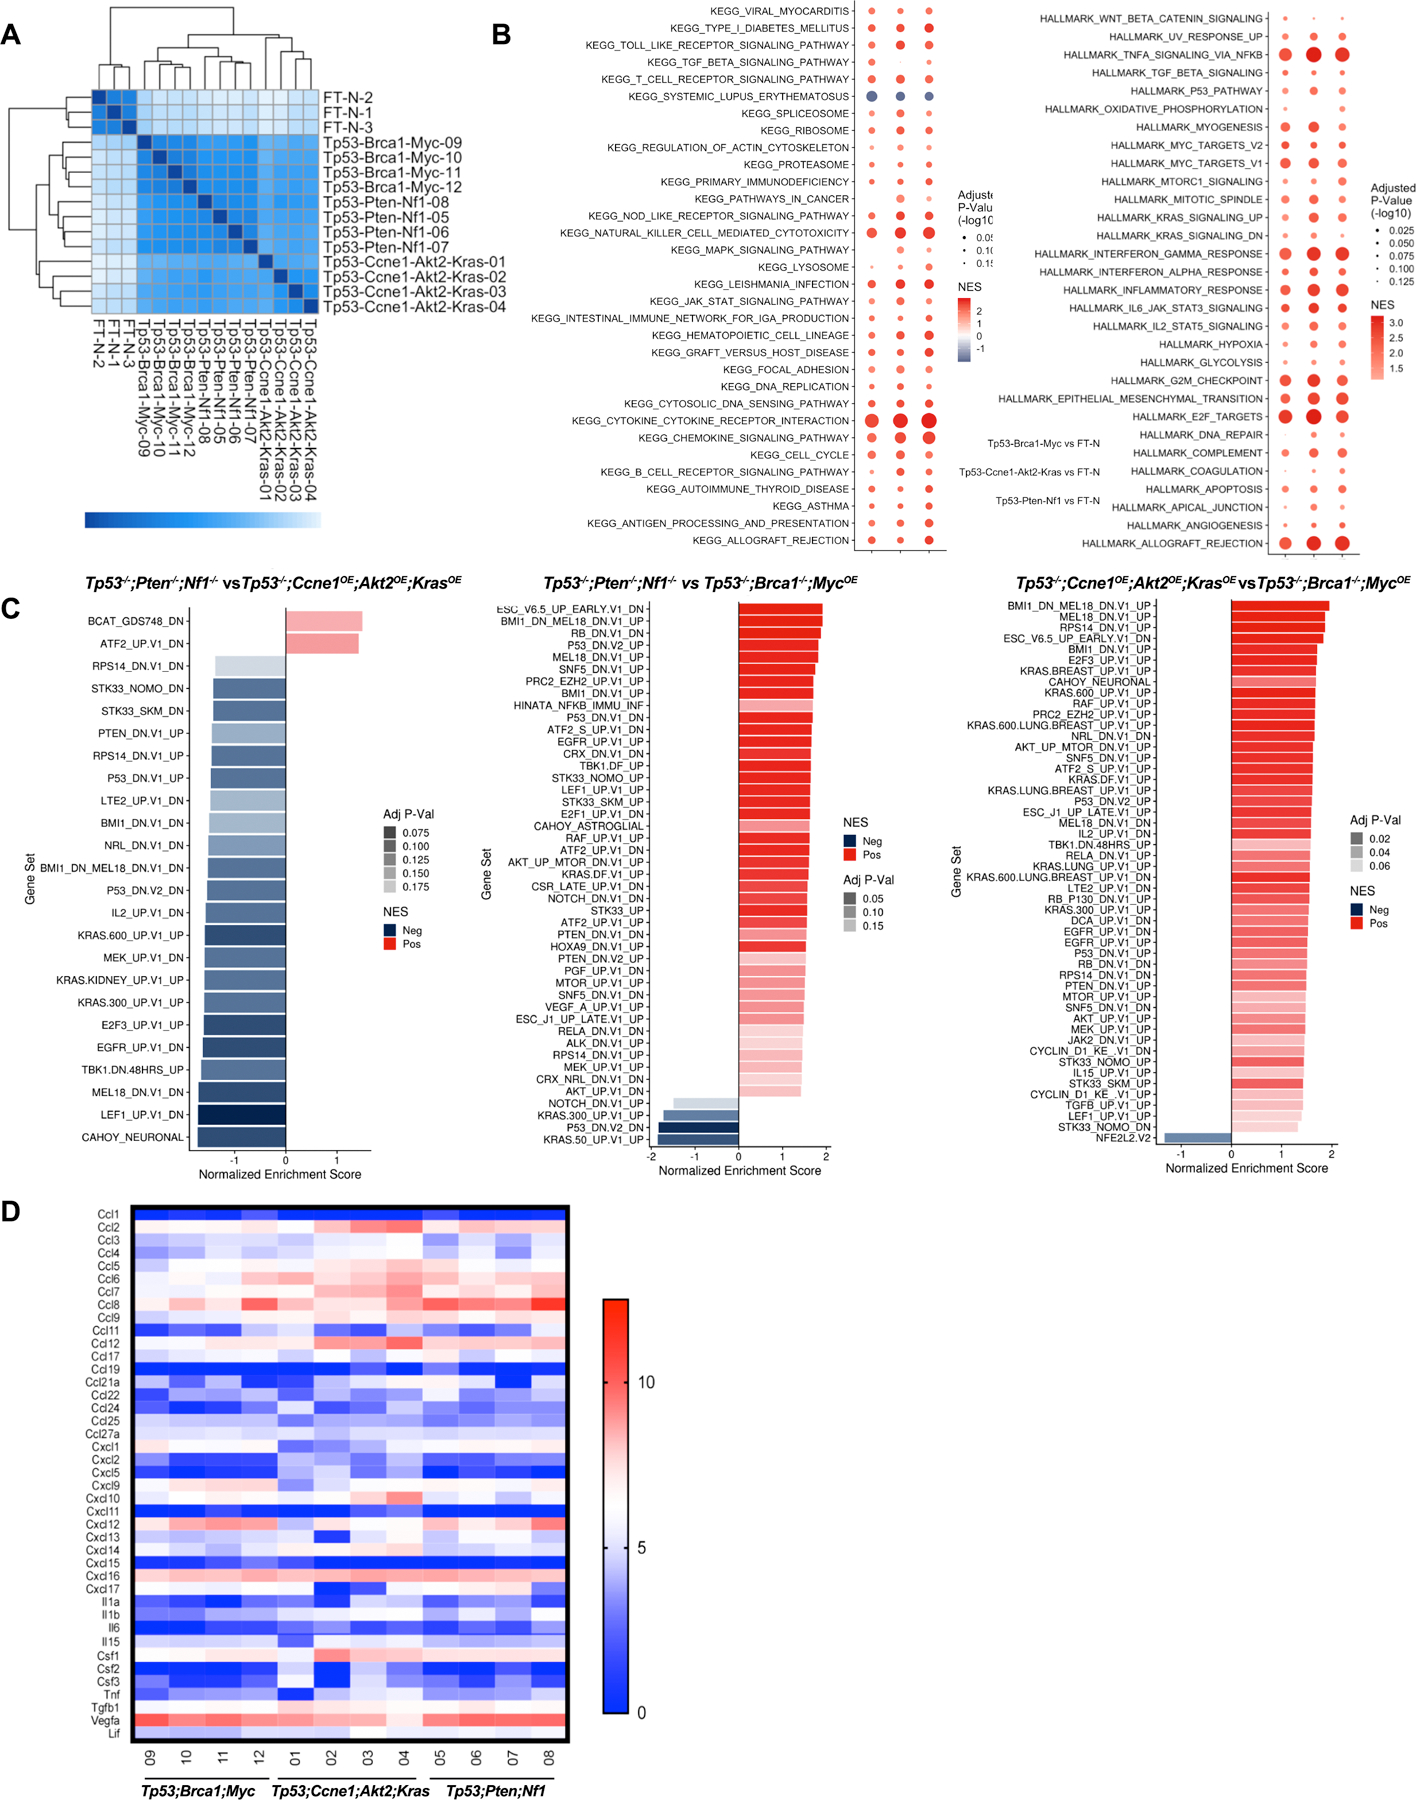
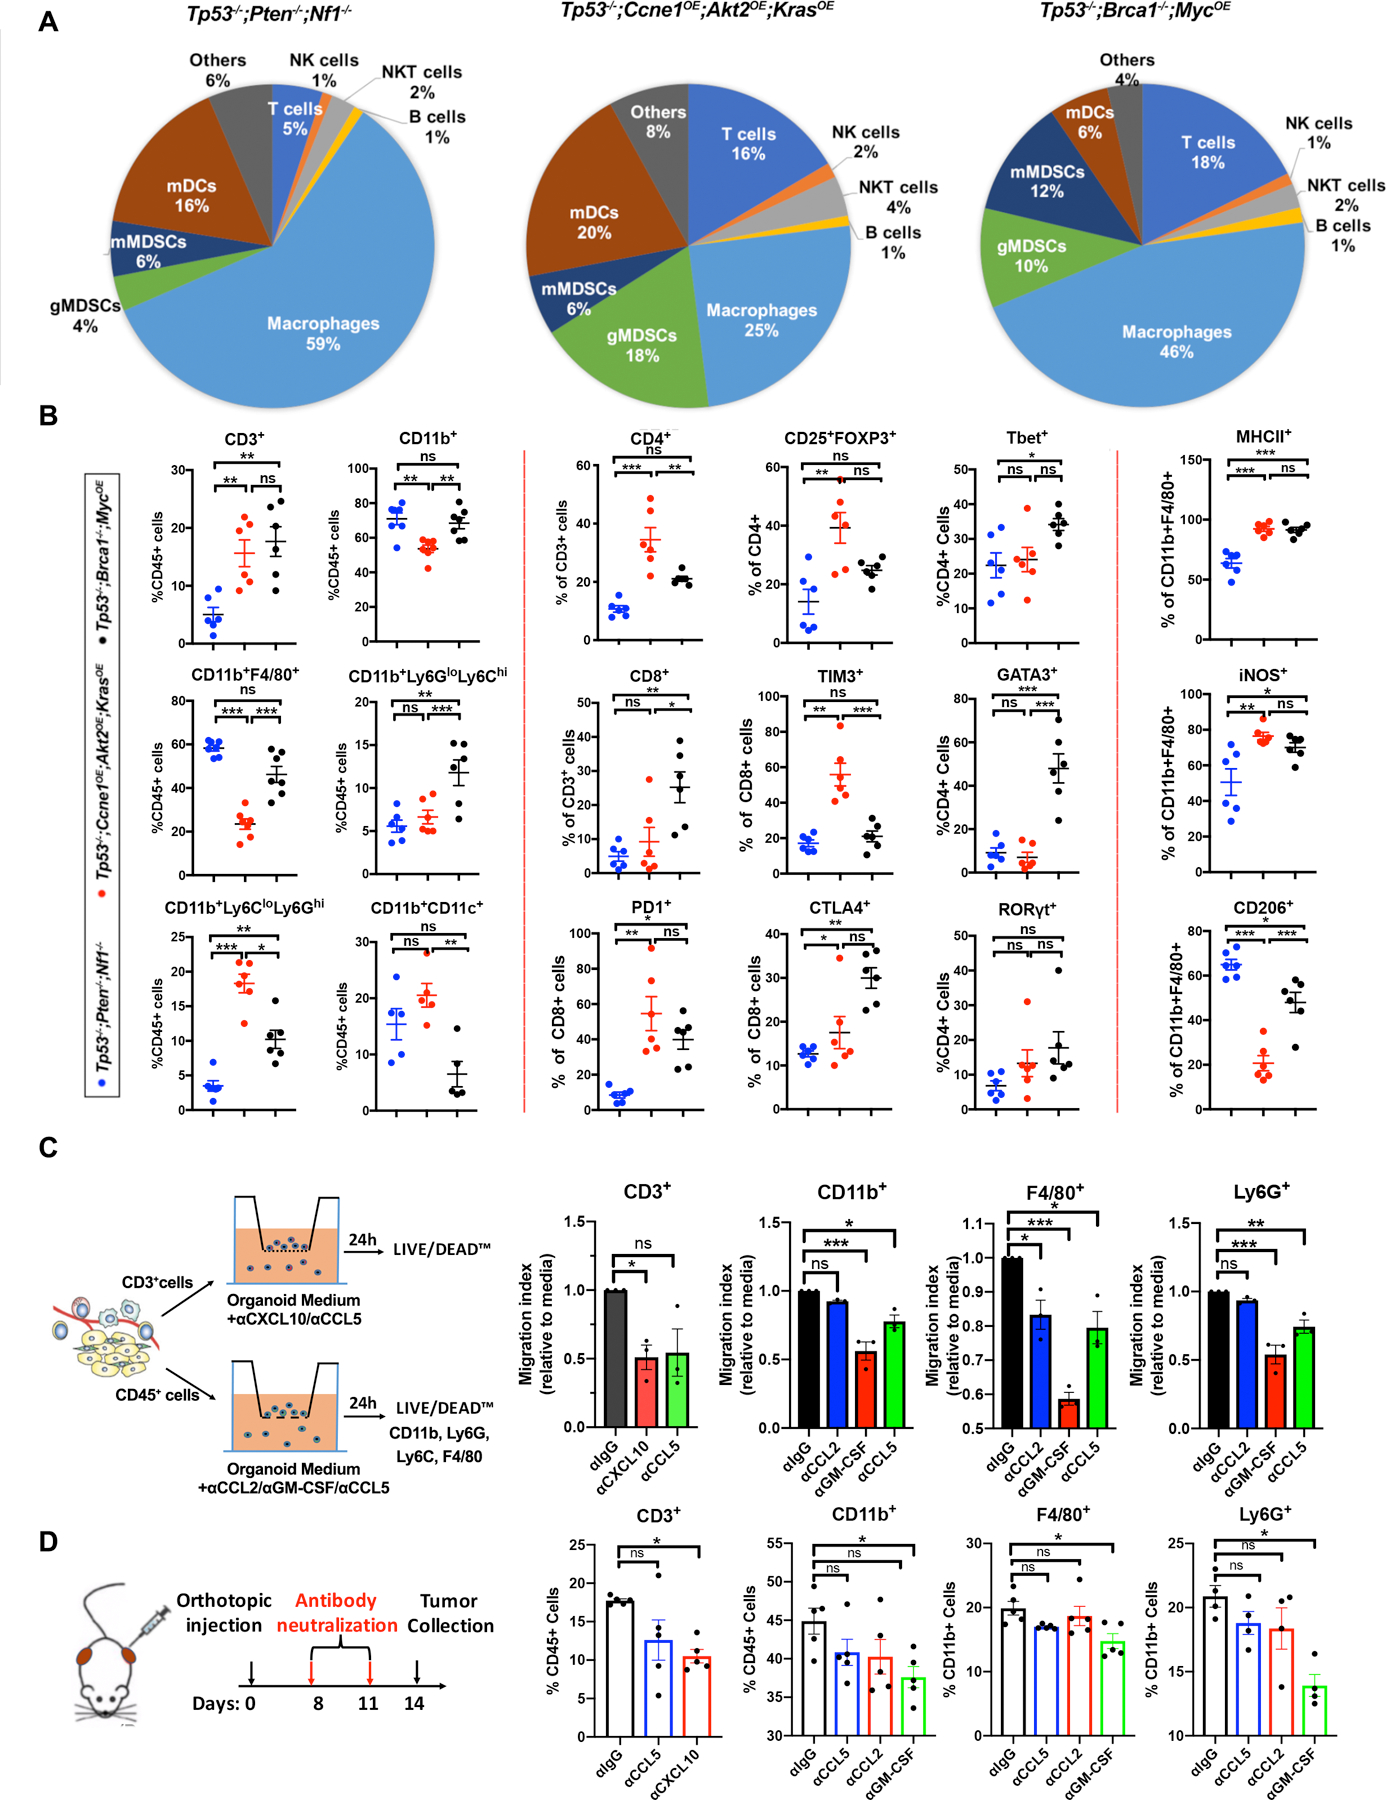
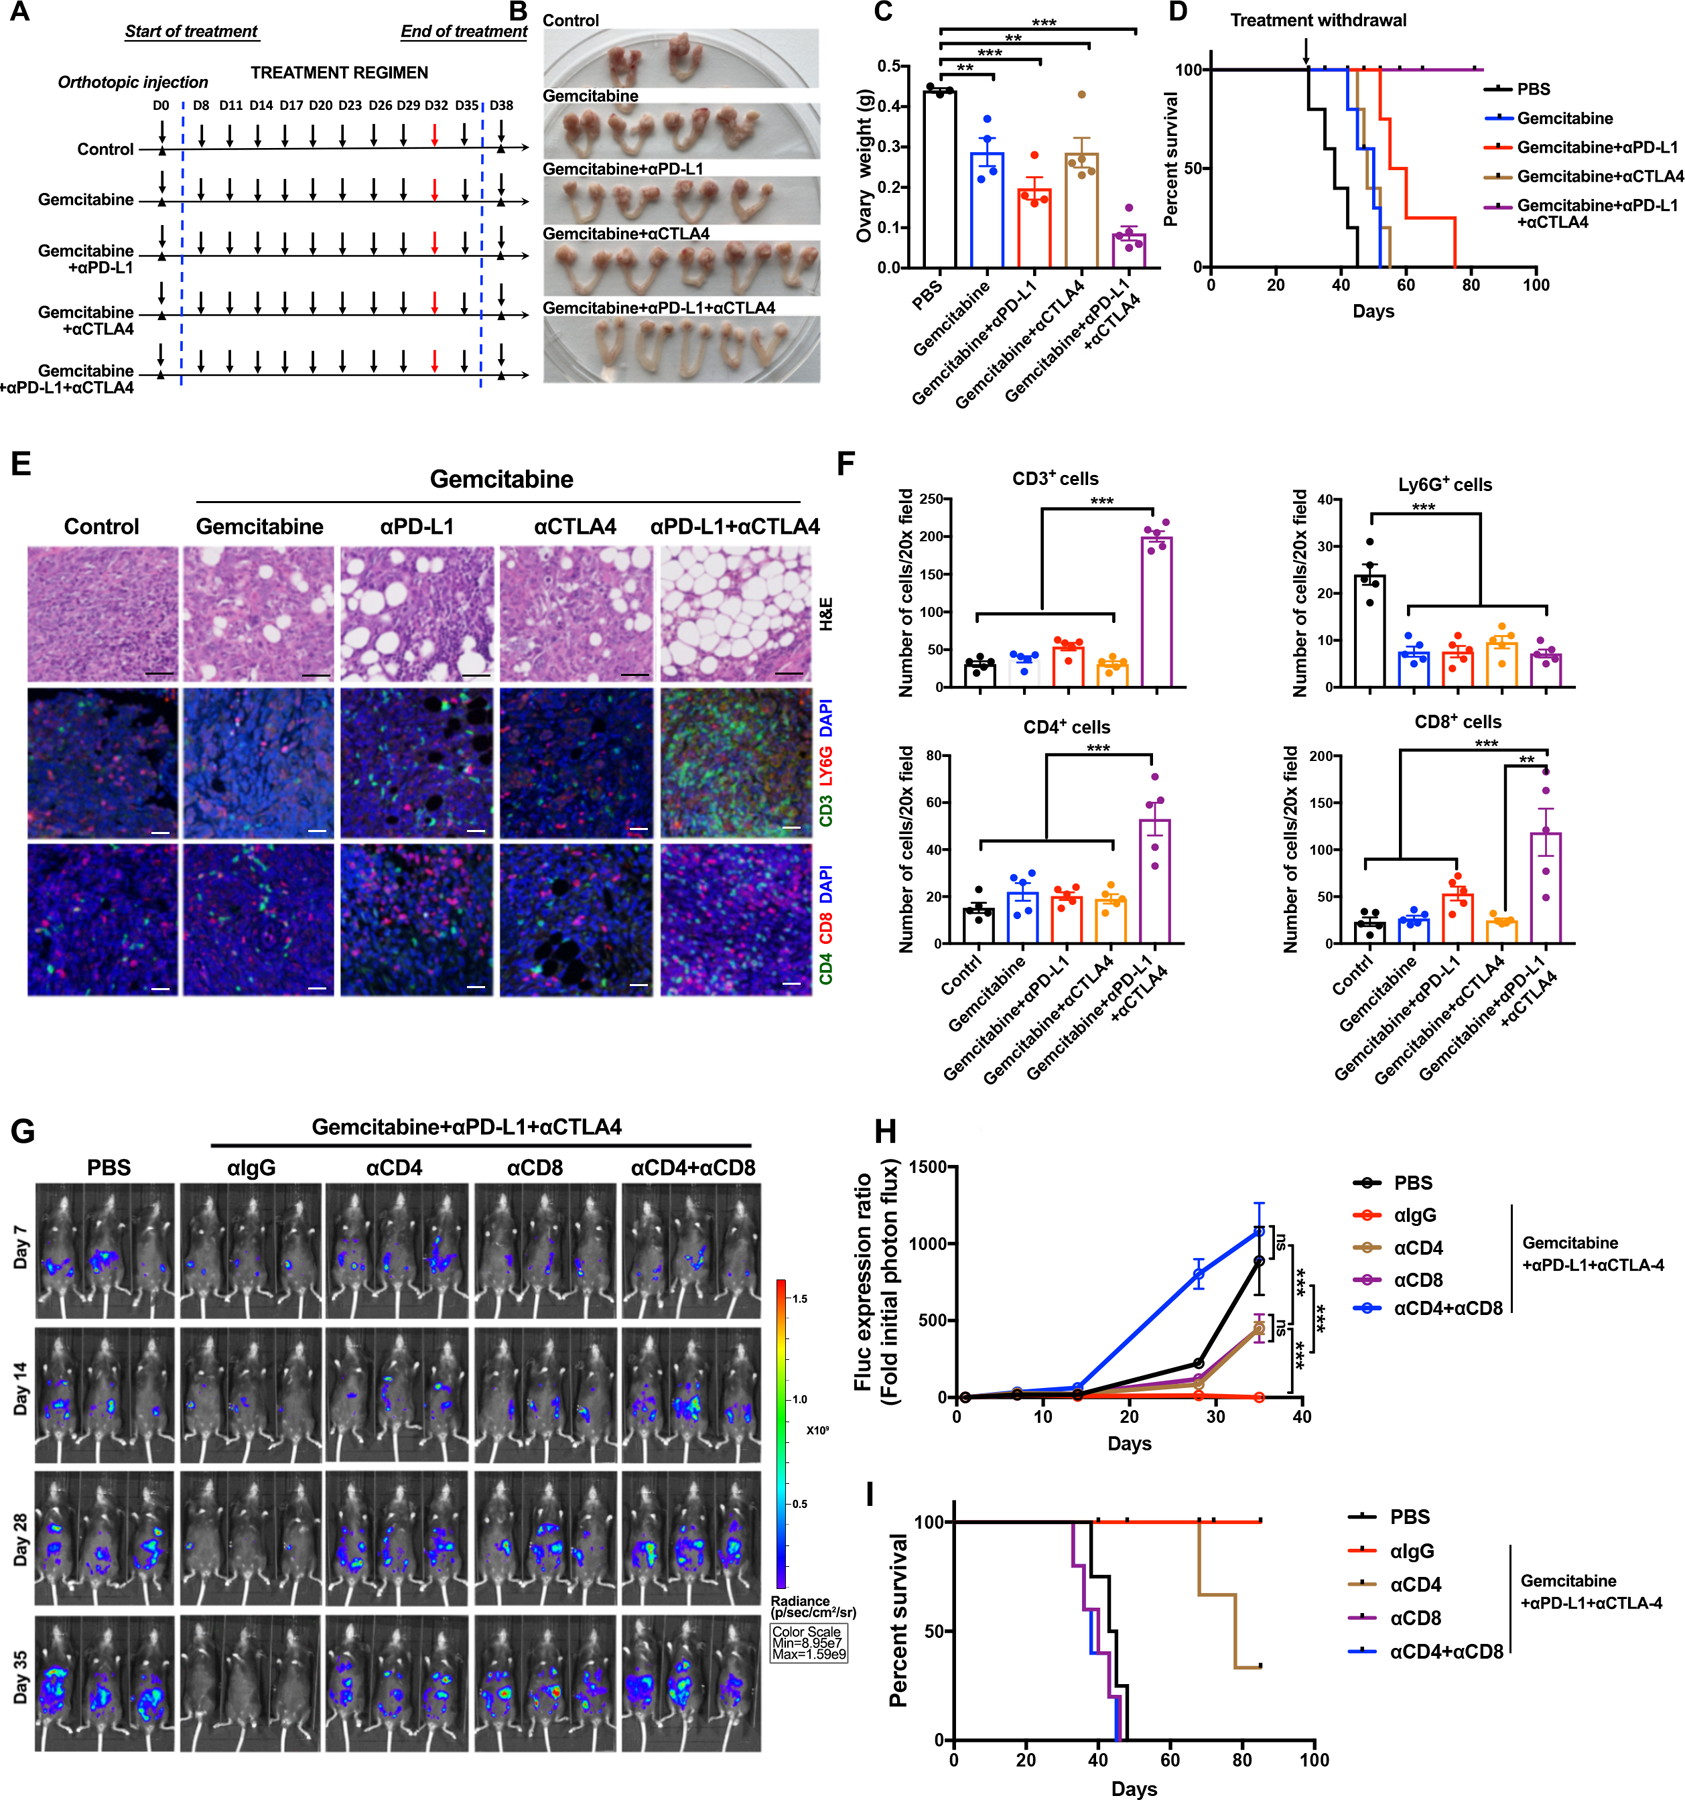
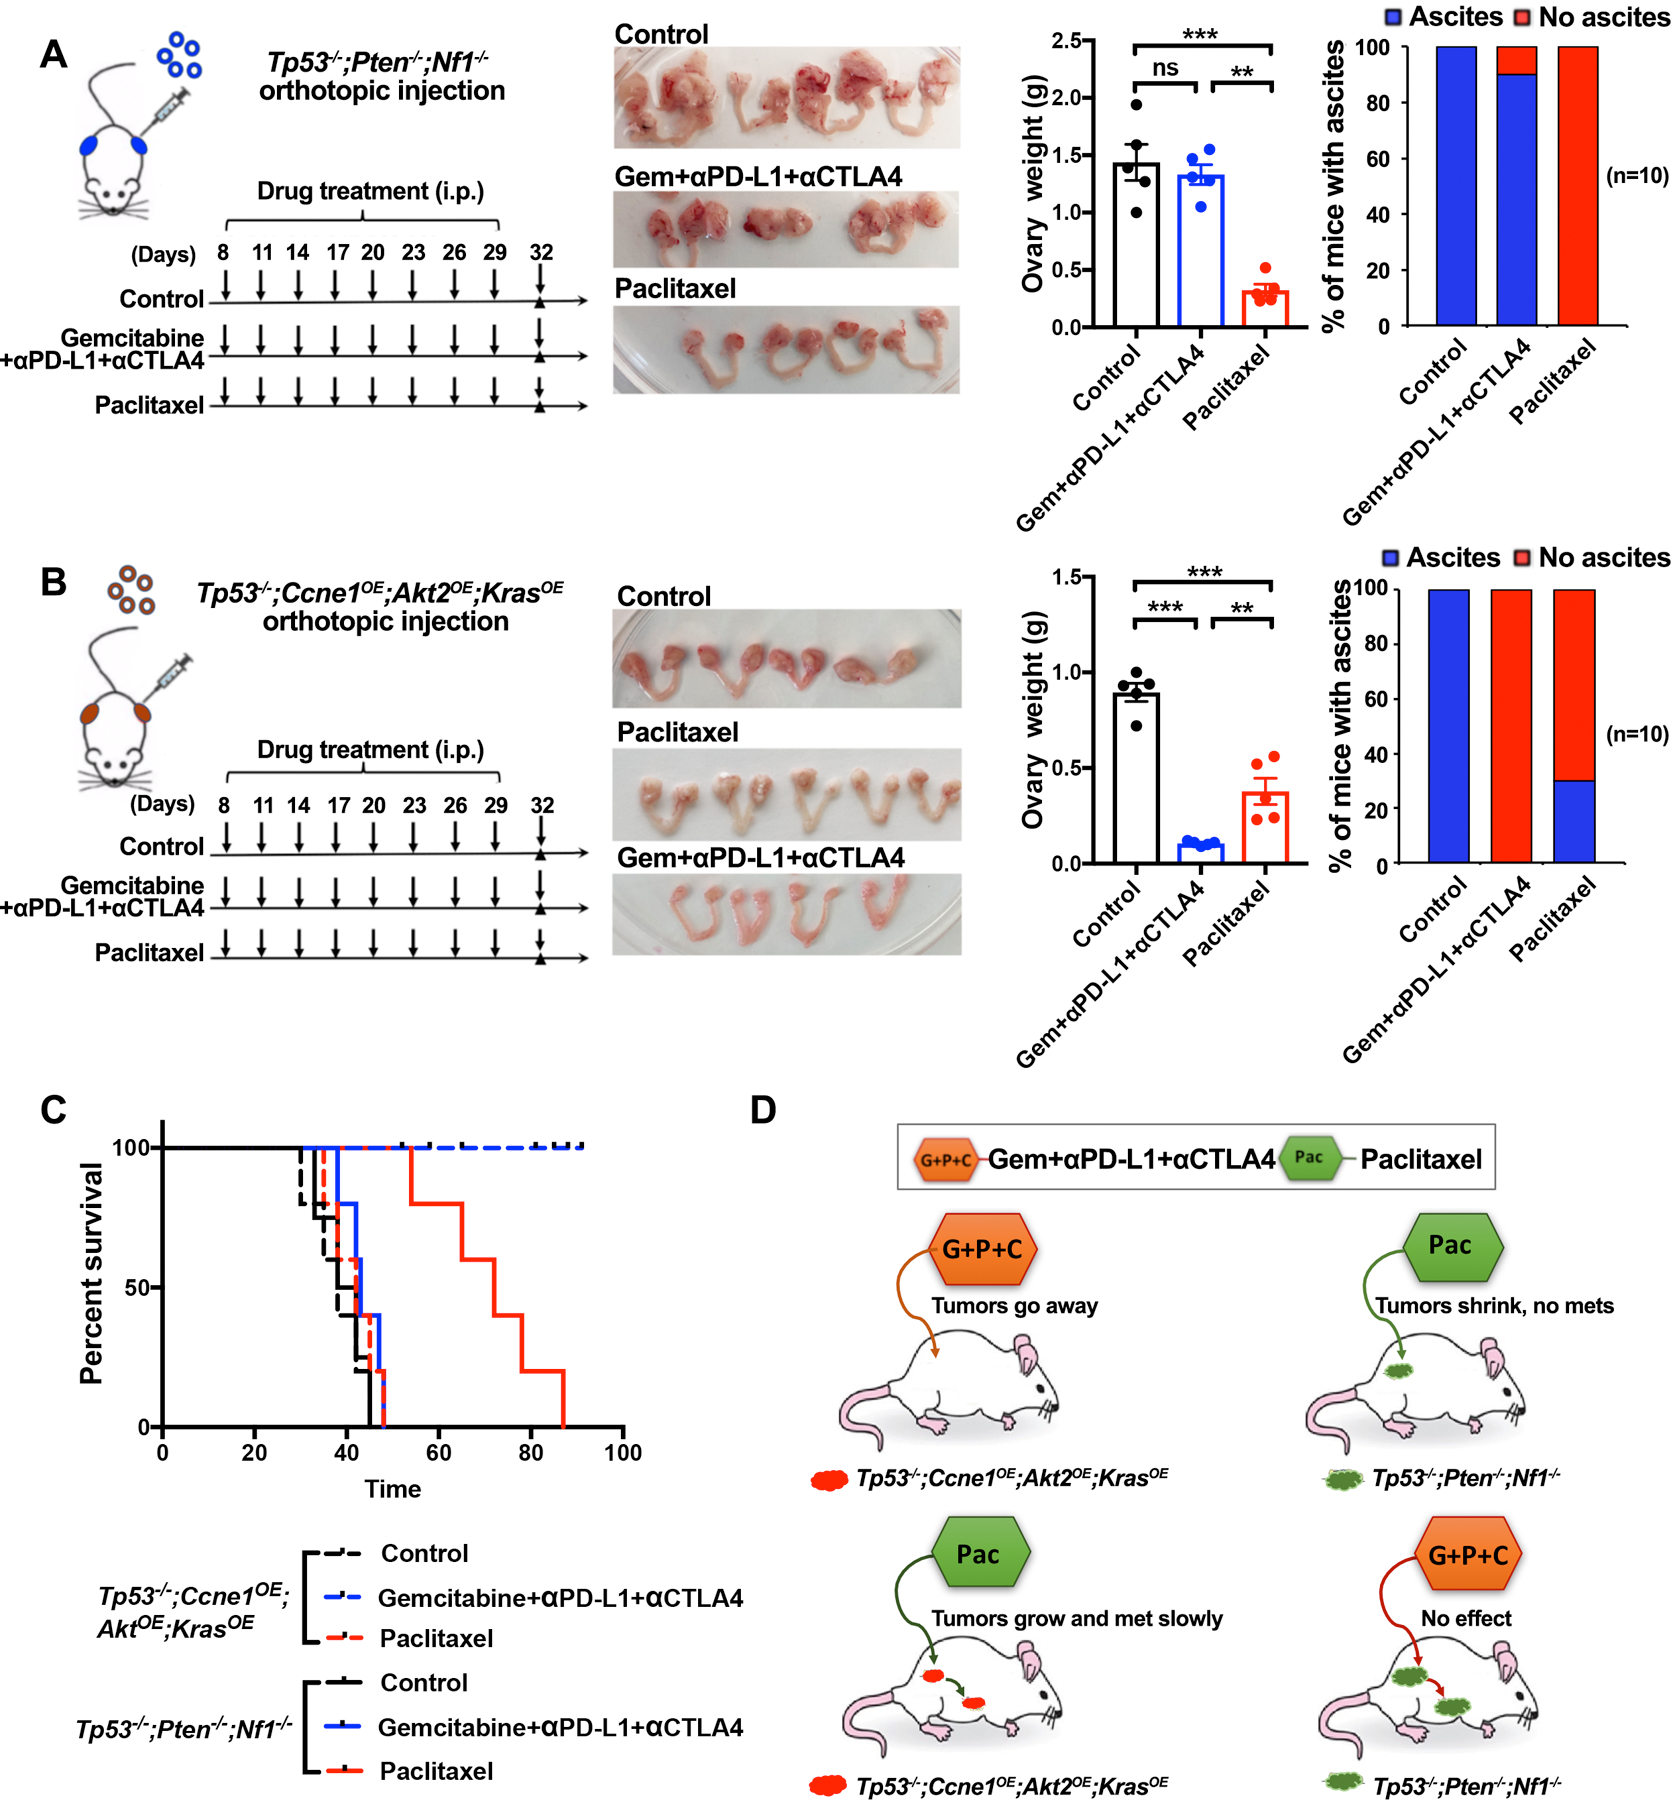
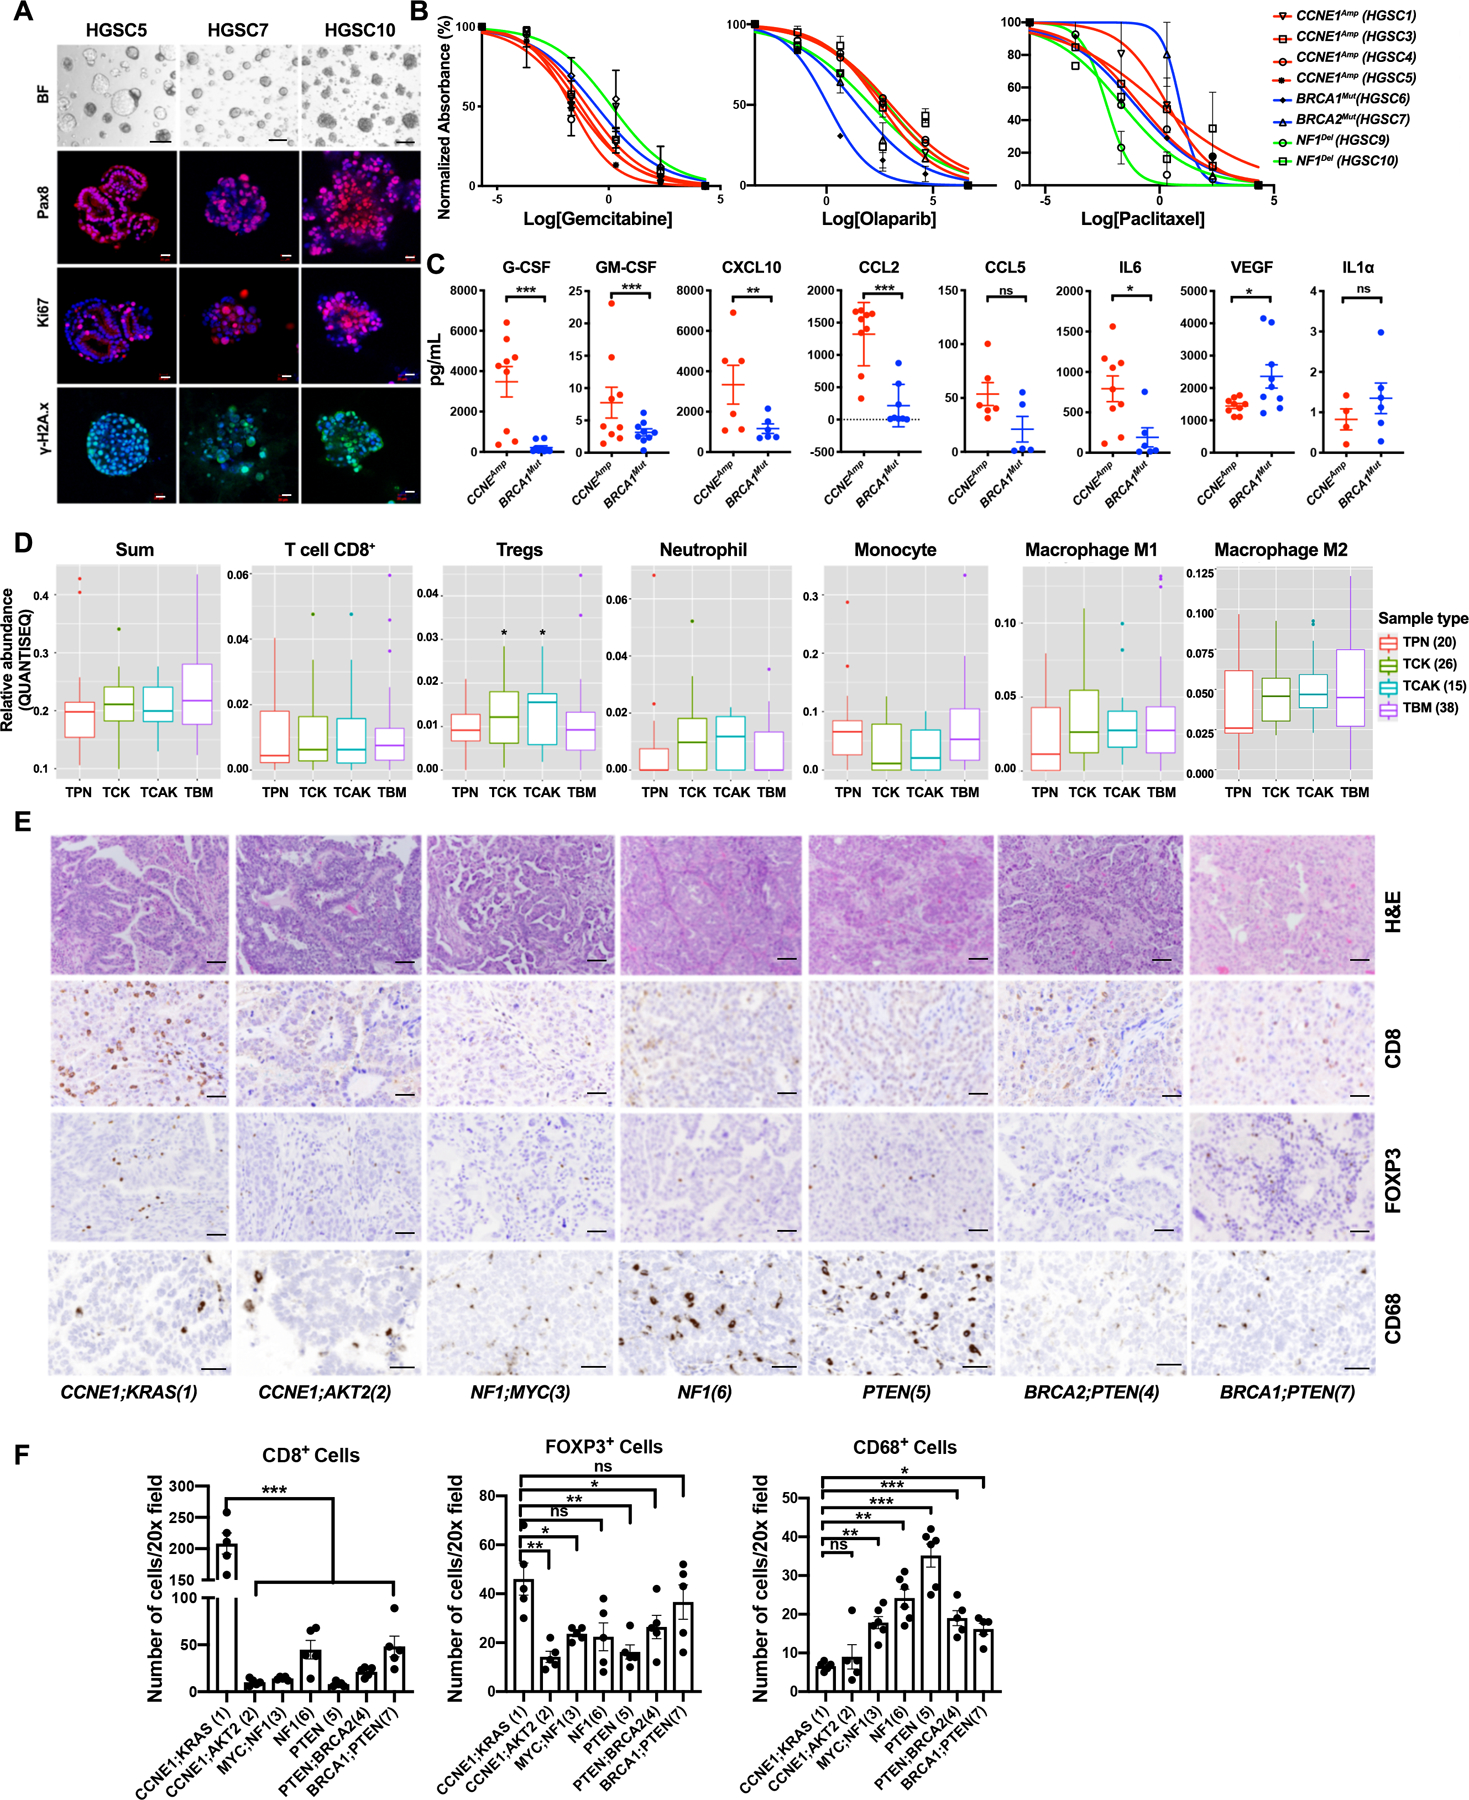
The paucity of genetically informed, immunocompetent tumor models impedes evaluation of conventional, targeted, and immune therapies. By engineering mouse fallopian tube epithelial organoids using lentiviral gene transduction and/or CRISPR/Cas9 mutagenesis, we generated multiple high-grade serous tubo-ovarian cancer (HGSC) models exhibiting mutational combinations seen in patients with HGSC. Detailed analysis of homologous recombination (HR)-proficient (Trp53-/-;Ccne1OE;Akt2OE;KrasOE ), HR-deficient (Trp53-/-;Brca1-/-;MycOE ), and unclassified (Trp53-/-;Pten-/-;Nf1-/- ) organoids revealed differences in in vitro properties (proliferation, differentiation, and "secretome"), copy-number aberrations, and tumorigenicity. Tumorigenic organoids had variable sensitivity to HGSC chemotherapeutics, and evoked distinct immune microenvironments that could be modulated by neutralizing organoid-produced chemokines/cytokines. These findings enabled development of a chemotherapy/immunotherapy regimen that yielded durable, T cell-dependent responses in Trp53-/-;Ccne1OE;Akt2OE;Kras HGSC; in contrast, Trp53-/-;Pten-/-;Nf1-/- tumors failed to respond. Mouse and human HGSC models showed genotype-dependent similarities in chemosensitivity, secretome, and immune microenvironment. Genotype-informed, syngeneic organoid models could provide a platform for the rapid evaluation of tumor biology and therapeutics. SIGNIFICANCE: The lack of genetically informed, diverse, immunocompetent models poses a major barrier to therapeutic development for many malignancies. Using engineered fallopian tube organoids to study the cell-autonomous and cell-nonautonomous effects of specific combinations of mutations found in HGSC, we suggest an effective combination treatment for the currently intractable CCNE1-amplified subgroup.This article is highlighted in the In This Issue feature, p. 211.


Conflict of interest statement

Competing interests: B.G.N. is a co-founder, holds equity in, and received consulting fees from Navire Pharmaceuticals and Northern Biologics, Inc. He also is a member of the Scientific Advisory Board and receives consulting fees and equity from Avrinas, Inc, and was an expert witness for the Johnson and Johnson ovarian cancer talc litigation in US Federal Court. His spouse has or held equity in Amgen, Inc., Regeneron, Moderna, Inc., Gilead Sciences, Inc., and Arvinas, Inc. D.A.L has consulting/advisory role for Tesaro/GSK, Merck, receives research funding to institution from Merck, Tesaro, Clovis Oncology, Regeneron, Agenus, Takeda, Immunogen, VBL Therapeutics, Genentech, Celsion, Ambry, Splash Pharmaceuticals. He also is a founder of Nirova BioSense, Inc. The other authors declare no competing interests.

Figures

Figure 1.
Figure 1.
Generation of tumorigenic organoids. A, OncoPrint showing selected genetic alterations and co-occurrence of the indicated abnormalities in human HGSC (TCGA, Firehose Legacy). B, Schematic showing approach for generating tumorigenic organoids from parental Tp53f/f;Brca1f/f or Tp53f/f FTE organoids. C, Representative bright field images and immunofluorescence staining of organoids after 7 days in culture. Scale bars: 20 μm. D, Exposed abdomens (right panels) and dissected genital tracts (right panels) of mice bearing organoid-derived tumors of the indicated genotypes; asterisks indicate large metastatic deposits. E, K–M curves of mice following orthotopic injection of 2X10⁶ organoid cells of the indicated genotypes, n=6/group. F, H&E-stained sections and immunohistochemical analysis for the HGSC markers PAX8, CK7 (Cytokeratin 7), Ki67, and WT1 (Wilms’ Tumor 1) in representative sections from the indicated ovarian tumors. Scale bars: 50 μm. See also Supplementary Figs. S1 and S2.
Figure 2.
Figure 2.
Genotype affects organoid copy number alterations, drug sensitivity, and secretome. A, Shallow WGS (sWGS) of the indicated tumorigenic organoids. Two independent clones are shown for Tp53−/−;Brca1−/−;MycOE and Tp53−/−;Ccne1OE;Akt2OE;KrasOE organoids, respectively, the same Tp53−/−;Pten−/−;Nf1−/− organoid clone at two different times is shown. Copy number losses and gains are shown in blue and red, respectively. B, Dose-response curves for the indicated drugs in tumorigenic organoid lines of different genotypes. Cell viability was calculated relative to 0.01% DMSO-treated control cells, measured after 5 days of treatment. C, Levels of the indicated cytokines, chemokines, and growth factors from 72 hr-conditioned media from the indicated tumorigenic organoids. Only secreted factors that are detectable and differ between groups are shown. Error bars indicate ± SEM; **P<0.01, ***P<0.001, 2-way ANOVA. See also Supplementary Fig. S3.
Figure 3.
Figure 3.
Tumors derived from organoids with different genotypes have distinct transcriptomes. A,Heat map showing sample distances by hierarchical clustering, based on variance stabilized expression levels of all genes in normal FT, Tp53−/−;Ccne1OE;Akt2OE;KrasOE, Tp53−/−;Pten−/−;Nf1−/− and Tp53−/−;Brca1−/−;MycOE tumors, respectively. Shading represents Euclidian distance for each sample pair. B, Enriched KEGG (left) and MSigDB Hallmark genes (right), ranked by fold-change between the indicated groups. Shading represents the FDR-adjusted p value within each category; color indicates direction of enrichment relative to the first group of the comparison. C, Pathway analysis comparing the indicated groups. color indicates direction of enrichment relative to the first group of the comparison. D, Heat map showing transcripts (log-transformed TPMs) of the indicated chemokines/cytokines/growth factors in representative tumors from each genotype. See also Supplementary Fig. S3.
Figure 4.
Figure 4.
Tumor genotype determines immune landscape. A, Pie charts summarizing composition of immune cells (CD45+) in tumors with the indicated genotypes. Note that CD45+ cells (as % of total tumor cells) were significantly less in Tp53−/−;Pten−/−;Nf1−/− tumors, but similar in the other two genotypes (see Supplementary Fig. S4). B, Immune cell subtyping by flow cytometric analysis of representative tumors of the indicated genotypes. Each point represents a tumor from a different mouse. Data are presented as mean ± SEM, **P<0.01, ***P<0.001, 2-way ANOVA. C, Left panel: Diagram showing strategies for analyzing function of selected chemokines/cytokines in Tp53−/−;Ccne1OE;Akt2OE;KrasOE HGSC. Right panels: Effect of the indicated neutralizing antibodies on migration of T cells, CD11b+ cells, F4/80+ cells, and Ly6G+ cells in Transwell assays, quantified as Migration Index (migration with/without antibody) after 24 h co-culture of the indicated cell population with Tp53−/−;Ccne1OE;Akt2OE;KrasOE organoid-conditioned medium. D, Left panel: Schematic showing in vivo antibody neutralization experiments. Right panels: Immune cell immigration into Tp53−/−;Ccne1OE;Akt2OE;KrasOE tumors, after injections with the indicated antibody. Each point represents a tumor from a different mouse. Data are presented as mean ± SEM, **P<0.01, ***P<0.001, 2-way ANOVA.
Figure 5.
Figure 5.
Rationally derived combination regimen results in complete responses in Tp53−/−;Ccne1OE;Akt2OE;KrasOE tumors. A, Schematic depicting treatment regimens (n=10 mice/group, 2 batches). For each set of experiments, five mice were sacrificed at Day 32 for histological analysis; the other 5 were continued on treatment until Day 35, then treatment was withdrawn and mice were followed thereafter for survival. B, Representative genital tracts from Tp53−/−;Ccne1OE;Akt2OE;KrasOE tumor-bearing mice treated as indicated; mice were sacrificed at Day 32 of the scheme in (A). C, Ovary weights in mice from the indicated treatment groups. Each point represents one mouse. D, K-M curves of Tp53−/−;Ccne1OE;Akt2OE;KrasOE tumor-bearing mice, treated as indicated in A until Day35 and then monitored for recurrence, n=5 mice/group. E, H&E and IF staining for the indicated immune markers and DAPI (nuclei) in ovarian sections from the indicated groups. Note that the ovarian fat pad has almost no tumor after Gemcitabine+αPD-L1+αCTLA4 treatment. Black scale bars: 50 μm, while scale bars: 20 μm. F, Quantification of the indicated immune cells from the sections in (E). Each point represents average cell number per 20X field from 5 independent sections of each mouse. Error bars indicate SEM; **P<0.01, ***P<0.001, 2-way ANOVA. G, Representative bioluminescence images of mice bearing orthotopic tumor allografts (expressing luciferase), treated as indicated, and measured at Days 7, 14, 28, and 35, respectively. H, Relative photon flux, quantified by the intensity of bioluminescence in the regions of interest (ROIs), determined at the indicated times in mice from each treatment group, n=5 mice/group. Error bars indicate SEM; ns, not significant, ***P<0.001, 2-way ANOVA. I, K-M curves for Tp53−/−;Ccne1OE;Akt2OE;KrasOE tumor-bearing mice, treated as indicated. See also Supplementary Fig. S5 and Fig. S6.
Figure 6.
Figure 6.
Treatment efficacy is tumor genotype-dependent. A, Left panel: Schematic showing treatment of Tp53−/−;Pten−/−;Nf1−/− tumor-bearing mice with Gemcitabine/α-PD-L1/α-CTLA-4 regimen (from Figure 6) or Paclitaxel. Second panel: Genital tracts from mice treated as indicated; Third panel: Ovary weights in treated mice. Right panel: % mice with ascites after indicated treatment. B, Left panel: Schematic showing treatment of Tp53−/−;Ccne1OE;Akt2OE;KrasOE tumor-bearing mice with the indicated regimens. Second panel: Genital tracts from mice treated as indicated; Third panel: Ovary weights in treated mice. Right panel: % mice with ascites after indicated treatment. Data indicate means ± SEM, **p < 0.01, unpaired t test. C, K-M curves of tumor-bearing Tp53−/−;Pten−/−;Nf1−/− or Tp53−/−;Ccne1OE;Akt2OE;KrasOE mice, treated as indicated. Treatments were withdrawn at Day 32. D, Cartoon summarizing results, depicting tumor genotype-specificity of therapeutic efficacy. See also Supplementary Fig. S7.
Figure 7.
Figure 7.
Similarities between human HGSC organoids and tumors and mouse models. A, Representative bright field images and IF staining of human HSGC organoids. Scale bars: bright field, 100 μm; IF: 20 μm. B, Dose-response curves for the indicated drugs in tumorigenic organoid lines of different genotypes. Cell viability was calculated relative to 0.01% DMSO-treated control cells, measured after 5 days of treatment. C, Levels of the indicated cytokines, chemokines, and growth factors in human HGSC organoid-conditioned media; error bars indicate ± SEM **P<0.01, ***P<0.001, 2-way ANOVA. D, Relative abundance of major immune cell subtypes in human HGSC samples with indicated genotypes from TCGA, as inferred by QUANTISEQ. TPN: TP53;PTEN;NF1, TCK: TP53;CCNE1;KRAS, TCAK: TP53;CCNE1;AKT2;KRAS, TBM: TP53;BRCA1;MYC. Numbers of samples per group are shown in parentheses. *P<0.05, t-test corrected for multiple comparisons by Benjamini-Hochberg method. E, H&E-stained sections and IHC analysis of the indicated markers in representative sections from human HGSC samples of the indicated tumor genotypes. Scale bars: 100 μm. F, Quantification of CD8+ cells, FOXP3+ (Treg) cells and CD68+ cells in tumors of the indicated genotypes; average cell numbers from five 20X fields were determined. Data represent mean ± SEM, **P<0.01, ***P<0.001, 2-way ANOVA. See also Supplementary Fig. S8.

References

    1. Robert L, Ribas A, Hu-Lieskovan S. Combining targeted therapy with immunotherapy. Can 1+1 equal more than 2? Semin Immunol 2016;28(1):73–80 doi 10.1016/j.smim.2016.01.001. - DOI - PMC - PubMed
    1. Esteva FJ, Hubbard-Lucey VM, Tang J, Pusztai L. Immunotherapy and targeted therapy combinations in metastatic breast cancer. Lancet Oncol 2019;20(3):e175–e86 doi 10.1016/S1470-2045(19)30026-9. - DOI - PubMed
    1. Otto T, Sicinski P. Cell cycle proteins as promising targets in cancer therapy. Nat Rev Cancer 2017;17(2):93–115 doi 10.1038/nrc.2016.138. - DOI - PMC - PubMed
    1. Pardoll DM. The blockade of immune checkpoints in cancer immunotherapy. Nat Rev Cancer 2012;12(4):252–64 doi 10.1038/nrc3239. - DOI - PMC - PubMed
    1. Walsh NC, Kenney LL, Jangalwe S, Aryee KE, Greiner DL, Brehm MA, et al. Humanized Mouse Models of Clinical Disease. Annu Rev Pathol 2017;12:187–215 doi 10.1146/annurev-pathol-052016-100332. - DOI - PMC - PubMed

Publication types