. 2021 Jun 1;62(6):802-807.
doi: 10.2967/jnumed.120.249078. Epub 2020 Nov 6.

18F-AraG PET for CD8 Profiling of Tumors and Assessment of Immunomodulation by Chemotherapy

Affiliations

18F-AraG PET for CD8 Profiling of Tumors and Assessment of Immunomodulation by Chemotherapy

Jelena Levi et al. J Nucl Med. .

Abstract

Most clinical trials exploring various combinations of chemo- and immunotherapy rely on serial biopsy to provide information on immune response. The aim of this study was to assess the value of 18F-arabinosyl guanine (18F-AraG) as a noninvasive tool that profiles tumors on the basis of the key player in adaptive antitumor response, CD8+ cells, and evaluates the immunomodulatory effects of chemotherapy. Methods: To evaluate the ability of 18F-AraG to report on the presence of CD8+ cells within the tumor microenvironment, we imaged a panel of syngeneic tumor models (MC38, CT26, LLC, A9F1, 4T1, and B16F10) and correlated the signal intensity with the number of lymphocytes found in the tumors. The capacity of 18F-AraG to detect immunomodulatory effects of chemotherapy was determined by longitudinal imaging of tumor-bearing mice (MC38 and A9F1) undergoing 2 types of chemotherapy: oxaliplatin/cyclophosphamide, shown to induce immunogenic cell death, and paclitaxel/carboplatin, reported to cause immunogenically silent tumor cell death. Results: In the tumor panel, 18F-AraG revealed strikingly different uptake patterns resembling cancer-immune phenotypes observed in the clinic. A statistically significant correlation was found between the 18F-AraG signal and the number of PD-1-positive CD8+ cells isolated from the tumors (r2 = 0.528, P < 0.0001). In the MC38 model, paclitaxel/carboplatin did not result in an appreciable change in signal after therapy (1.69 ± 0.25 vs. 1.50 ± 0.33 percentage injected dose per gram), but oxaliplatin/cyclophosphamide treatment led to close to a 2.4-fold higher 18F-AraG signal (1.20 ± 0.31 vs. 2.84 ± 0.93 percentage injected dose per gram). The statistically significant increase in signal after oxaliplatin/cyclophosphamide was also observed in the A9F1 model (0.95 ± 0.36 vs. 1.99 ± 0.54 percentage injected dose per gram). Conclusion: The ability of 18F-AraG PET to assess the location and function of CD8+ cells, as well immune activity within tumors after immune priming therapy, warrants further investigation into its utility for patient selection, evaluation of optimal time to deliver immunotherapies, and assessment of combinatorial therapies.

Keywords: CD8 T cells; chemotherapy; immunomodulation.


Figures

FIGURE 1.
FIGURE 1.
18F-AraG imaging of different syngeneic tumor models. (A) Both intratumoral (arrowheads) and intranodal (encircled) signal varied among different tumor types. Location of intratumoral signal showed several patterns, from signal present in core (MC38 and A9F1) through halolike (CT26) to signal present only at margin (LLC, B16F10). Ring effect as observed in bladder signifies saturated signal. (B) Intratumoral signal intensity showed variation among different tumor types and among individual mice of same tumor type. Signal in TDLNs was higher than signal in tumors and showed variability among different tumor types and individual mice (n = 4 for each tumor type; error bars represent SD). LN = lymph node; T = tumor; %ID = percentage injected dose.
FIGURE 2.
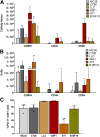
FIGURE 2.
Evaluation of different syngeneic tumor models. (A) Highest density of total lymphocytes, CD4+, and CD8+ cells was found in smallest tumors, A9F1. (B) Highest number of lymphocytes was isolated from largest tumors, 4T1. (C) Percentage of CD8 cells that expressed PD-1 varied among different tumor types. In LLC and A9F1 tumors, over 97% of CD8 cells were found to be PD-1–positive, whereas in 4T1 tumors less than 30% of CD8 cells were positive for PD-1 (n = 4 for each tumor type; error bars represent SD); symbols within bars represent individual mice).
FIGURE 3.
FIGURE 3.
Correlation of 18F-AraG signal with number of CD8 cells present in TME. (A) 18F-AraG signal showed no correlation with number of intratumoral CD8+ cells. (B) 18F-AraG signal showed statistically significant correlation with number of CD8+PD-1+ cells. (C) Exclusion of 4T1 cells for which PD-1 expression indicated dysfunction led to statistically significant correlation between 18F-AraG signal and number of CD8+ cells. %ID = percentage injected dose.
FIGURE 4.
FIGURE 4.
18F-AraG longitudinal imaging of MC38-bearing mice undergoing chemotherapy. Chemotherapy was administered once weekly for 2 wk. Mice were imaged 1 d before start of therapy (Pre Tx) and then 3 d (P1) and 6 d (P2) after first chemotherapy administration and 3 d after second chemotherapy administration (Post Tx). (A) Paclitaxel/carboplatin treatment did not lead to appreciable changes in signal intensity. Dramatic increase in signal intensity was detected after 2 oxaliplatin/cyclophosphamide injections. Encircled areas are TDLNs; arrowheads point to tumors. (B) 18F-AraG signal detected after oxaliplatin/cyclophosphamide treatment was significantly different from pretherapy signal as well as signal after paclitaxel-carboplatin treatment (n = 4 for each group; error bars represent SD). LN = lymph node; T = tumor; %ID = percentage injected dose. *P < 0.05.
FIGURE 5.
FIGURE 5.
18F-AraG imaging of A9F1-bearing mice undergoing chemotherapy. (A) Paclitaxel/carboplatin treatment showed trend toward increase in signal. Oxaliplatin/cyclophosphamide treatment led to increase in intratumoral signal. Encircled areas are TDLNs; arrowheads point to tumors. (B) Signal detected after oxaliplatin/cyclophosphamide treatment was significantly different from pretherapy signal but not from signal after paclitaxel-carboplatin treatment (n = 4 for each group; error bars represent SD). LN = lymph node; T = tumor; %ID = percentage injected dose. *P < 0.05.
FIGURE 6.
FIGURE 6.
Lymphocyte profile of MC38 and A9F1 tumors after chemotherapy. (A) In MC38 tumors, oxaliplatin/cyclophosphamide treatment led to increase in total lymphocytes and number of CD8+ cells. In A9F1 tumors, oxaliplatin/cyclophosphamide treatment led to increase in total lymphocytes and number of CD4+ cells. (B) In MC38 tumors, ratio of CD8+ to CD4+FOXP3+ cells in oxaliplatin/cyclophosphamide group was 27 times higher than in paclitaxel/carboplatin-treated mice. (n = 4 for each group; error bars represent SD). *P < 0.05.

Similar articles

Cited by

References

    1. Junttila MR, de Sauvage FJ. Influence of tumour micro-environment heterogeneity on therapeutic response. Nature. 2013;501:346–354. - PubMed
    1. Binnewies M, Roberts EW, Kersten K, et al. . Understanding the tumor immune microenvironment (TIME) for effective therapy. Nat Med. 2018;24:541–550. - PMC - PubMed
    1. Fridman WH, Zitvogel L, Sautes-Fridman C, Kroemer G. The immune contexture in cancer prognosis and treatment. Nat Rev Clin Oncol. 2017;14:717–734. - PubMed
    1. Chen DS, Mellman I. Elements of cancer immunity and the cancer-immune set point. Nature. 2017;541:321–330. - PubMed
    1. Ott PA, Hodi FS, Kaufman HL, Wigginton JM, Wolchok JD. Combination immunotherapy: a road map. J Immunother Cancer. 2017;5:16. - PMC - PubMed

Publication types