

Differential effects of intervention timing on COVID-19 spread in the United States
- PMID: 33158911
- PMCID: PMC7821895
- DOI: 10.1126/sciadv.abd6370
Differential effects of intervention timing on COVID-19 spread in the United States
Abstract
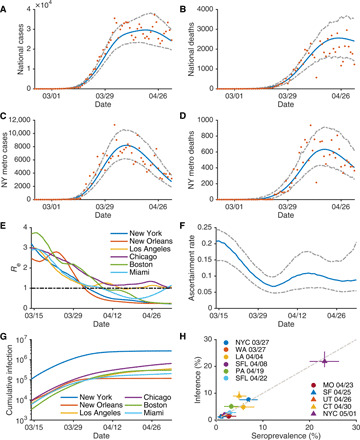
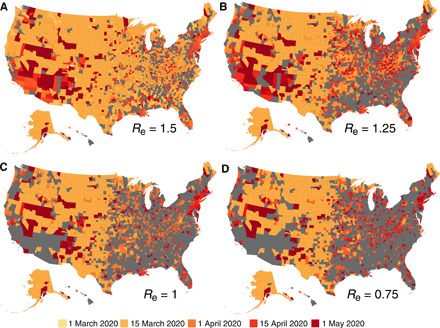
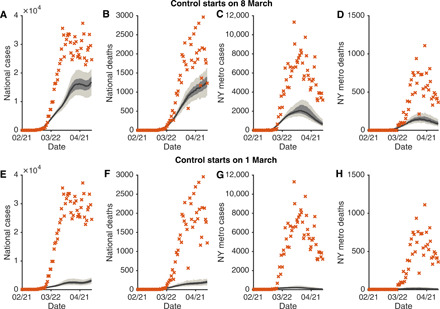
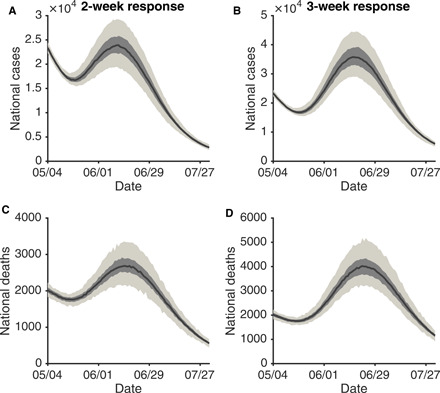
Assessing the effects of early nonpharmaceutical interventions on coronavirus disease 2019 (COVID-19) spread is crucial for understanding and planning future control measures to combat the pandemic. We use observations of reported infections and deaths, human mobility data, and a metapopulation transmission model to quantify changes in disease transmission rates in U.S. counties from 15 March to 3 May 2020. We find that marked, asynchronous reductions of the basic reproductive number occurred throughout the United States in association with social distancing and other control measures. Counterfactual simulations indicate that, had these same measures been implemented 1 to 2 weeks earlier, substantial cases and deaths could have been averted and that delayed responses to future increased incidence will facilitate a stronger rebound of infections and death. Our findings underscore the importance of early intervention and aggressive control in combatting the COVID-19 pandemic.
Copyright © 2020 The Authors, some rights reserved; exclusive licensee American Association for the Advancement of Science. No claim to original U.S. Government Works. Distributed under a Creative Commons Attribution NonCommercial License 4.0 (CC BY-NC).
Figures
Update of
-
Differential Effects of Intervention Timing on COVID-19 Spread in the United States.medRxiv [Preprint]. 2020 May 20:2020.05.15.20103655. doi: 10.1101/2020.05.15.20103655. medRxiv. 2020. Update in: Sci Adv. 2020 Dec 4;6(49):eabd6370. doi: 10.1126/sciadv.abd6370. PMID: 32511526 Free PMC article. Updated. Preprint.
References
-
- World Health Organization, Coronavirus disease (COVID-2019) situation reports, www.who.int/emergencies/diseases/novel-coronavirus-2019/situation-reports/ [accessed 22 June 2020].
-
- Centers for Disease Control and Prevention, www.cdc.gov/coronavirus/2019-ncov/index.html [accessed 22 June 2020].
-
- Holshue M. L., DeBolt C., Lindquist S., Lofy K. H., Wiesman J., Bruce H., Spitters C., Ericson K., Wilkerson S., Tural A., Diaz G., Cohn A., Fox L. A., Patel A., Gerber S. I., Kim L., Tong S., Lu X., Lindstrom S., Pallansch M. A., Weldon W. C., Biggs H. M., Uyeki T. M., Pillai S. K.; Washington State 2019-nCoV Case Investigation Team , First case of 2019 novel coronavirus in the United States. N. Engl. J. Med. 382, 929–936 (2020). - PMC - PubMed
-
- The New York Times, Coronavirus in the U.S.: Latest Map and Case Count, www.nytimes.com/interactive/2020/us/coronavirus-us-cases.html [accessed 22 June 2020].
Publication types
MeSH terms
Grants and funding
LinkOut - more resources
Full Text Sources
Medical
