

Fractionating autism based on neuroanatomical normative modeling
- PMID: 33159037
- PMCID: PMC7648836
- DOI: 10.1038/s41398-020-01057-0
Fractionating autism based on neuroanatomical normative modeling
Abstract
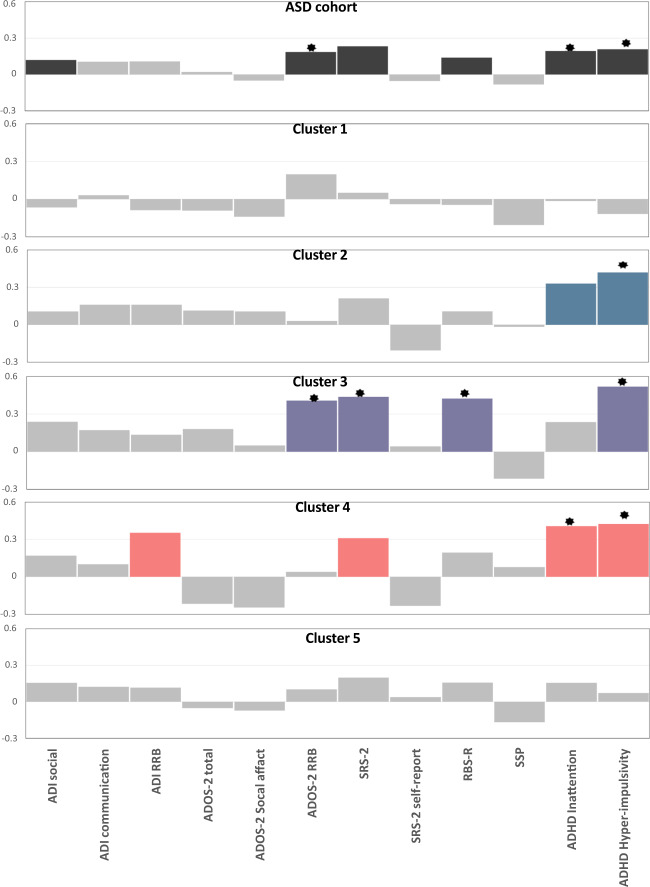
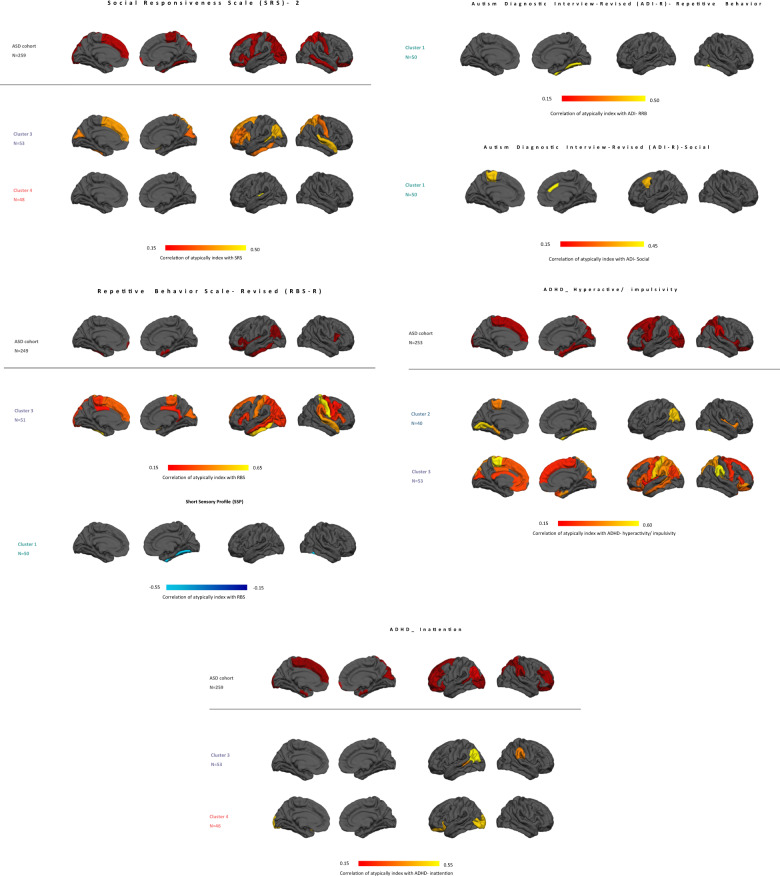
Autism is a complex neurodevelopmental condition with substantial phenotypic, biological, and etiologic heterogeneity. It remains a challenge to identify biomarkers to stratify autism into replicable cognitive or biological subtypes. Here, we aim to introduce a novel methodological framework for parsing neuroanatomical subtypes within a large cohort of individuals with autism. We used cortical thickness (CT) in a large and well-characterized sample of 316 participants with autism (88 female, age mean: 17.2 ± 5.7) and 206 with neurotypical development (79 female, age mean: 17.5 ± 6.1) aged 6-31 years across six sites from the EU-AIMS multi-center Longitudinal European Autism Project. Five biologically based putative subtypes were derived using normative modeling of CT and spectral clustering. Three of these clusters showed relatively widespread decreased CT and two showed relatively increased CT. These subtypes showed morphometric differences from one another, providing a potential explanation for inconsistent case-control findings in autism, and loaded differentially and more strongly onto symptoms and polygenic risk, indicating a dilution of clinical effects across heterogeneous cohorts. Our results provide an important step towards parsing the heterogeneous neurobiology of autism.
Conflict of interest statement
J.K.B. has been a consultant to, advisory board member of, and a speaker for Janssen Cilag BV, Eli Lilly, Shire, Lundbeck, Roche, and Servier. He is not an employee of any of these companies and not a stock shareholder of any of these companies. He has no other financial or material support, including expert testimony, patents, or royalties. CFB is director and shareholder in SBGNeuro Ltd. T.B. served in an advisory or consultancy role for Actelion, Hexal Pharma, Lilly, Lundbeck, Medice, Novartis, and Shire. He received conference support or speaker’s fee from Lilly, Medice, Novartis, and Shire. He has been involved in clinical trials conducted by the Shire and Vifor Pharma. He received royalities from Hogrefe, Kohlhammer, CIP Medien, and Oxford University Press. The present work is unrelated to the above grants and relationships. COIs. DM has served on advisory boards for Roche and Servier. The other authors report no biomedical financial interests or potential conflicts of interest.
Figures

References
-
- American Psychiatric Association & American Psychiatric Association. DSM-5 Task Force. Diagnostic and Statistical Manual of Mental Disorders: DSM-5 (APA, 2013).
Publication types
MeSH terms
Grants and funding
- WT_/Wellcome Trust/United Kingdom
- MR/N026063/1/MRC_/Medical Research Council/United Kingdom
- 864.12.003/Nederlandse Organisatie voor Wetenschappelijk Onderzoek (Netherlands Organisation for Scientific Research)/International
- 016.156.415/Nederlandse Organisatie voor Wetenschappelijk Onderzoek (Netherlands Organisation for Scientific Research)/International
