. 2020 Nov 6;11(1):5650.
doi: 10.1038/s41467-020-19015-1.

Benchmarking of cell type deconvolution pipelines for transcriptomics data

Affiliations

Benchmarking of cell type deconvolution pipelines for transcriptomics data

Francisco Avila Cobos et al. Nat Commun. .

Erratum in

Abstract

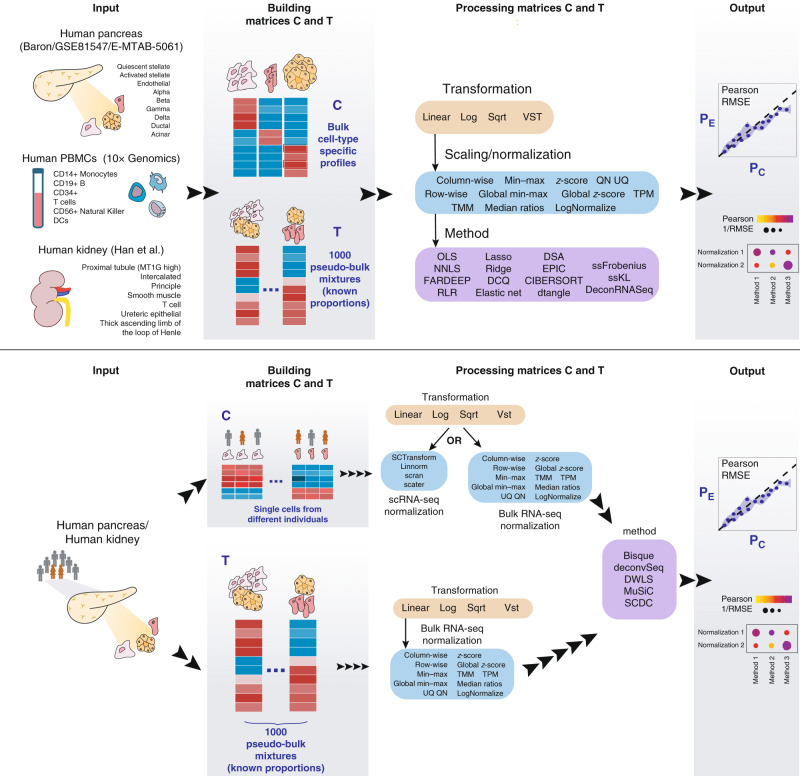
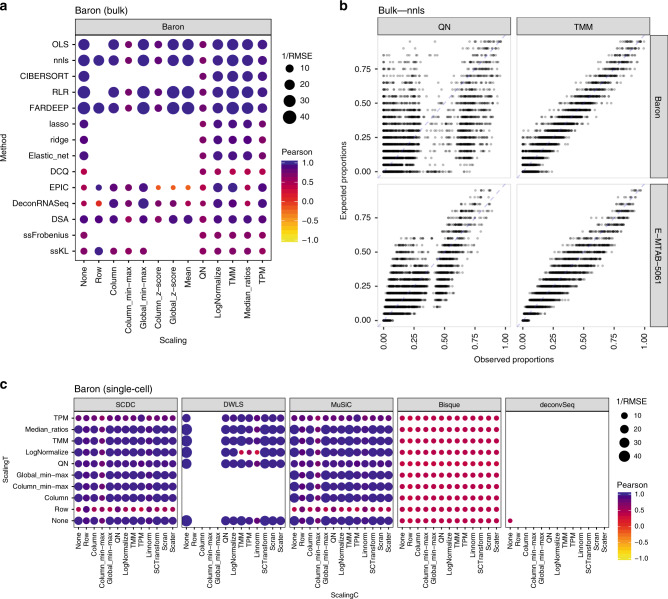
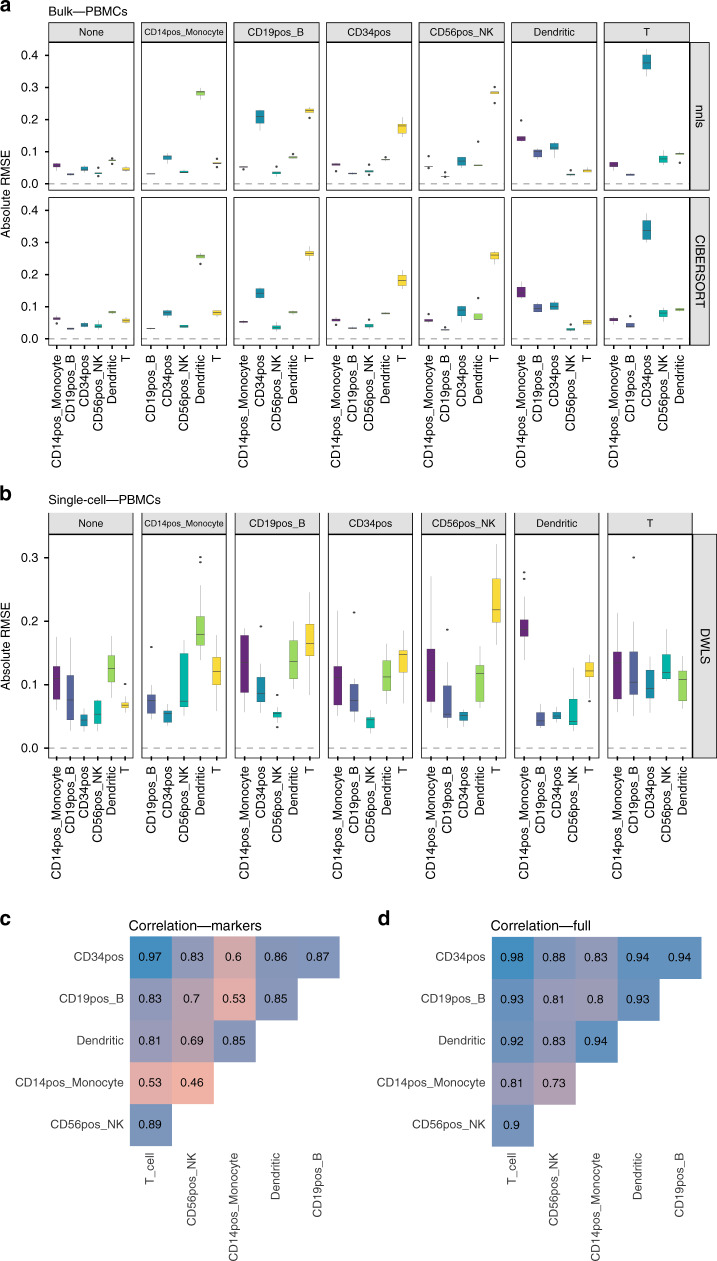
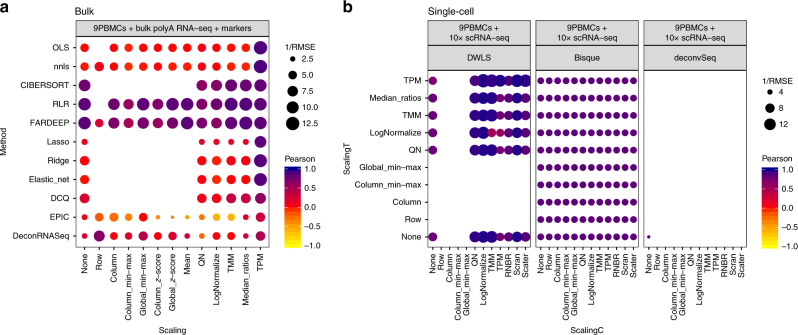
Many computational methods have been developed to infer cell type proportions from bulk transcriptomics data. However, an evaluation of the impact of data transformation, pre-processing, marker selection, cell type composition and choice of methodology on the deconvolution results is still lacking. Using five single-cell RNA-sequencing (scRNA-seq) datasets, we generate pseudo-bulk mixtures to evaluate the combined impact of these factors. Both bulk deconvolution methodologies and those that use scRNA-seq data as reference perform best when applied to data in linear scale and the choice of normalization has a dramatic impact on some, but not all methods. Overall, methods that use scRNA-seq data have comparable performance to the best performing bulk methods whereas semi-supervised approaches show higher error values. Moreover, failure to include cell types in the reference that are present in a mixture leads to substantially worse results, regardless of the previous choices. Altogether, we evaluate the combined impact of factors affecting the deconvolution task across different datasets and propose general guidelines to maximize its performance.


Conflict of interest statement

The authors declare no competing interests.

Figures

Fig. 1
Fig. 1. Schematic representation of the benchmarking study.
Top panel: workflow for bulk deconvolution methods. Bottom panel: workflow for deconvolution methods using scRNA-seq data as reference. In both cases the deconvolution performance is assessed by means of Pearson correlation and root-mean-square error (RMSE). PBMCs: peripheral blood mononuclear cells, log: logarithmic, sqrt: square-root, VST: variance stabilization transformation, PE: expected proportions, Pc: computed proportions.
Fig. 2
Fig. 2. Impact of the data transformation on the deconvolution results.
RMSE values between the known proportions in 1000 pseudo-bulk tissue mixtures from the Baron dataset (pool size = 100 cells per mixture) and the predicted proportions from the different bulk deconvolution methods (left) and those using scRNA-seq data as reference (right). Each boxplot contains all normalization strategies that were tested in combination with a given method.
Fig. 3
Fig. 3. Combined impact of data normalization and methodology on the deconvolution results.
RMSE and Pearson correlation values between the expected (known) proportions in 1000 pseudo-bulk tissue mixtures in linear scale (pool size = 100 cells per mixture) and the output proportions from the different bulk deconvolution methods (a) and those using scRNA-seq data as reference (c). The darker the blue and the higher the area of the circle represents higher Pearson and lower RMSE values, respectively. b Scatter plot showing the impact of the normalization strategy (TMM versus quantile normalization (QN)) comparing the expected proportions (y-axis) and the results obtained through computational deconvolution using nnls (x-axis) for Baron and E-MTAB-5061 datasets. Empty locations represent combinations that were not feasible (see Supplementary Notes).
Fig. 4
Fig. 4. Impact of the marker selection on the deconvolution results.
RMSE values between the expected (known) proportions in 1000 pseudo-bulk tissue mixtures (linear scale; pool size = 100 cells per mixture) and the output proportions from the Baron dataset, using eight different marker selection strategies. Each boxplot contains all normalization strategies that were tested in combination with a given marker strategy across the different bulk deconvolution methods.
Fig. 5
Fig. 5. Effect of cell type removal on the deconvolution results for the PBMCs dataset (100-cell mixtures; linear scale).
a Results using bulk deconvolution methods (nnls and CIBERSORT); b results with deconvolution methods using scRNA-seq data as reference (only DWLS because the data comes from only one individual). c Pairwise Pearson correlation values between expression profiles for the different cell types, using a subset of the reference matrix containing only the markers used in the bulk deconvolution; d pairwise Pearson correlation values between complete expression profiles for the different cell types. In a, b, each gray column represents a specific cell type removed. Each data point conforming a boxplot represents a different scaling/normalization strategy used.
Fig. 6
Fig. 6. Effect of cell type removal on the deconvolution results for the GSE81547 dataset (100-cell mixtures; linear scale).
a Results using bulk deconvolution methods (nnls and CIBERSORT); b results with deconvolution methods using scRNA-seq data as reference (MuSiC and DWLS). c Pairwise Pearson correlation values between expression profiles for the different cell types, using a subset of the reference matrix containing only the markers used in the bulk deconvolution; d pairwise Pearson correlation values between complete expression profiles for the different cell types. In a, b, each gray column represents a specific cell type removed. Each data point conforming a boxplot represents a different scaling/normalization strategy used.
Fig. 7
Fig. 7. Deconvolution performance on nine human PBMC bulk samples.
With a bulk deconvolution methods; b deconvolution methods using scRNA-seq as reference.

References

    1. Sharma A, et al. Non-genetic intra-tumor heterogeneity is a major predictor of phenotypic heterogeneity and ongoing evolutionary dynamics in lung tumors. Cell Rep. 2019;29:2164–2174.e5. doi: 10.1016/j.celrep.2019.10.045. - DOI - PMC - PubMed
    1. Hendry S, et al. Assessing tumor infiltrating lymphocytes in solid tumors: a practical review for pathologists and proposal for a standardized method from the International Immuno-Oncology Biomarkers Working Group. Adv. Anat. Pathol. 2017;24:235–251. doi: 10.1097/PAP.0000000000000162. - DOI - PMC - PubMed
    1. Research, A. A. for C. Low-Heterogeneity melanomas are more immunogenic and less aggressive. Cancer Discov. 10.1158/2159-8290.CD-RW2019-144 (2019).
    1. Elloumi F, et al. Systematic bias in genomic classification due to contaminating non-neoplastic tissue in breast tumor samples. BMC Med. Genomics. 2011;4:54. doi: 10.1186/1755-8794-4-54. - DOI - PMC - PubMed
    1. Avila Cobos F, Vandesompele J, Mestdagh P, De Preter K. Computational deconvolution of transcriptomics data from mixed cell populations. Bioinformatics. 2018;34:1969–1979. doi: 10.1093/bioinformatics/bty019. - DOI - PubMed

Publication types