. 2020 Nov 6;11(1):5620.
doi: 10.1038/s41467-020-19122-z.

Epidemiological hypothesis testing using a phylogeographic and phylodynamic framework

Affiliations

Epidemiological hypothesis testing using a phylogeographic and phylodynamic framework

Simon Dellicour et al. Nat Commun. .

Abstract

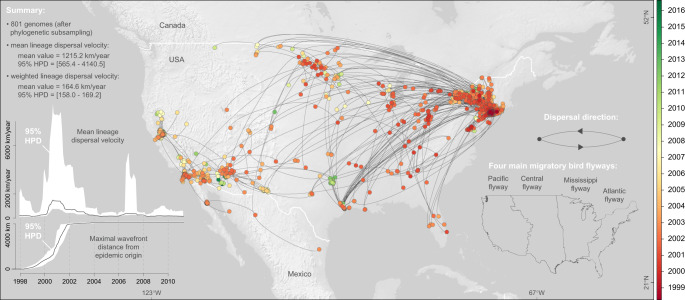
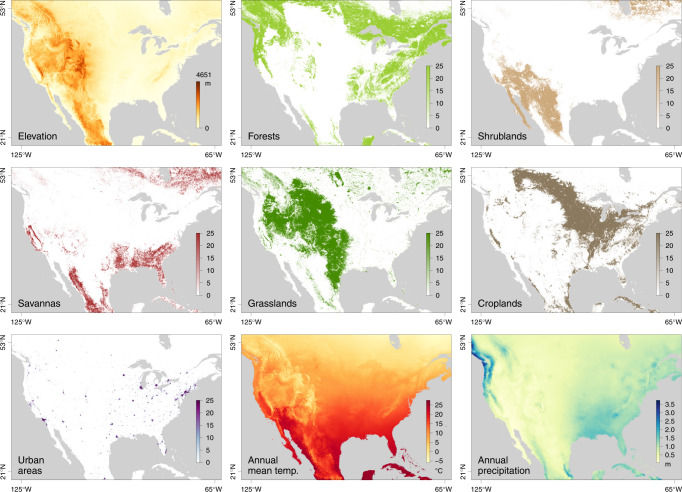
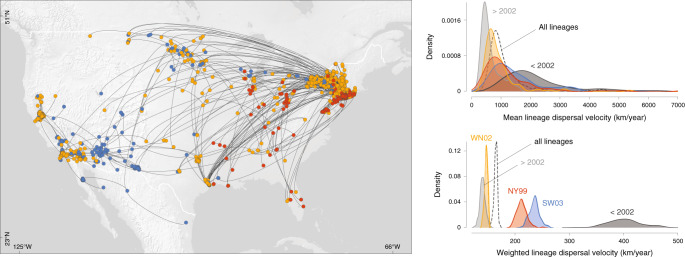
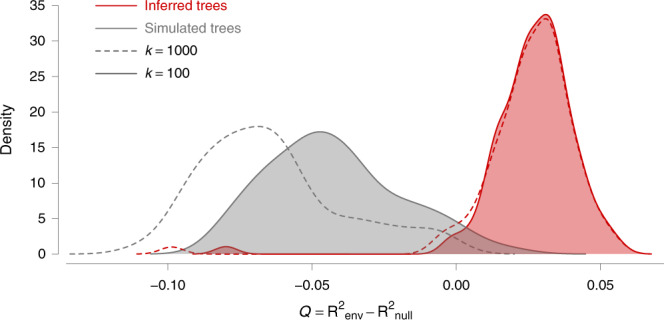
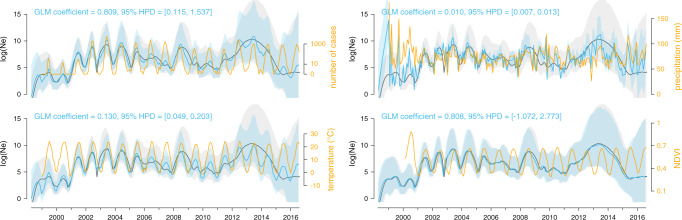
Computational analyses of pathogen genomes are increasingly used to unravel the dispersal history and transmission dynamics of epidemics. Here, we show how to go beyond historical reconstructions and use spatially-explicit phylogeographic and phylodynamic approaches to formally test epidemiological hypotheses. We illustrate our approach by focusing on the West Nile virus (WNV) spread in North America that has substantially impacted public, veterinary, and wildlife health. We apply an analytical workflow to a comprehensive WNV genome collection to test the impact of environmental factors on the dispersal of viral lineages and on viral population genetic diversity through time. We find that WNV lineages tend to disperse faster in areas with higher temperatures and we identify temporal variation in temperature as a main predictor of viral genetic diversity through time. By contrasting inference with simulation, we find no evidence for viral lineages to preferentially circulate within the same migratory bird flyway, suggesting a substantial role for non-migratory birds or mosquito dispersal along the longitudinal gradient.


Conflict of interest statement

The authors declare no competing interests.

Figures

Fig. 1
Fig. 1. Spatio-temporal diffusion of WNV lineages in North America.
Maximum clade credibility (MCC) tree obtained by continuous phylogeographic inference based on 100 posterior trees (see the text for further details). Nodes of the tree are coloured from red (the time to the most recent common ancestor, TMRCA) to green (most recent sampling time). Older nodes are plotted on top of younger nodes, but we provide also an alternative year-by-year representation in Supplementary Fig. S1. In addition, this figure reports global dispersal statistics (mean lineage dispersal velocity and mean diffusion coefficient) averaged over the entire virus spread, the evolution of the mean lineage dispersal velocity through time, the evolution of the maximal wavefront distance from the origin of the epidemic, as well as the delimitations of the North American Migratory Flyways (NAMF) considered in the USA.
Fig. 2
Fig. 2. Environmental variables tested for their impact on the dispersal of West Nile virus lineages in North America.
See Table S1 for the source of data for each environmental raster.
Fig. 3
Fig. 3. Comparison of the dispersal history and velocity of WNV lineages belonging to three phenotypically relevant genotypes (NY99, WN02, and SW03).
The map displays the maximum clade credibility (MCC) tree obtained by continuous phylogeographic inference with nodes coloured according to three different genotypes.
Fig. 4
Fig. 4. Impact of annual mean temperature acting as a conductance factor on the dispersal velocity of viral lineages.
The graph displays the distribution of the correlation metric Q computed on 100 spatially annotated trees obtained by continuous phylogeographic inference (red distributions). The metric Q measures to what extent considering a heterogeneous environmental raster, increases the correlation between lineage durations and environmentally scaled distances compared to a homogeneous raster. If Q is positive and supported, it indicates that the heterogeneity in lineage dispersal velocity can be at least partially explained by the environmental factor under investigation. The graph also displays the distribution of Q values computed on the same 100 posterior trees along which we simulated a new forward-in-time diffusion process (grey distributions). These simulations are used as a null dispersal model to estimate the support associated with the inferred distribution of Q values. For both inferred and simulated trees, we report the Q distributions obtained while transforming the original environmental raster according to two different scaling parameter k values (100 and 1000; respectively full and dashed line, see the text for further details on this transformation). The annual mean temperature raster, transformed in conductance values using these two k values, is the only environmental factor for which we detect a positive distribution of Q that is also associated with a strong statistical support (Bayes factor > 20).
Fig. 5
Fig. 5. Associations between viral effective population size and potential covariates.
These associations were tested with a generalised linear model (GLM) extension of the coalescent model used to infer the dynamics of the viral effective population size of the virus (Ne) through time. Specifically, we here tested the following time-series variables as potential covariates (orange curves): number of human cases (log-transformed and with a negative time period of one month), mean temperature, mean precipitation, and Normalised Difference Vegetation Index (NDVI, a greenness index). Posterior mean estimates of the viral effective population size based on both sequence data and covariate data are represented by blue curves, and the corresponding blue polygon reflects the 95% HPD region. Posterior mean estimates of the viral effective population size inferred strictly from sequence data are represented by grey curves and the corresponding grey polygon reflects the 95% HPD region. A significant association between the covariate and effective population size is inferred when the 95% HPD interval of the GLM coefficient excludes zero, which is the case for the case count, temperature, and precipitation covariates.

References

    1. Lemey P, Rambaut A, Welch JJ, Suchard MA. Phylogeography takes a relaxed random walk in continuous space and time. Mol. Biol. Evol. 2010;27:1877–1885. - PMC - PubMed
    1. Pybus OG, et al. Unifying the spatial epidemiology and molecular evolution of emerging epidemics. Proc. Natl Acad. Sci. USA. 2012;109:15066–15071. - PMC - PubMed
    1. Baele G, Dellicour S, Suchard MA, Lemey P, Vrancken B. Recent advances in computational phylodynamics. Curr. Opin. Virol. 2018;31:24–32. - PubMed
    1. Dellicour S, Rose R, Pybus OG. Explaining the geographic spread of emerging epidemics: a framework for comparing viral phylogenies and environmental landscape data. BMC Bioinform. 2016;17:1–12. - PMC - PubMed
    1. Jacquot M, Nomikou K, Palmarini M, Mertens P, Biek R. Bluetongue virus spread in Europe is a consequence of climatic, landscape and vertebrate host factors as revealed by phylogeographic inference. Proc. R. Soc. Lond. B. 2017;284:20170919. - PMC - PubMed

Publication types