. 2020 Nov 6;11(1):5653.
doi: 10.1038/s41467-020-19425-1.

Injury triggers fascia fibroblast collective cell migration to drive scar formation through N-cadherin

Affiliations

Injury triggers fascia fibroblast collective cell migration to drive scar formation through N-cadherin

Dongsheng Jiang et al. Nat Commun. .

Abstract

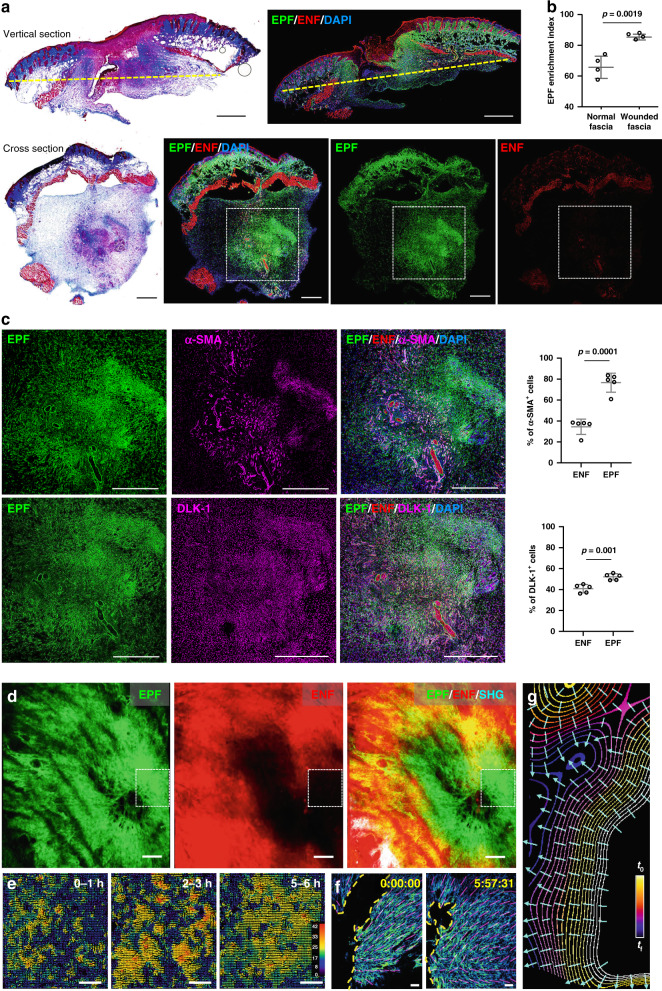
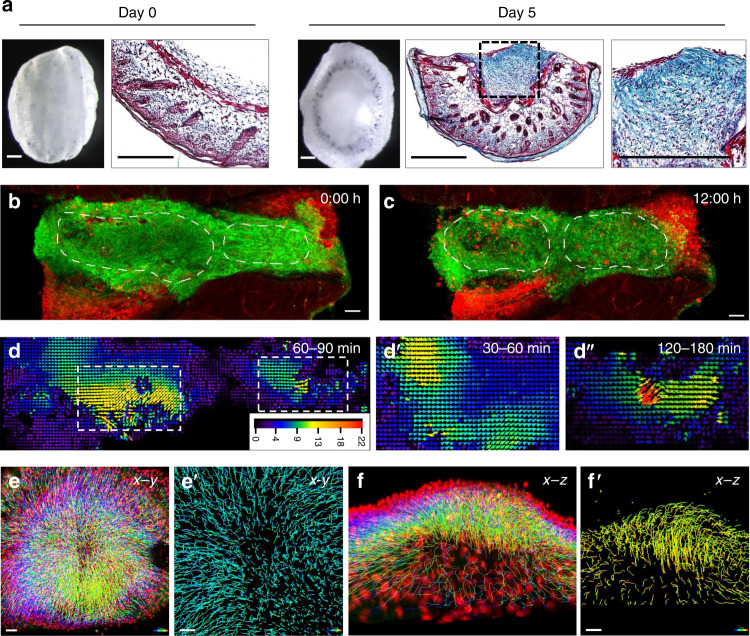
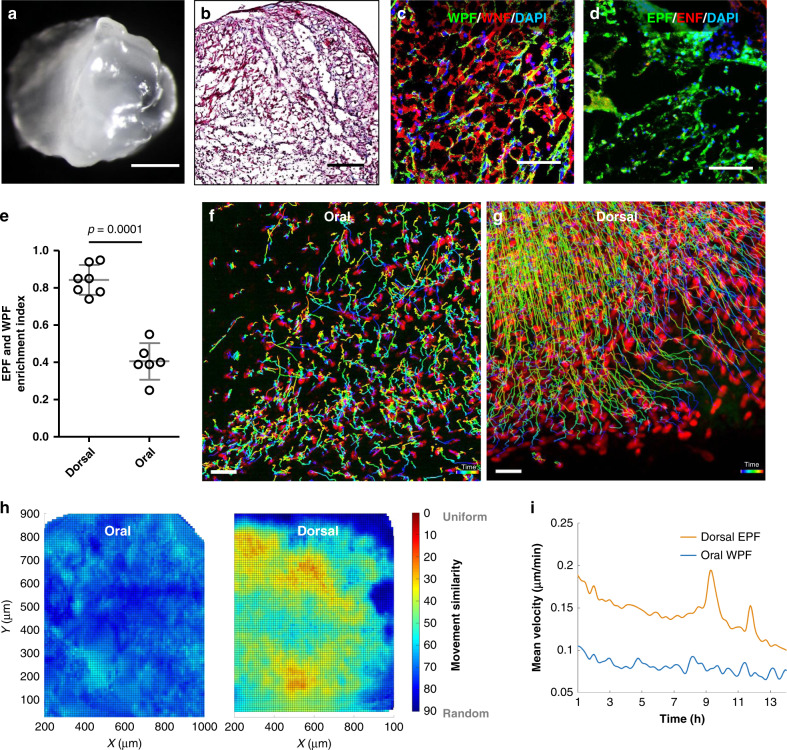
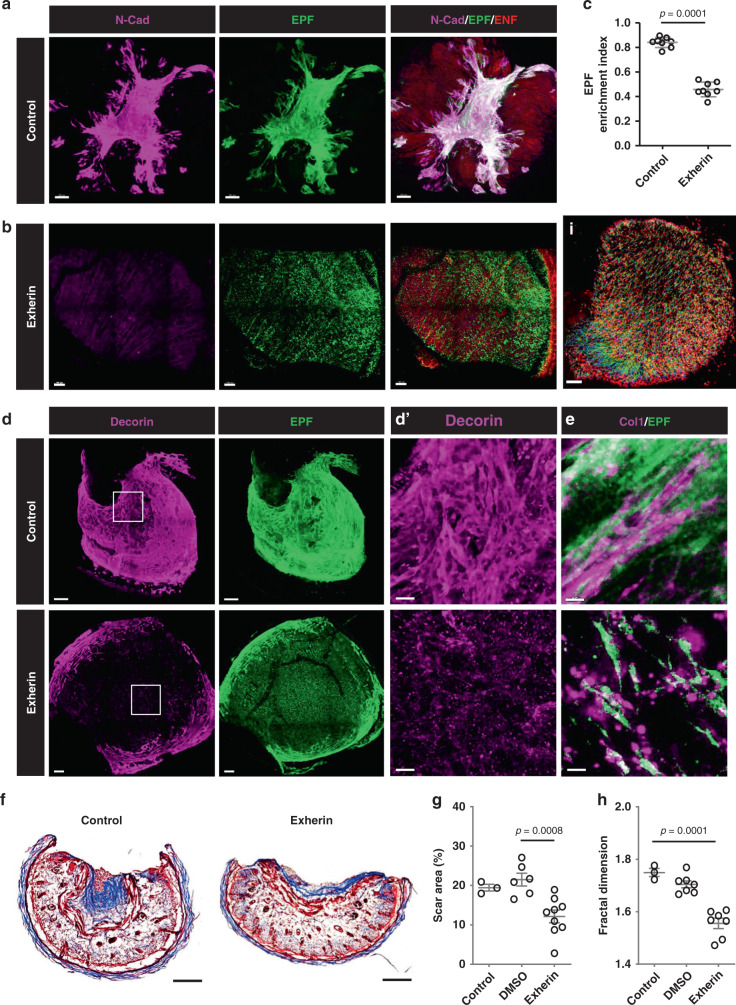
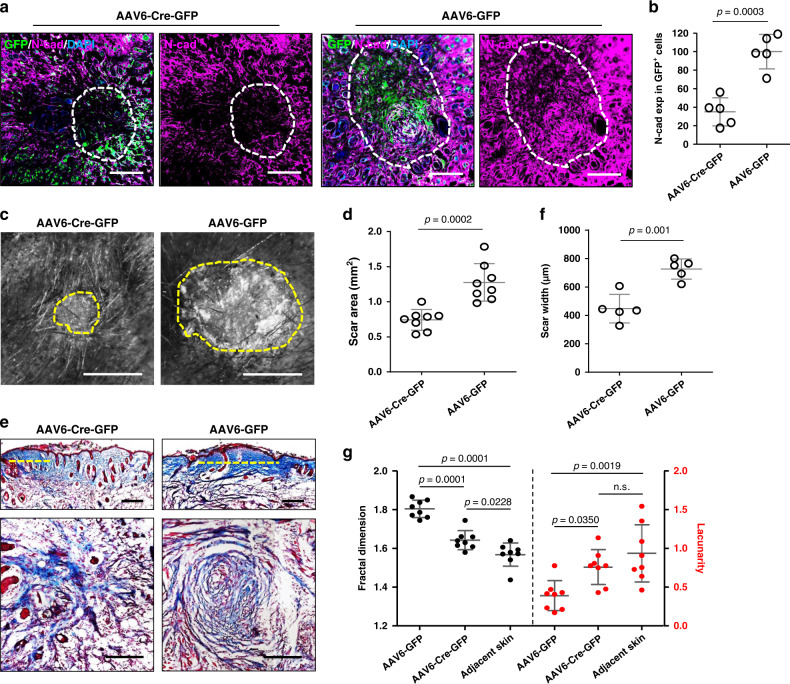
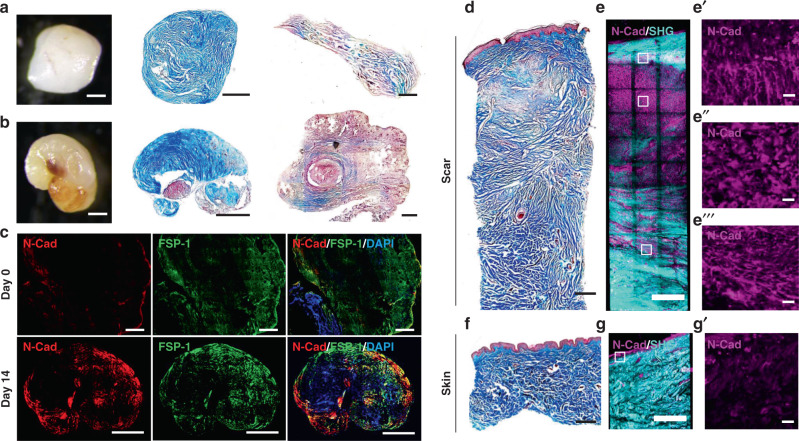
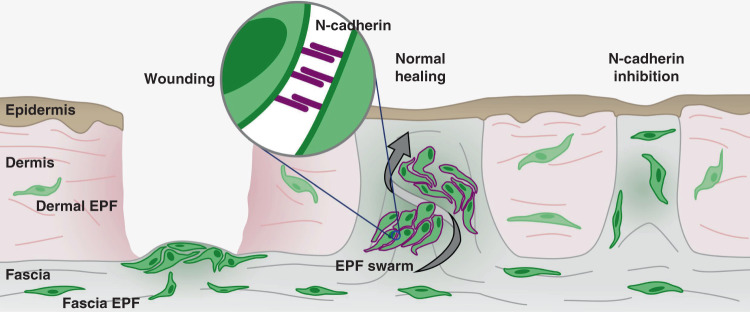
Scars are more severe when the subcutaneous fascia beneath the dermis is injured upon surgical or traumatic wounding. Here, we present a detailed analysis of fascia cell mobilisation by using deep tissue intravital live imaging of acute surgical wounds, fibroblast lineage-specific transgenic mice, and skin-fascia explants (scar-like tissue in a dish - SCAD). We observe that injury triggers a swarming-like collective cell migration of fascia fibroblasts that progressively contracts the skin and form scars. Swarming is exclusive to fascia fibroblasts, and requires the upregulation of N-cadherin. Both swarming and N-cadherin expression are absent from fibroblasts in the upper skin layers and the oral mucosa, tissues that repair wounds with minimal scar. Impeding N-cadherin binding inhibits swarming and skin contraction, and leads to reduced scarring in SCADs and in animals. Fibroblast swarming and N-cadherin thus provide therapeutic avenues to curtail fascia mobilisation and pathological fibrotic responses across a range of medical settings.


Conflict of interest statement

The authors declare no competing interests.

Figures

Fig. 1
Fig. 1. Collective migration of fascia EPFs in physiological in vivo wounds.
a Masson’s trichrome staining and fluorescence images of vertical sections and transverse cross sections of wounds at 7-dpi from En1Cre,R26mTmG mice. EPFs were shown in green, ENFs in red, nuclei stained with DAPI in blue. The yellow dashed lines in vertical sections indicate the position of the cross sections. b EPF enrichment index in uninjured normal fascia or wounded fascia. Mean ± SD, p = 0.0019, unpaired two-tailed t-test, n = 4. c Immunolabelling of α-SMA or DLK-1 in magenta of boxed area showed in a, and quantification of the percentages of α-SMA+ or DLK-1+ cells in EPFs and ENFs. Mean ± SD, unpaired two-tailed t-test, p = 0.0001 (α-SMA), p = 0.001 (DLK-1), n = 5. d 3D image of in vivo wound at 14-dpi on the back of En1Cre;R26mTmG mice. White boxes indicate field of view for intravital live imaging (Supplementary Movie 1) and particle image velocity (PIV) analysis. Images are representative of three biological replicates. e PIV analysis of EPF migration over the indicated time. The colour-coded vectors indicate the direction and displacement in pixels. f EPF channel of the first and last frames of the intravital recording (Supplementary Movie 2). The yellow dash lines indicate the leading front of invading fibroblasts, purple lines are predicted EPF cell orientation. g Contour lines are smoothened EPF leading front in selected frames from the intravital recording. Colours indicate time, bright for the beginning (t0) and dark for the end (tf). Cyan lines are predicted trajectories of EPF swarm that are perpendicular to contour lines. Scale bars: a, b, d = 500 µm; e, f = 50 µm.
Fig. 2
Fig. 2. Fascia EPFs swarm during scarring in SCAD.
a Whole-mount bright-field images and Masson’s trichrome staining with collagen in blue of fresh SCAD (day 0) and after 5-day culture (day 5). n > 1000. b, c Snapshots of live imaging of day 3 En1Cre;R26mTmG SCAD. Two independent EPF aggregates are encircled with a dotted line at time t = 0 h (b) and t = 12 h (c) (Supplementary Movie 4). Images are representative of four biological replicates. d PIV analysis of GFP channel from live imaging showed in Supplementary Movie 4. Arrowheads indicate the direction of particle movement. Particle velocity is indicated by a scale from slow (blue) to fast (red). Scale bar unit: pixel. dd″ Vector map from PIV analysis of the left swarm over 30–60 min (d′) and of the right swarm over 120–180 mins (d). e, f Colour-coded tracking of EPFs from live imaging (72–96 h) of En1Cre;R26LSL-H2B-mCherry SCAD, from top view (e) and side view (f). Colours indicate time, starting from blue to red at the end of the movie (Supplementary Movie 6). e Enlarged images of EPF migration tracks in the scar centre at the beginning of swarming (blue-to-cyan). f Enlarged images of EPF migration tracks at the end of swarming (green-to-orange). Images are representative of four biological replicates. Scale bars: a = 500 µm; b, c, e, f = 50 µm; e, f = 30 µm.
Fig. 3
Fig. 3. Fibroblast swarms are absent from oral mucosa SCAD.
a, b Whole-mount bright-field image (a) and Masson’s trichrome staining (b) of SCAD from buccal mucosa. n > 30. c, d Fluorescence images of SCAD from Wnt1Cre;R26mTmG buccal mucosa (c) and En1Cre;R26mTmG back-skin (d). e EPF and WPF enrichment index in day 5 En1Cre;R26mTmG dorsal SCAD or Wnt1Cre;R26mTmG oral SCAD, respectively. Mean ± SD, unpaired two-tailed t-test, p = 0.0001, n = 7/6. f, g Colour-coded tracking of WPFs in oral SCAD (f, Supplementary Movie 8) or tracking of EPFs in dorsal SCAD (g) on a mCherry nuclear reporter (72–96 h). The colour indicates the time, with purple at the beginning and red at the end of the movie. Images are representative of three biological replicates. h Movement similarity between WPF and EPF tracks is visualised in a scale from 0 (red, uniform migration) to 90 (blue, random migration). i Comparison of velocities of WPFs in oral SCADs (blue) versus fascia EPFs in dorsal SCAD (orange) over time. Lines shown are smoothing lines over all velocity values at each time point. Scale bars: a = 500 µm; b = 200 µm; c, d = 50 µm; f, g = 30 µm.
Fig. 4
Fig. 4. Fibroblast swarms are driven by N-cadherin.
3D immunolabelling of N-cadherin (magenta) in control (a) or 500 µg/ml Exherin treated (b) En1Cre;R26mTmG SCAD. c EPF enrichment index in control or Exherin-treated SCAD. Mean ± SD, p = 0.0001, unpaired two-tailed t-test, n = 8. 3D immunolabelling of decorin (d) or collagen I (e) in a control (upper panel) or Exherin-treated (lower panel, Supplementary Movie 10) SCAD. d High magnification of white box in d. f Masson’s trichrome staining of control (upper) or Exherin-treated (lower) SCAD. g Scar areas of control, or DMSO treated or Exherin-treated SCADs. One-way ANOVA Tukey’s test, p = 0.0008, n = 3/6/9. h Fractal dimension analysis of control, or DMSO treated or Exherin-treated SCADs. One-way ANOVA Tukey’s test, p = 0.0001, n = 3/7/7. i Colour-coded tracking of fascia EPFs from live imaging (72–96 h) of 500 µg/ml Exherin-treated En1Cre;R26LSL-H2B-mCherry SCAD. Colours indicate time, starting from blue to red at the end of the movie (Supplementary Movie 11). Scale bars: a, b, d, i = 100 µm; d = 20 µm; e = 50 µm.
Fig. 5
Fig. 5. N-cadherin is crucial for scar formation in vivo.
N-cadherin was locally knockout around wounds on Ncadfl/lfl mice by injection of Cre-expressing AAV6-Cre-GFP virus. AAV6-GFP virus served as control. a Immunolabelling of N-cadherin on transverse cross-sections of harvested scars on 14-dpi. GFP indicates transduced cells. Dash lines outline the scar edges. b N-cadherin expression in GFP+ cells based on immunofluorescence analysis. Data are normalised on the mean of N-cadherin expression in AAV6-GFP wounds. Mean ± SD, n = 5, p = 0.0003, unpaired two-tailed t-test. c Stereomicroscopic images of AAV6-Cre-GFP and AAV6-GFP treated scars at 14-dpi. The yellow dash lines indicate the scar edge. d Quantification of scar area based on histomorphometric analysis. Mean ± SD, n = 8, p = 0.0002, unpaired two-tailed t-test. e Masson’s trichrome stained vertical (upper panel) and transverse (lower panel) sections from AAV6-Cre-GFP and AAV6-GFP treated scars. The dash lines indicate scar width. f Quantification of scar width based on histomorphometric analysis. Mean ± SD, n = 5, p = 0.001, unpaired two-tailed t-test. g Fractal dimension and lacunarity analysis of AAV6-Cre-GFP and AAV6-GFP treated scars and adjacent normal skin. Mean ± SD, one-way ANOVA Tukey’s test, n = 8, p values from multiple comparisons are shown in the graph. Scale bars: a, d = 200 µm; b = 500 µm.
Fig. 6
Fig. 6. N-cadherin is involved in scar formation in human skin.
a, b whole-mount bright-field image and Masson’s trichrome staining of SCADs made from human eyelid skin (a) or thigh skin (b) 14 days after culture (middle). The histology of respective fresh SCADs is shown in right column. n > 100. c Immunolabelling of N-cadherin (red) and FSP1 (green) of human SCAD at day 0 and day 14. dg Masson’s trichrome staining and 3D immunostaining of N-cadherin on biopsy from human breast hypertrophic scar (d, e) or adjacent breast skin (f, g). N-cadherin (magenta), SHG (cyan). The enlarged images of the N-cadherin channel indicated by white boxes in e, g are shown in e′, e″, e and g′, respectively. Scale bars = 500 µm, except ee″′, g = 20 µm.
Fig. 7
Fig. 7. Scheme of N-cadherin mediated fascia EPF swarms upon wounding and scarring.
upon deep wounding, fascia EPFs assemble into aggregates and migrate collectively towards wound centre and then swarm towards epidermis by N-cadherin (purple) mediated cell-cell adhesion. Fascia EPF swarming triggers fascia mobilisation into wounds, contracts skin and drives scar formation. EPF swarms are absent in the tissues without fascia (e.g. oral mucosa) or when N-cadherin is inhibited by chemicals (eg. Exherin) or genetic mutations. The absence of collective migration of fascia EPF swarms results in less scar formation.

References

    1. Huang TT, Blackwell SJ, Lewis SR. Ten years of experience in managing patients with burn contractures of axilla, elbow, wrist, and knee joints. Plast. Reconstr. Surg. 1978;61:70–76. doi: 10.1097/00006534-197801000-00012. - DOI - PubMed
    1. Palmieri TL, et al. Alterations in functional movement after axillary burn scar contracture: a motion analysis study. J. Burn Care Rehabil. 2003;24:104–108. doi: 10.1097/01.BCR.0000054170.62555.09. - DOI - PubMed
    1. Prasad JK, Bowden ML, Thomson PD. A review of the reconstructive surgery needs of 3167 survivors of burn injury. Burns. 1991;17:302–305. doi: 10.1016/0305-4179(91)90044-H. - DOI - PubMed
    1. Sen CK, et al. Human skin wounds: a major and snowballing threat to public health and the economy. Wound Repair Regen. 2009;17:763–771. doi: 10.1111/j.1524-475X.2009.00543.x. - DOI - PMC - PubMed
    1. Sund, B. New Developments In Wound Care. 1–255 (London, PJB Publications, 2000). Clinical Report CBS 836.

Publication types

MeSH terms