

Humanized COVID-19 decoy antibody effectively blocks viral entry and prevents SARS-CoV-2 infection
- PMID: 33159417
- PMCID: PMC7799362
- DOI: 10.15252/emmm.202012828
Humanized COVID-19 decoy antibody effectively blocks viral entry and prevents SARS-CoV-2 infection
Abstract
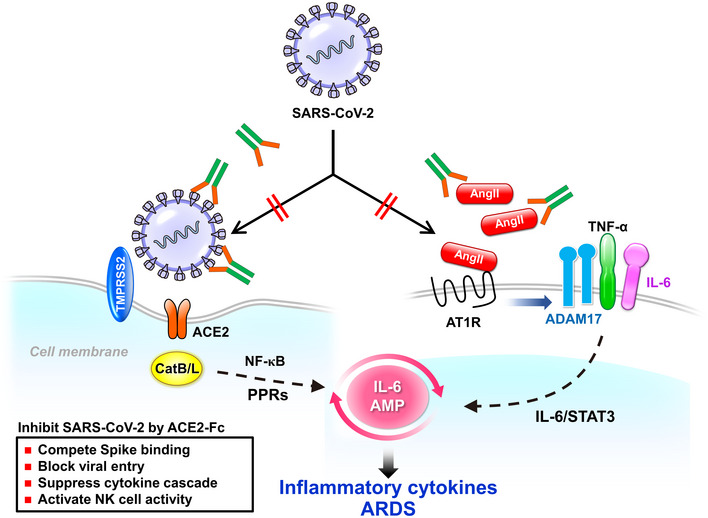
To circumvent the devastating pandemic caused by severe acute respiratory syndrome coronavirus 2 (SARS-CoV-2) infection, a humanized decoy antibody (ACE2-Fc fusion protein) was designed to target the interaction between viral spike protein and its cellular receptor, angiotensin-converting enzyme 2 (ACE2). First, we demonstrated that ACE2-Fc could specifically abrogate virus replication by blocking the entry of SARS-CoV-2 spike-expressing pseudotyped virus into both ACE2-expressing lung cells and lung organoids. The impairment of viral entry was not affected by virus variants, since efficient inhibition was also observed in six SARS-CoV-2 clinical strains, including the D614G variants which have been shown to exhibit increased infectivity. The preservation of peptidase activity also enables ACE2-Fc to reduce the angiotensin II-mediated cytokine cascade. Furthermore, this Fc domain of ACE2-Fc was shown to activate NK cell degranulation after co-incubation with Spike-expressing H1975 cells. These promising characteristics potentiate the therapeutic prospects of ACE2-Fc as an effective treatment for COVID-19.
Keywords: ACE2-Fc; COVID-19; SARS-CoV-2; decoy antibody; virus infection.
© 2020 The Authors. Published under the terms of the CC BY 4.0 license.
Conflict of interest statement
The authors declare that they have no conflict of interest.
Figures
- A
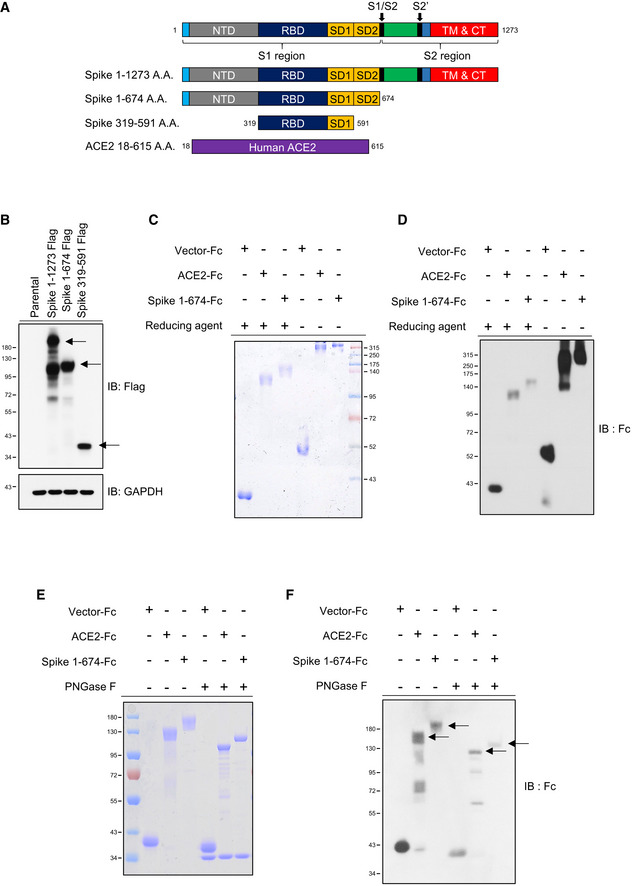
Schematic diagram of SARS‐CoV‐2 Spike protein and the Spike constructs, Spike 1–1,273 (full length), 1–674 (S1), and 319–591 (RBD‐SD1) used in this study. The arrows indicate the cleavage sites of furin and TMPRSS2.
- B
Western blot analysis of SARS‐CoV‐2 Spike 1–1,273, 1–674, and 319–591 expression in HEK293T cells. The black arrows indicate the location of the induced target proteins.
- C
Detection of decoy antibody ACE2‐Fc and Spike S1‐Fc chimeric homodimer formation in nonreducing Coomassie Brilliant Blue staining.
- D
Recognition of the ACE2‐Fc and Spike S1‐Fc by anti‐human IgG Fc antibody in nonreducing sodium dodecyl sulfate–polyacrylamide gel electrophoresis (SDS–PAGE).
- E, F
Deglycosylation of ACE2‐Fc and Spike 1‐674‐Fc by PNGase F. PNGase F digested ACE2‐Fc (500 ng) and Spike 1‐674‐Fc (500 ng) were subjected to Coomassie Brilliant Blue staining (E) and Western blot analysis by anti‐human IgG Fc antibody (F).
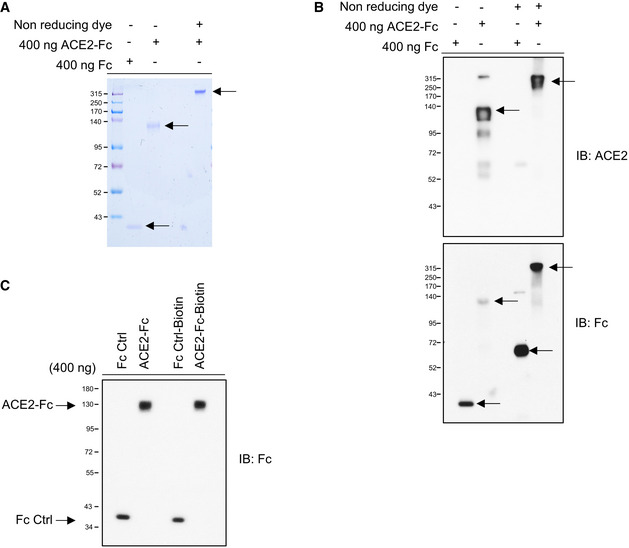
The purity and molecular size of purified ACE2‐Fc. The ACE2‐Fc in the supernatants were purified by Protein G Sepharose (Merck). A single band of ACE2‐Fc was observed by Coomassie Brilliant Blue staining using reducing or nonreducing loading dye. The black arrows indicate the location of the induced target proteins.
Recognition of the decoy antibody by anti‐ACE2 antibody and anti‐human IgG Fc antibody. Purified ACE2‐Fc formed homodimers in nonreducing SDS–PAGE. The black arrows indicate the location of the induced target proteins.
The purity of biotin‐labeled ACE2‐Fc or Fc control was immunoblotted with an anti‐human IgG Fc antibody. IB: immunoblotted with the indicated antibodies.
- A, B
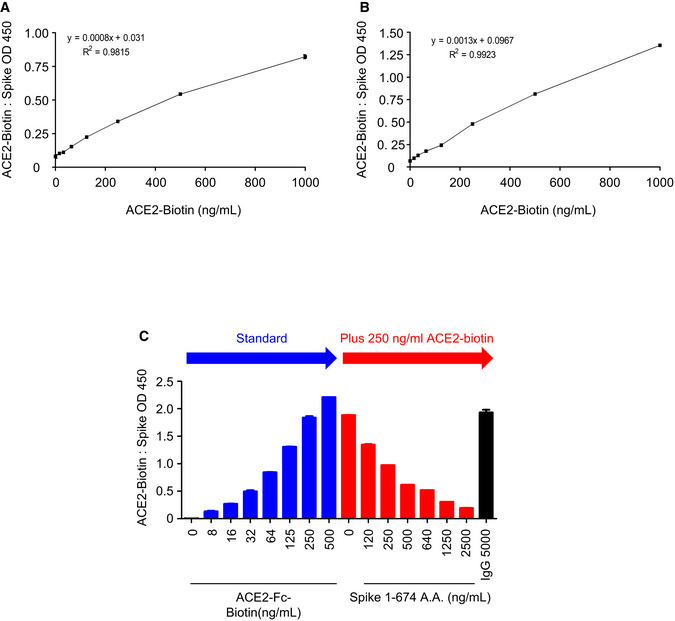
ACE2‐Fc was serially diluted and dispensed into wells coated with Spike 1–674 (S1) (A) or Spike 319–591 (RBD‐SD1) (B), and the binding activity was analyzed by ELISA.
- C
The soluble form of Spike 1–674 protein blocked the ACE2‐Biotin: Spike 1–674 interaction. RBD: receptor‐binding domain; SD: connector domain. Error bars represent the standard deviation (SD), n = 2.
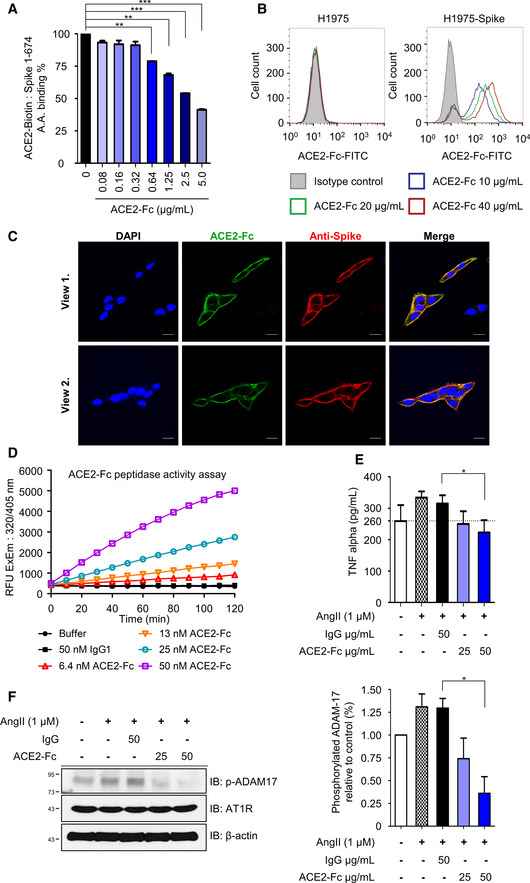
Competitive ELISA. ACE2‐Fc can compete with ACE2‐Fc‐Biotin for Spike 1‐674 binding in a dose‐dependent manner. The competition effects of ACE2‐Fc on ACE2‐Spike protein binding were normalized to PBS control. Error bars represent the standard deviation (SD), n = 2. Statistical analysis was performed by unpaired two‐tail t‐test. **P < 0.01, ***P < 0.001.
Recognition of full‐length Spike on H1975 (left panel as negative control) or H1975‐Spike (right panel) cells by ACE2‐Fc using flow cytometry analysis. Isotype control: 40 μg/ml mouse IgG‐FITC.
Confocal microscopy of H1975‐Spike‐overexpressing cells. Spikes on H1975 cells were stained with anti‐Spike antibody and Alexa Fluor® 594‐conjugated secondary antibody on ice for 1 h. After that, ACE2‐Fc‐FITC was incubated for another 1 h. Scale bars equal to 20 µm. DAPI was used as a nuclear counterstain.
Preservation of ACE2‐Fc peptidase activity. The peptidase activity of ACE2‐Fc was measured by cleavage of the fluorescent peptide substrates.
Inhibition of angiotensin II (Ang II)‐induced TNF‐α production by ACE2‐Fc. Ang II was preincubated with indicated amounts of ACE2‐Fc or IgG for 30 min. After that, the mixtures were added to RAW264.7 cells for 12 h. The concentration of TNF‐α in the culture medium was determined by ELISA. Error bars represent the standard deviation (SD), n = 3. Statistical analysis was performed by unpaired two‐tail t‐test. *P < 0.05. The dotted line represents the mean value of TNF‐α in control group.
Inhibition of Ang II‐induced ADAM17 (a disintegrin and metalloprotease 17) phosphorylation by ACE2‐Fc. The protein extracts from (E) were immunoblotted with the indicated antibodies (left panel). β‐actin served as the loading control. The signal intensity was normalized to cells only (right panel). Data are representative of three independent experiments, and the values are expressed as the mean ± SD (right panel). Error bars represent the standard deviation (SD), n = 2. Statistical analysis was performed by unpaired two‐tail t‐test. *P < 0.05. IgG represents the human normal IgG control.
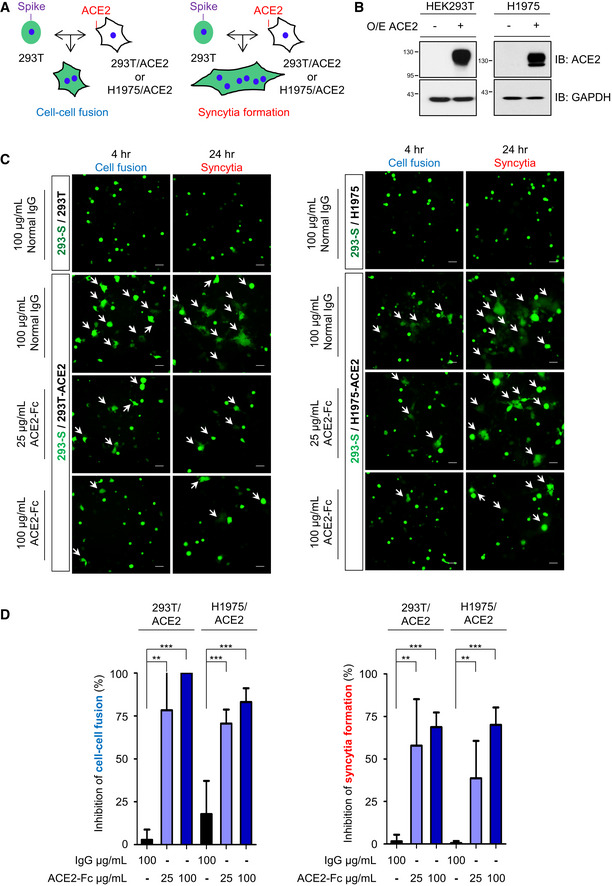
The schematic diagram for cell–cell fusion and syncytia formation.
HEK293 and H1975 cells were transduced with full‐length ACE2 by lentivirus. Protein extracts were immunoblotted with the indicated antibodies. O/E represents overexpression.
GFP and full‐length Spike cotransfected HEK293T cells were used as effector cells (293‐S). HEK293/ACE2 (HEK293T‐overexpressing ACE2) (left panel) or H1975/ACE2 (H1975‐overexpressing ACE2) (right panel) cells were used as target cells. The 293‐S cells were preincubated with normal human IgG or ACE2‐Fc at 37°C for 1 h. After that, the mixtures were added to target cells for 4 h (cell–cell fusion) or 24 h (syncytia formation). The fluorescent areas were measured by inverted fluorescence microscopy and Metamorph software (Metamorphosis). Scale bars equal to 50 µm. The white arrows indicate the cell–cell fusion or syncytia formation.
The inhibition of cell–cell fusion and syncytia formation by ACE2‐Fc in HEK293/ACE2 and H1975/ACE2 was determined with the formula described in the Materials and Methods section. Error bars represent the standard deviation (SD), n = 6. Statistical analysis was performed by unpaired two‐tail t‐test. **P < 0.01, ***P < 0.001.
- A, B
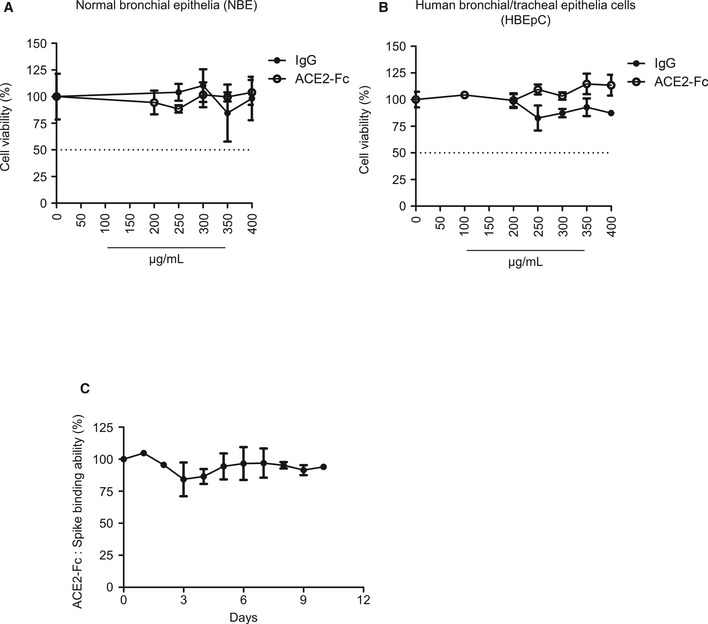
Two normal human bronchial epithelial cells were incubated with ACE2‐Fc and normal human IgG at the indicated concentrations for 72 h, and cell viability was analyzed by MTS assay. Error bars represent the standard deviation (SD), n = 2 in left; n = 3 in right. The dotted line represents the 50% of cell viability.
- C
In vitro serum stability of ACE2‐Fc. ACE2‐Fc was incubated with 50% normal human serum at 37°C for up to 10 days. At the indicated time points, samples were collected to quantify the binding ability of ACE2‐Fc to Spike proteins by ELISA. Error bars represent the standard deviation (SD), n = 3. Experiments were performed at least three times with similar results.
- A
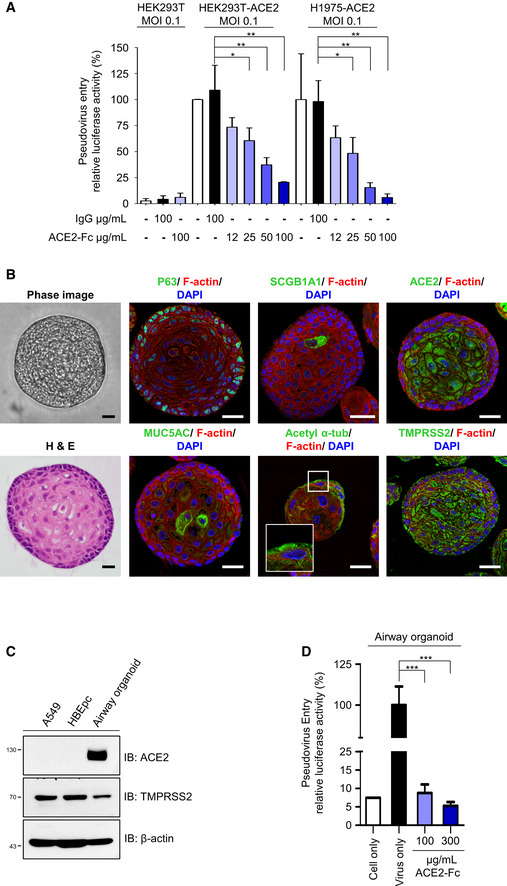
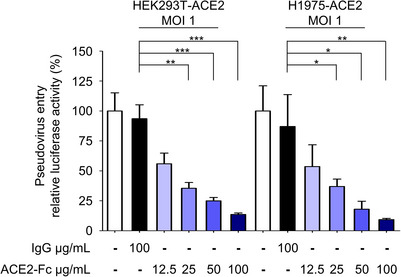
ACE2‐Fc blocked the entry of Spike‐expressing pseudotyped lentivirus into HEK293T‐ACE2 and H1975‐ACE2 cells. The relative luciferase activities, normalized to the only virus group, represent the efficiency of virus entry. MOI: Multiplicity of infection.
- B–D
Airway organoid model system. (B) Confocal microscopy images of the airway organoids. The green fluorescence represents the specific staining of indicated monoclonal antibodies and Alexa Fluor 488‐conjugated secondary antibodies. DAPI was used as a nuclear counterstain. Hematoxylin and eosin (H&E) stain: hematoxylin stained the nuclei in blue color; eosin stained the cytoplasm in pink color. Scale bars equal to 20 µm. (C) Lung cancer A549 cells, human normal bronchial epithelial cells (HBEpc), and HBEpc‐differentiated cells (airway organoids) were harvested for immunoblotting with the indicated antibodies. (D) Blockage of pseudovirus entry into airway organoids by ACE2‐Fc. Mixtures of pseudotyped lentivirus with or without ACE2‐Fc were cocultured with airway organoids for 72 h. The virus entry was determined by quantifying the luciferase activity in the cell lysates.
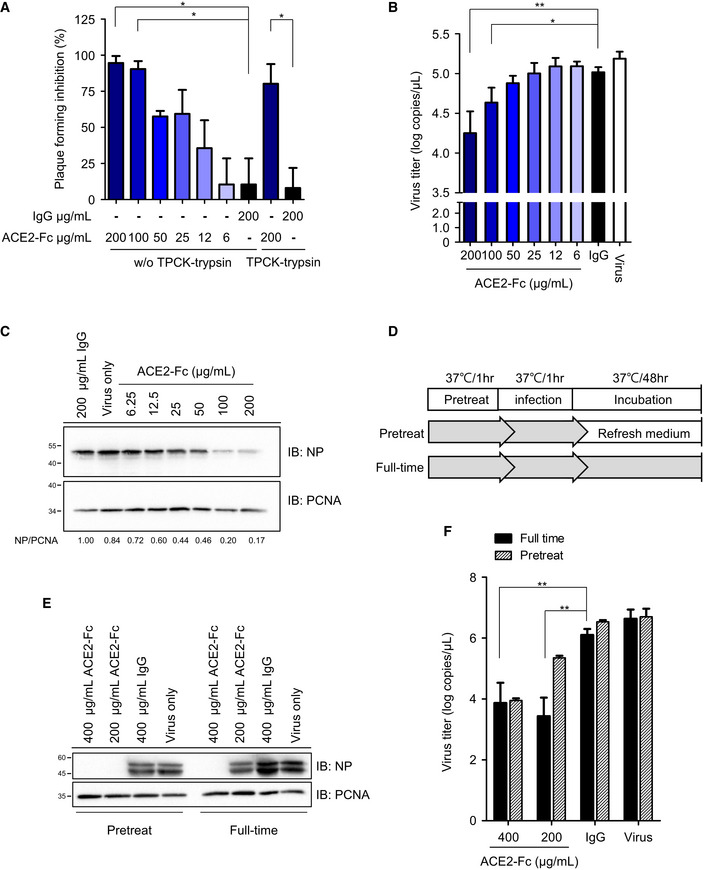
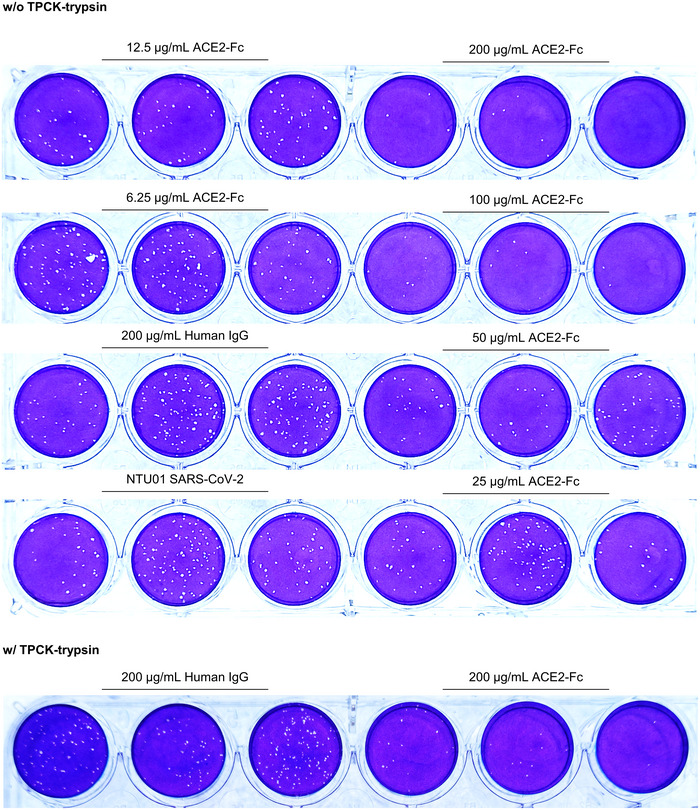
- A
Inhibition of SARS‐CoV‐2 infection by ACE2‐Fc in the plaque assay. Mixtures of ACE2‐Fc and SARS‐CoV‐2 were incubated for 1 h before adding to Vero E6 cells for another 1 h at 37°C. The ACE2‐Fc and SARS‐CoV‐2 premixtures were removed, and the cells were washed once with PBS and overlaid with methylcellulose with 2% FBS for 5–7 days before being stained with crystal violet. Those results showed increase of plaque formation was regarded as no inhibition of plaque formation. TPCK‐treated trypsin: N‐tosyl‐
l ‐phenylalanine chloromethyl ketone‐treated trypsin. - B, C
Yield reduction assay was performed to determine the inhibitory effects of ACE2‐Fc on virus titers and protein expression. The culture medium and cell extracts were harvested 24 h postinfection for real‐time PCR (B) and Western blot (C). The NP/PCNA represents the relative NP expression as compared to that of PCNA, which served as a loading control. The NP/PCNA numbers below the panel are the ratios of NP/PCNA normalized to that of the human IgG control group. PCNA: Proliferating cell nuclear antigen.
- D
Schematic illustration of the ACE2‐Fc pretreatment and full‐time experiment procedure, delineating the stages where the ACE2‐Fc was present during the experiment.
- E
The cell lysates from the pretreatment and full‐time experiments were harvested and immunoblotted with the indicated antibodies.
- F
The SARS‐CoV‐2 titer in the pretreatment and full‐time experiments was analyzed by real‐time PCR.
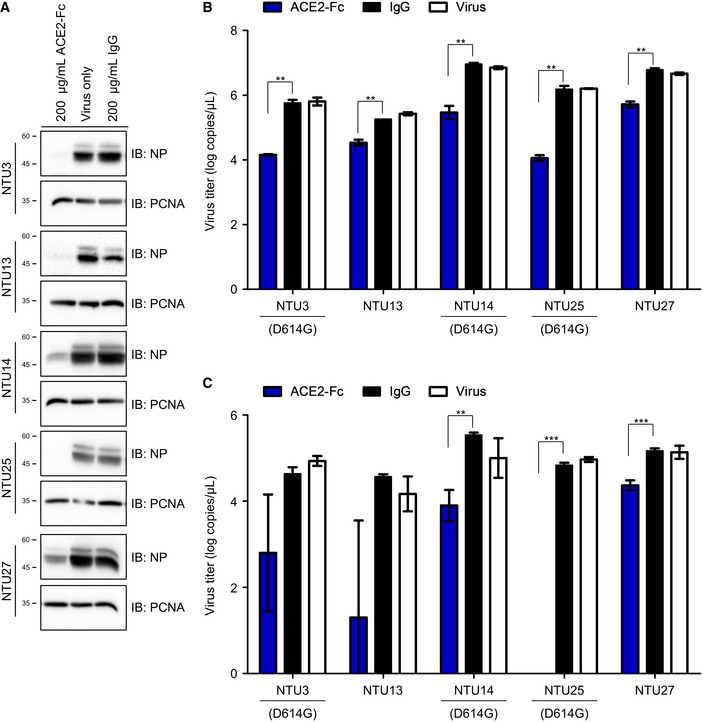
- A
The (A) NP proteins in the cell lysates were determined by Western blot analysis.
- B, C
The virus RNA in the (B) culture medium and (C) cell lysates was quantified by real‐time RT–PCR. The genetic information and sequence reference numbers for the 5 SARS‐CoV‐2 strains were summarized in Table EV1. Error bars represent the standard deviation (SD), n = 3. Statistical analysis was performed by unpaired two‐tail t‐test. **P < 0.01, ***P < 0.001. Experiments were performed at least three times with similar results.
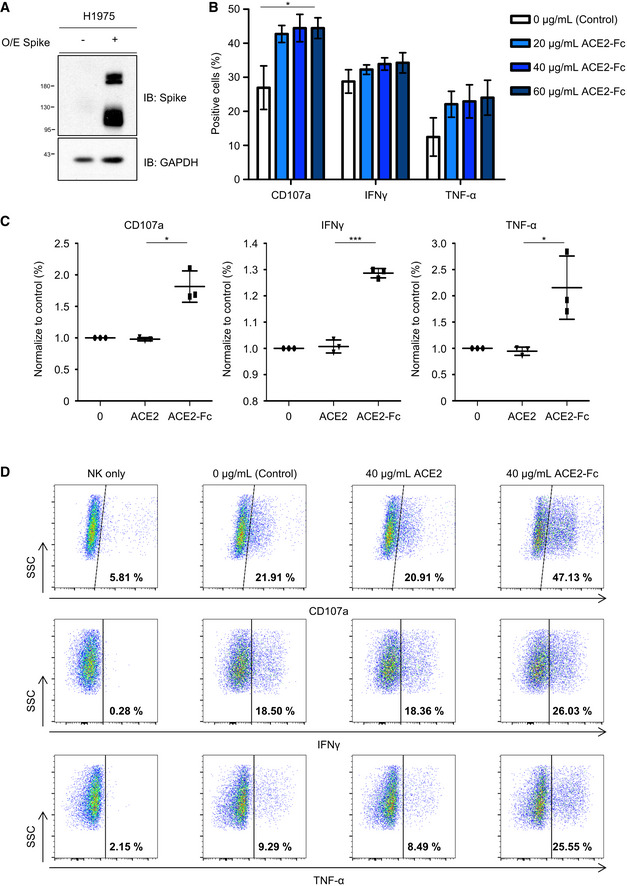
H1975 cells were transduced with full‐length Spike by Lentiviral vector. Protein extracts were immunoblotted with the indicated antibodies. O/E represents overexpress.
The effect of ACE2‐Fc activation on degranulative capacity of NK cells. The experiments were performed with the primary human NK cells derived from three independent donors. Error bars represent the standard deviation (SD), n = 3. Statistical analysis was performed by unpaired two‐tail t‐test. *P < 0.05 (each concentration of ACE2‐Fc vs. control).
The CD107a, IFN‐γ, and TNF‐α expression levels were determined by flow cytometry after the NK cells and H1975‐Spike cells co‐incubation in the presence or absence of ACE2‐Fc or ACE2 control. Error bars represent the standard deviation (SD), n = 3. Statistical analysis was performed by unpaired two‐tail t‐test. *P < 0.05. The percentage of positive cells in both groups was normalized to the NK/H1975‐Spike only group.
The differential expression of degranulation markers after the treatment of ACE2‐Fc or ACE2 by the flow cytometry. The numbers in each plot indicate the percentages of positive cells.
Similar articles
-
The chaperone GRP78 is a host auxiliary factor for SARS-CoV-2 and GRP78 depleting antibody blocks viral entry and infection.J Biol Chem. 2021 Jan-Jun;296:100759. doi: 10.1016/j.jbc.2021.100759. Epub 2021 May 7. J Biol Chem. 2021. PMID: 33965375 Free PMC article.
-
Characterization of a Novel ACE2-Based Therapeutic with Enhanced Rather than Reduced Activity against SARS-CoV-2 Variants.J Virol. 2021 Sep 9;95(19):e0068521. doi: 10.1128/JVI.00685-21. Epub 2021 Sep 9. J Virol. 2021. PMID: 34287040 Free PMC article.
-
The ACE2 decoy receptor can overcome immune escape by rapid mutating SARS-CoV-2 variants and reduce cytokine induction and clot formation.J Biomed Sci. 2025 Jun 26;32(1):59. doi: 10.1186/s12929-025-01156-4. J Biomed Sci. 2025. PMID: 40571942 Free PMC article.
-
Potential therapeutic approaches for the early entry of SARS-CoV-2 by interrupting the interaction between the spike protein on SARS-CoV-2 and angiotensin-converting enzyme 2 (ACE2).Biochem Pharmacol. 2021 Oct;192:114724. doi: 10.1016/j.bcp.2021.114724. Epub 2021 Aug 8. Biochem Pharmacol. 2021. PMID: 34371003 Free PMC article. Review.
-
Angiotensin-Converting Enzyme 2 (ACE2) in the Pathogenesis of ARDS in COVID-19.Front Immunol. 2021 Dec 22;12:732690. doi: 10.3389/fimmu.2021.732690. eCollection 2021. Front Immunol. 2021. PMID: 35003058 Free PMC article. Review.
Cited by
-
Broad-Spectrum Anti-coronavirus Vaccines and Therapeutics to Combat the Current COVID-19 Pandemic and Future Coronavirus Disease Outbreaks.Stem Cell Reports. 2021 Mar 9;16(3):398-411. doi: 10.1016/j.stemcr.2020.12.010. Stem Cell Reports. 2021. PMID: 33691145 Free PMC article. Review.
-
Picomolar inhibition of SARS-CoV-2 variants of concern by an engineered ACE2-IgG4-Fc fusion protein.Antiviral Res. 2021 Dec;196:105197. doi: 10.1016/j.antiviral.2021.105197. Epub 2021 Nov 10. Antiviral Res. 2021. PMID: 34774603 Free PMC article.
-
Development of nanoparticles incorporated with quercetin and ACE2-membrane as a novel therapy for COVID-19.J Nanobiotechnology. 2024 Apr 12;22(1):169. doi: 10.1186/s12951-024-02435-2. J Nanobiotechnology. 2024. PMID: 38609998 Free PMC article.
-
An ACE2 Triple Decoy that neutralizes SARS-CoV-2 shows enhanced affinity for virus variants.Sci Rep. 2021 Jun 17;11(1):12740. doi: 10.1038/s41598-021-91809-9. Sci Rep. 2021. PMID: 34140558 Free PMC article.
-
Inhibition of SARS-CoV-2 Spike Protein Pseudotyped Virus Infection Using ACE2-Tethered Micro/Nanoparticles.Bioengineering (Basel). 2023 May 26;10(6):652. doi: 10.3390/bioengineering10060652. Bioengineering (Basel). 2023. PMID: 37370582 Free PMC article.
References
-
- Enari M, Talanian RV, Wong WW, Nagata S (1996) Sequential activation of ICE‐like and CPP32‐like proteases during Fas‐mediated apoptosis. Nature 380: 723–726 - PubMed
-
- Esteban V, Lorenzo O, Ruperez M, Suzuki Y, Mezzano S, Blanco J, Kretzler M, Sugaya T, Egido J, Ruiz‐Ortega M (2004) Angiotensin II, via AT1 and AT2 receptors and NF‐kappaB pathway, regulates the inflammatory response in unilateral ureteral obstruction. J Am Soc Nephrol 15: 1514–1529 - PubMed
Publication types
MeSH terms
Substances
Grants and funding
- AS-SUMMIT-108; AS-SUMMIT-109; AS-KPQ-109-BioMed/Academia Sinica
- MOST 107-0210-01-19-01/Ministry of Science and Technology, Taiwan (MOST)
- MOST 108-3114-Y-001-002, MOST 109-2314-B-002-254, MOST 109-2314-B-002-277 and MOST 109-2124-M-002-012-, MOST 107-2320-B-002-016-MY3, MOST 109-2327-B-002-009/Ministry of Science and Technology, Taiwan (MOST)
LinkOut - more resources
Full Text Sources
Other Literature Sources
Medical
Miscellaneous
