. 2020 Nov 7;10(1):136.
doi: 10.1186/s13550-020-00726-x.

Differences in [18F]FDG uptake in BAT of UCP1 -/- and UCP1 +/+ during adrenergic stimulation of non-shivering thermogenesis

Affiliations

Differences in [18F]FDG uptake in BAT of UCP1 -/- and UCP1 +/+ during adrenergic stimulation of non-shivering thermogenesis

Christian T McHugh et al. EJNMMI Res. .

Abstract

Background: Brown adipose tissue (BAT) is a fat tissue found in most mammals that helps regulate energy balance and core body temperature through a sympathetic process known as non-shivering thermogenesis. BAT activity is commonly detected and quantified in [18F]FDG positron emission tomography/computed tomography (PET/CT) scans, and radiotracer uptake in BAT during adrenergic stimulation is often used as a surrogate measure for identifying thermogenic activity in the tissue. BAT thermogenesis is believed to be contingent upon the expression of the protein UCP1, but conflicting results have been reported in the literature concerning [18F]FDG uptake within BAT of mice with and without UCP1. Differences in animal handling techniques such as feeding status, type of anesthetic, type of BAT stimulation, and estrogen levels were identified as possible confounding variables for [18F]FDG uptake. In this study, we aimed to assess differences in BAT [18F]FDG uptake between wild-type and UCP1-knockout mice using a protocol that minimizes possible variations in BAT stimulation caused by different stress responses to mouse handling.

Results: [18F]FDG PET/CT scans were run on mice that were anesthetized with pentobarbital after stimulation of non-shivering thermogenesis by norepinephrine. While in wild-type mice [18F]FDG uptake in BAT increased significantly with norepinephrine stimulation of BAT, there was no consistent change in [18F]FDG uptake in BAT of mice lacking UCP1.

Conclusions: [18F]FDG uptake within adrenergically stimulated BAT of wild-type and UCP1-knockout mice can significantly vary such that an [18F]FDG uptake threshold cannot be used to differentiate wild-type from UCP1-knockout mice. However, while an increase in BAT [18F]FDG uptake during adrenergic stimulation is consistently observed in wild-type mice, in UCP1-knockout mice [18F]FDG uptake in BAT seems to be independent of β3-adrenergic stimulation of non-shivering thermogenesis.

Keywords: Brown adipose tissue; Infrared thermography; Standardized uptake value; Thermogenesis; Uncoupling protein 1; [18F]FDG.


Conflict of interest statement

The authors declare that they have no competing interests.

Figures
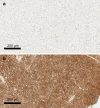
Fig. 1
Fig. 1
Immunohistochemistry staining of interscapular BAT dissected from WT and KO mice. a KO, b WT genotypes within breeding colonies were validated with UCP1 staining of dissected interscapular BAT. Slides are shown at 50% zoom. The lack of protein in our KO mice was confirmed, and UCP1 was strongly expressed in the BAT cells of our WT mice
Fig. 2
Fig. 2
Average rectal temperature of male WT and KO mice after NE injection during [18F]FDG uptake for Set 2. To further corroborate the difference in BAT thermogenic capacity of our WT (blue) and KO (white) mice, rectal temperature was also recorded during the [18F]FDG uptake in the second set of experiments. Here, by studying mice of similar size, and by carefully controlling both NE dose and room temperature conditions, we were able to detect a significant (p < 0.001) difference in the increase in rectal temperature between WT and KO mice. Error bars represent the standard deviation at each time point
Fig. 3
Fig. 3
Example of fused [18F]FDG PET/CT images acquired from unfasted male WT and KO mice after NE injection. Images are displayed on the same SUV scale on a sagittal view. For each mouse, a 5 mm2 ROI (circle) was drawn around the region of maximum intensity within interscapular BAT (arrow), and the corresponding SUVpeak was calculated. Displayed on the left column are two different WT mice that present very different glucose uptake. Represented on the right column are two KO mice with very different [18F]FDG uptake
Fig. 4
Fig. 4
[18F]FDG SUVpeak within interscapular BAT of unfasted female and male mice after NE injection. SUVpeak is plotted for each genotype. Means (short) and standard deviations (long) for each group are represented by horizontal gray bars. A statistically significant difference between WT (blue) and KO (white) SUVpeak was only observed for female mice (p = 0.002). There was no evidence that the effect of the genotype depended on the sex of the mouse (p = 0.1)
Fig. 5
Fig. 5
Example of fused [18F]FDG PET/CT images acquired from fasted male WT and KO mice with and without NE injection. Images are displayed on the same SUV scale on a sagittal view. Male mice from Set 2 were subject to scans with (top row) and without (bottom row) NE injection. The arrows indicate regions of interscapular BAT, and circles indicate the 5 mm2 ROI centered around the local maximum that was used to measure SUVpeak. While uptake increases after NE injection for the WT mouse (left column), uptake for the KO mouse (right column) seems suppressed upon NE injection
Fig. 6
Fig. 6
[18F]FDG SUVpeak within interscapular BAT of fasted male mice after NE injection. SUVpeak is plotted for each genotype. Means (short) and standard deviations (long) for each group are represented by horizontal gray bars. With fasting, a statistically significant difference between male WT (blue) and KO (white) SUVpeak was observed (p = 0.03). However, the WT and KO SUVpeak ranges still overlapped and a clear SUV threshold to differentiate animals with very different thermogenic capacity cannot be established, despite animal fasting
Fig. 7
Fig. 7
Correlation between rectal temperature and SUVpeak. The change in rectal temperature during [18F]FDG PET/CT image acquisition is plotted against SUVpeak for Set 2. Although the data show a significant correlation (p = 0.046) between the change in rectal temperature and SUVpeak during NE stimulation of BAT thermogenesis, the increase in rectal temperature, in general, cannot be taken as a surrogate measure of BAT thermogenesis
Fig. 8
Fig. 8
Effect of NE injection on SUVpeak for fasted male mice. SUVpeak is plotted for each genotype with (w/NE) and without (w/o NE) NE injection. There is a significant increase in the SUVpeak in the WT mice with NE injection (p < 0.001). On the other hand, SUVpeak in KO mice seems to either stay the same or decrease with NE injection. In addition, the average SUVpeak in KO mice without NE stimulation is much higher than that in WT mice (p = 0.046)

Similar articles

Cited by

References

    1. Cannon B, Nedergaard J. Brown adipose tissue: function and physiological significance. Physiol Rev (Internet) 2004;84(1):277–359. doi: 10.1152/physrev.00015.2003. - DOI - PubMed
    1. Trayhurn P, Thurlby PL, James WPT. Thermogenic defect in pre-obese ob/ob mice. Nature. 1977;266:60–62. doi: 10.1038/266060a0. - DOI - PubMed
    1. Himms-Hagen J. Brown adipose tissue thermogenesis, energy balance, and obesity. Can J Biochem Cell Biol (Internet) 1984;62(7):610–617. doi: 10.1139/o84-081. - DOI - PubMed
    1. Cypess AM, Lehman S, Williams G, Tal I, Rodman D, Goldfine AB, et al. Identification and importance of brown adipose tissue in adult humans. N Engl J Med (Internet) 2009;360(15):1509–1517. doi: 10.1056/NEJMoa0810780. - DOI - PMC - PubMed
    1. Yoneshiro T, Aita S, Matsushita M, Kameya T, Nakada K, Kawai Y, et al. Brown adipose tissue, whole-body energy expenditure, and thermogenesis in healthy adult men. Obesity. 2011;19(1):13–16. doi: 10.1038/oby.2010.105. - DOI - PubMed