

Expression Changes in Epigenetic Gene Pathways Associated With One-Carbon Nutritional Metabolites in Maternal Blood From Pregnancies Resulting in Autism and Non-Typical Neurodevelopment
- PMID: 33159718
- PMCID: PMC7894157
- DOI: 10.1002/aur.2428
Expression Changes in Epigenetic Gene Pathways Associated With One-Carbon Nutritional Metabolites in Maternal Blood From Pregnancies Resulting in Autism and Non-Typical Neurodevelopment
Abstract
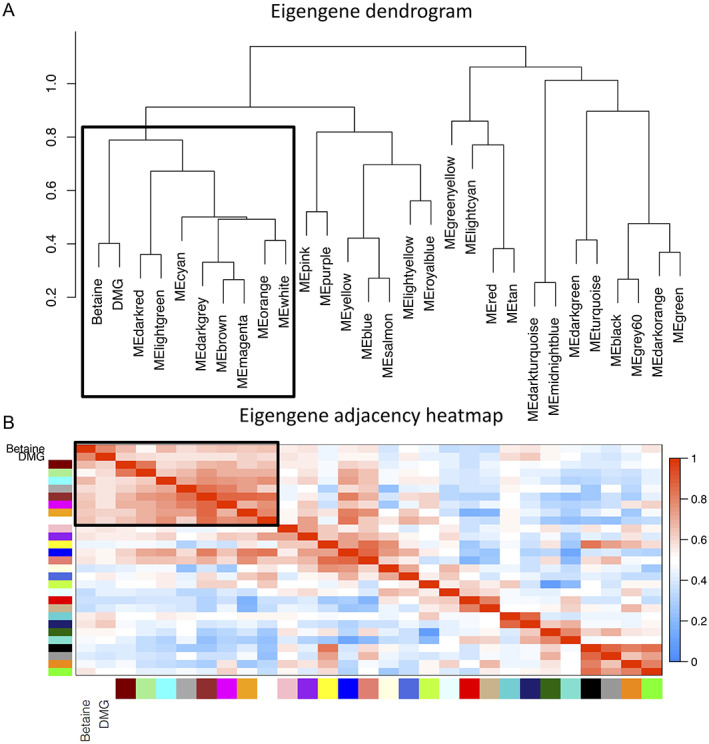
The prenatal period is a critical window for the development of autism spectrum disorder (ASD). The relationship between prenatal nutrients and gestational gene expression in mothers of children later diagnosed with ASD or non-typical development (Non-TD) is poorly understood. Maternal blood collected prospectively during pregnancy provides insights into the effects of nutrition, particularly one-carbon metabolites, on gene pathways and neurodevelopment. Genome-wide transcriptomes were measured with microarrays in 300 maternal blood samples in Markers of Autism Risk in Babies-Learning Early Signs. Sixteen different one-carbon metabolites, including folic acid, betaine, 5'-methyltretrahydrofolate (5-MeTHF), and dimethylglycine (DMG) were measured. Differential expression analysis and weighted gene correlation network analysis (WGCNA) were used to compare gene expression between children later diagnosed as typical development (TD), Non-TD and ASD, and to one-carbon metabolites. Using differential gene expression analysis, six transcripts (TGR-AS1, SQSTM1, HLA-C, and RFESD) were associated with child outcomes (ASD, Non-TD, and TD) with genome-wide significance. Genes nominally differentially expressed between ASD and TD significantly overlapped with seven high confidence ASD genes. WGCNA identified co-expressed gene modules significantly correlated with 5-MeTHF, folic acid, DMG, and betaine. A module enriched in DNA methylation functions showed a suggestive protective association with folic acid/5-MeTHF concentrations and ASD risk. Maternal plasma betaine and DMG concentrations were associated with a block of co-expressed genes enriched for adaptive immune, histone modification, and RNA processing functions. These results suggest that the prenatal maternal blood transcriptome is a sensitive indicator of gestational one-carbon metabolite status and changes relevant to children's later neurodevelopmental outcomes. LAY SUMMARY: Pregnancy is a time when maternal nutrition could interact with genetic risk for autism spectrum disorder. Blood samples collected during pregnancy from mothers who had a prior child with autism were examined for gene expression and nutrient metabolites, then compared to the diagnosis of the child at age three. Expression differences in gene pathways related to the immune system and gene regulation were observed for pregnancies of children with autism and non-typical neurodevelopment and were associated with maternal nutrients.
Keywords: autism spectrum disorder; maternal blood; neurodevelopment; nutrition; one-carbon metabolites; prenatal; transcriptome.
© 2020 The Authors. Autism Research published by International Society for Autism Research and Wiley Periodicals LLC.
Conflict of interest statement
The authors declare that there is no conflict of interest.
Figures


Similar articles
-
A meta-analysis of two high-risk prospective cohort studies reveals autism-specific transcriptional changes to chromatin, autoimmune, and environmental response genes in umbilical cord blood.Mol Autism. 2019 Oct 24;10:36. doi: 10.1186/s13229-019-0287-z. eCollection 2019. Mol Autism. 2019. PMID: 31673306 Free PMC article.
-
Association of Maternal Prenatal Vitamin Use With Risk for Autism Spectrum Disorder Recurrence in Young Siblings.JAMA Psychiatry. 2019 Apr 1;76(4):391-398. doi: 10.1001/jamapsychiatry.2018.3901. JAMA Psychiatry. 2019. PMID: 30810722 Free PMC article.
-
Prenatal exposure to phthalates and autism spectrum disorder in the MARBLES study.Environ Health. 2018 Dec 5;17(1):85. doi: 10.1186/s12940-018-0428-4. Environ Health. 2018. PMID: 30518373 Free PMC article.
-
Maternal Dietary Factors and the Risk of Autism Spectrum Disorders: A Systematic Review of Existing Evidence.Autism Res. 2020 Oct;13(10):1634-1658. doi: 10.1002/aur.2402. Epub 2020 Oct 5. Autism Res. 2020. PMID: 33015977 Free PMC article.
-
Epigenomic signatures reveal mechanistic clues and predictive markers for autism spectrum disorder.Mol Psychiatry. 2023 May;28(5):1890-1901. doi: 10.1038/s41380-022-01917-9. Epub 2023 Jan 17. Mol Psychiatry. 2023. PMID: 36650278 Free PMC article. Review.
Cited by
-
Early Life Nutrition and Mental Health: The Role of DNA Methylation.Nutrients. 2021 Sep 4;13(9):3111. doi: 10.3390/nu13093111. Nutrients. 2021. PMID: 34578987 Free PMC article. Review.
-
Lowering the risk of autism spectrum disorder with folic acid: can there be too much of a good thing?Am J Clin Nutr. 2022 May 1;115(5):1268-1269. doi: 10.1093/ajcn/nqac048. Am J Clin Nutr. 2022. PMID: 35348591 Free PMC article. No abstract available.
-
Biological implications of genetic variations in autism spectrum disorders from genomics studies.Biosci Rep. 2021 Jul 30;41(7):BSR20210593. doi: 10.1042/BSR20210593. Biosci Rep. 2021. PMID: 34240107 Free PMC article. Review.
-
From Womb to Mind: Prenatal Epigenetic Influences on Mental Health Disorders.Int J Mol Sci. 2025 Jun 25;26(13):6096. doi: 10.3390/ijms26136096. Int J Mol Sci. 2025. PMID: 40649875 Free PMC article. Review.
-
Exploring HLA-C methylation patterns and nutritional status in Kichwa mothers and infants from Tena, Ecuador.Front Med (Lausanne). 2024 Aug 27;11:1356646. doi: 10.3389/fmed.2024.1356646. eCollection 2024. Front Med (Lausanne). 2024. PMID: 39257885 Free PMC article.
References
Publication types
MeSH terms
Substances
Grants and funding
LinkOut - more resources
Full Text Sources
Medical
Molecular Biology Databases
Research Materials
