. 2021 Feb 24;72(4):1282-1294.
doi: 10.1093/jxb/eraa520.

Variation between rice accessions in photosynthetic induction in flag leaves and underlying mechanisms

Affiliations

Variation between rice accessions in photosynthetic induction in flag leaves and underlying mechanisms

Liana G Acevedo-Siaca et al. J Exp Bot. .

Abstract

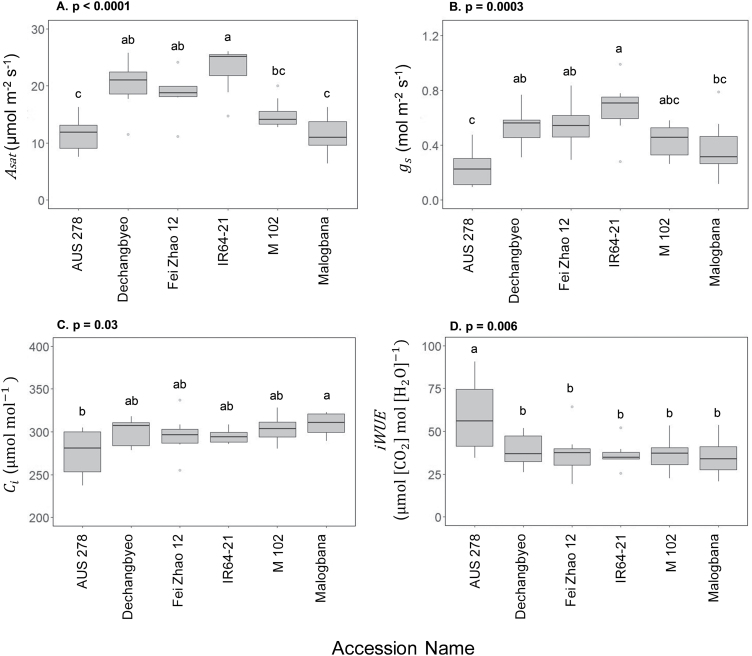
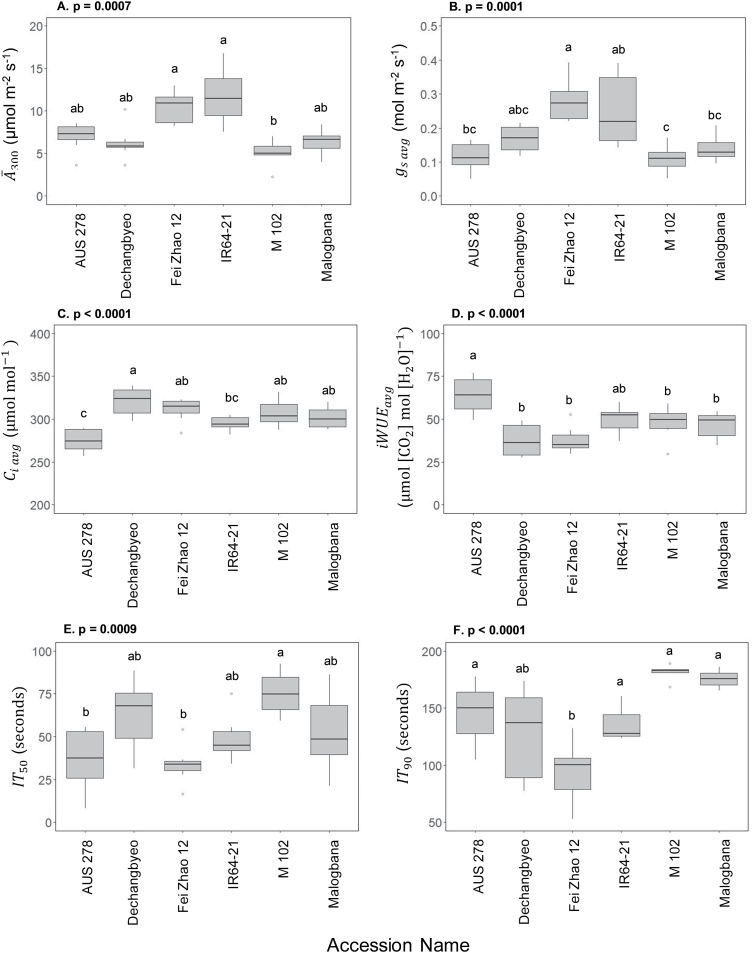
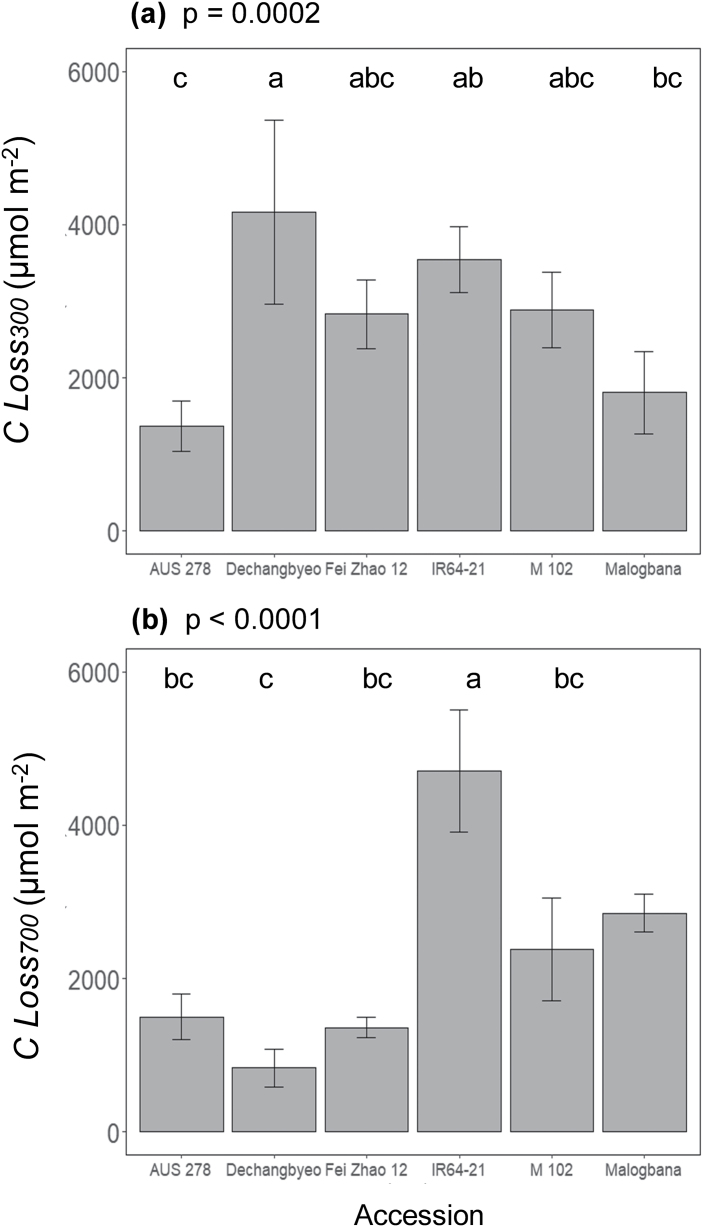
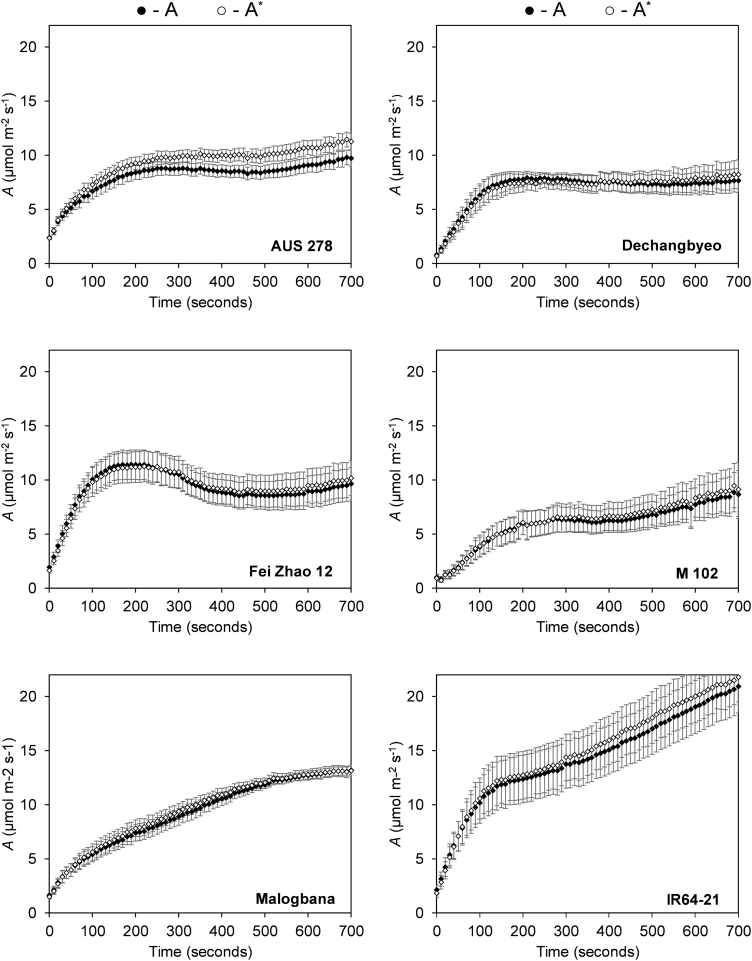
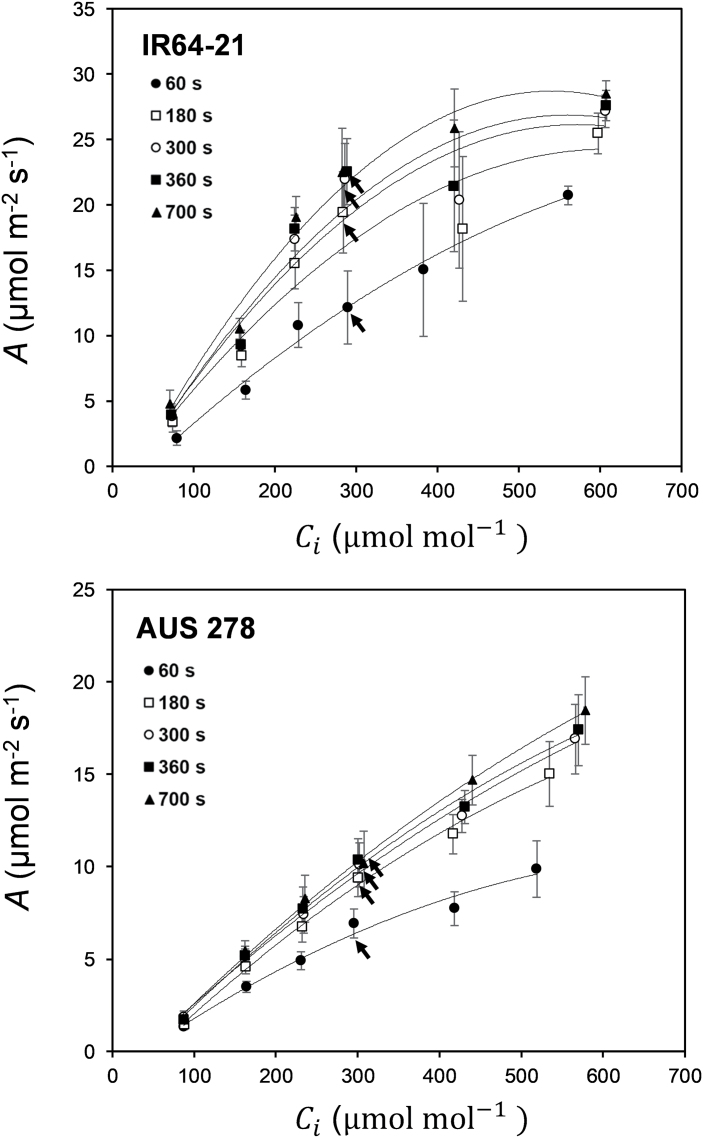
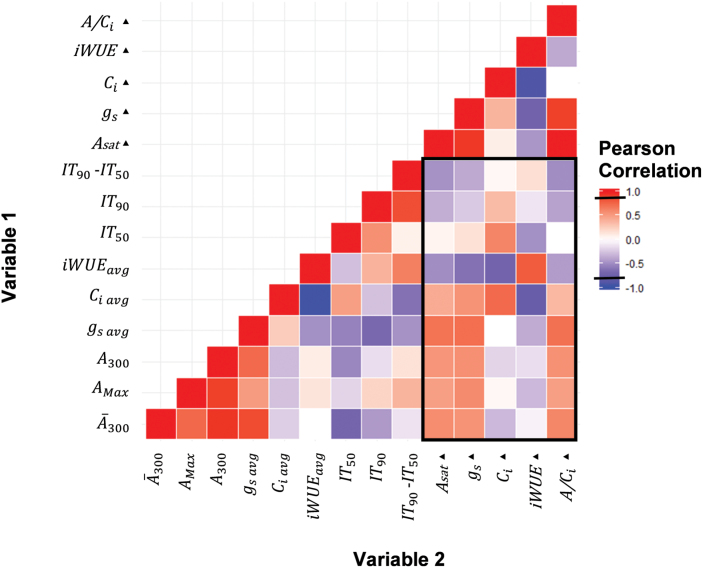
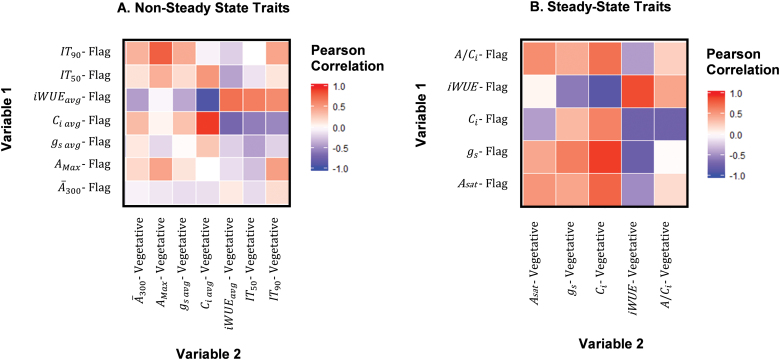
Several breeding initiatives have sought to improve flag leaf performance as its health and physiology are closely correlated to rice yield. Previous studies have described natural variation of photosynthesis for flag leaves; however, none has examined their performance under the non-steady-state conditions that prevail in crop fields. Photosynthetic induction is the transient response of photosynthesis to a change from low to high light. Rice flag leaf photosynthesis was measured in both steady- and non-steady-state conditions to characterize natural variation. Between the lowest and highest performing accession, there was a 152% difference for average CO2 assimilation during induction (Ā300), a 77% difference for average intrinsic water use efficiency during induction (iWUEavg), and a 185% difference for the speed of induction (IT50), indicating plentiful variation. No significant correlation was found between steady- and non-steady-state photosynthetic traits. Additionally, measures of neither steady-state nor non-steady-state photosynthesis of flag leaves correlated with the same measures of leaves in the vegetative growth stage, with the exception of iWUEavg. Photosynthetic induction was measured at six [CO2], to determine biochemical and diffusive limitations to photosynthesis in vivo. Photosynthetic induction in rice flag leaves was limited primarily by biochemistry.

Keywords: Atmospheric change; Rubisco activation; crop improvement; flag leaves; food security; natural variation; photosynthetic induction; rice; rice breeding; water use efficiency.


Figures

Fig. 1.
Fig. 1.
The response of flag leaves from six rice accessions during photosynthetic induction. (A) Net leaf CO2 assimilation (A), (B) stomatal conductance (gs), (C) intercellular CO2 concentration (Ci), and (D) intrinsic water use efficiency (iWUE=A/gs) with time (t) of induction upon change at 0 s from low light to high light (50 µmol m–2 s–1 to 1700 µmol m–2 s–1). The measurement was taken at an ambient [CO2] of 400 µmol mol–1. Two accessions, AUS 278 (red) and IR64-21 (black), were selected for further study at varied [CO2]. The other four accessions are Dechangbyeo, Fei Zhao 12, M 102, and Malogbana. Each point is the mean ±SE) of eight plants (n=8).
Fig. 2.
Fig. 2.
Mean and variation for flag leaf steady-state photosynthetic performance in six rice accessions. (A) Leaf CO2 assimilation (A), (B) stomatal conductance (gs), (C) intrinsic water use efficiency (iWUE=A/gs), and (D) intercellular CO2 concentration (Ci). Accessions are ordered by median performance. Letters are indicative of a significant difference between accessions.
Fig. 3.
Fig. 3.
Mean and variation for flag leaf non-steady-state photosynthetic performance in six rice accessions. (A) CO2 assimilation during the first 300 s of induction (Ā300), (B) average stomatal conductance during the first 300 s of induction (gs avg), (C) average intrinsic water use efficiency (iWUEavg=Ā300/gs avg), (D) average intercellular CO2 concentration (Ci avg), (E and F) time at which A reached 50% and 90% of A300 (IT50 and IT90, respectively). Accessions are ordered by median performance. Letters are indicative of a significant difference between accessions.
Fig. 4.
Fig. 4.
The integra1 of CO2 uptake forgone due to the lower than steady-state rates through the first (A) 300 s and (B) 700 s of induction compared with steady state (C Loss300 and C Loss700, respectively).
Fig. 5.
Fig. 5.
The response of uncorrected leaf CO2 assimilation (A; filled circles) and the response of leaf CO2 assimilation corrected for stomatal limitation (A*; open circles) over time in flag leaves of six rice accessions. The first line at 100 s indicates the mean time for the activation of Rubisco (τ) per accession. Each point represents the mean of at least six plants ±SE (n=6–8).
Fig. 6.
Fig. 6.
The responses of leaf CO2 assimilation (A) to intercellular [CO2] (Ci) at different points in time after the beginning of photosynthetic induction for IR64-21 and AUS 278. Times after induction were: 60 s (filled circles), 180 s (open squares), 300 s (open circles), 360 s (filled squares), and 700 s (filled triangles) from the start of induction. The operating point of each curve at 400 µmol mol–1 atmospheric [CO2] (Ca) is indicated with a black arrow. Each point is the mean (±SE) of four plants of each rice accession.
Fig. 7.
Fig. 7.
Pearson correlation (R) of all measured dynamic and steady-state (filled tiangles) photosynthetic traits measured in rice flag leaves. Negative correlations are in blue, positive correlations are in red. Traits at steady-state are: intrinsic water-use efficiency (iWUE=A/gs), transpiration (E), intercellular CO2 concentration (Ci), stomatal conductance (gs), and net CO2 assimilation in saturating light (Asat). Traits at non-steady state over the first 300 s of induction are: the time at which A reached 50% and 90% of A300 (IT50 and IT90, respectively), average Ci during first 300 s of induction (Ci avg), average intrinsic water use efficiency (iWUEavg=Ā300/gs avg), average gs, the maximum A during induction (AMax), A at the end of this period (A300), and the average A (Ā300). A significant R value is marked by a black line on the scale (0.8).
Fig. 8.
Fig. 8.
Pearson correlation analysis between photosynthetic traits measured in flag leaves for the six cultivars measured here with the values obtained on leaves in the vegetative growth stage for the same cultivars in a previous study (Acevedo-Siaca et al. 2020). (A) Non-steady state; (B) steady state. Traits are as defined in Fig. 3.

References

    1. Abou-Khalifa ABA, Misra N, El-Azeem A, Salem KM. 2008. Effect of leaf cutting on physiological traits and yield of two rice cultivars. African Journal of Plant Science 2, 147–150.
    1. Acevedo-Siaca LG, Coe R, Wang Y, Kromdijk J, Quick WP, Long SP. 2020. Variation in photosynthetic induction between rice accessions and its potential for improving productivity. New Phytologist 227, 1097–1108. - PMC - PubMed
    1. Adachi S, Yoshikawa K, Yamanouchi U, Tanabata T, Sun J, Ookawa T, Yamamoto T, Sage RF, Hirasawa T, Yonemaru J. 2017. Fine mapping of Carbon Assimilation Rate 8, a quantitative trait locus for flag leaf nitrogen content, stomatal conductance and photosynthesis in rice. Frontiers in Plant Science 8, 60. - PMC - PubMed
    1. Ainsworth EA, Long SP. 2020. 30 years of free-air carbon dioxide enrichment (FACE): What have we learned about future crop productivity and its potential for adaptation? Global Change Biology doi: 10.1111/gcb.15375. - DOI - PubMed
    1. Bansal KC, Uprety DC, Abrol YP. 1993. Genetic variation in photosynthetic characteristics in wheat: causes and consequences. In: Abrol YP, Mohanty P, Govindjee, eds. Photosynthesis: photoreactions to plant productivity. Dordrecht: Springer Science + Business Media, 527–547.

Publication types