. 2020 Nov 25;183(5):1383-1401.e19.
doi: 10.1016/j.cell.2020.10.002. Epub 2020 Nov 6.

Single-Cell Profiling of Ebola Virus Disease In Vivo Reveals Viral and Host Dynamics

Affiliations

Single-Cell Profiling of Ebola Virus Disease In Vivo Reveals Viral and Host Dynamics

Dylan Kotliar et al. Cell. .

Abstract

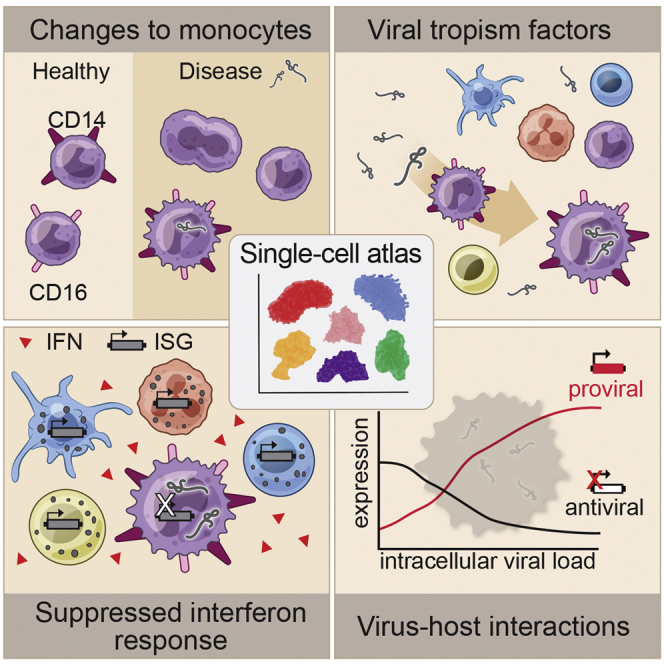
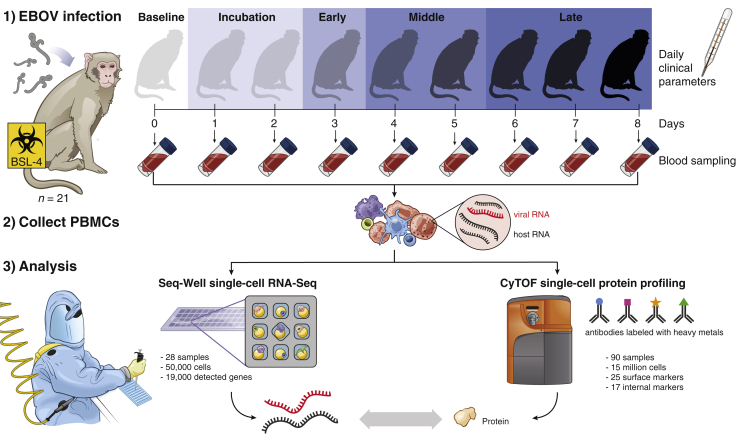
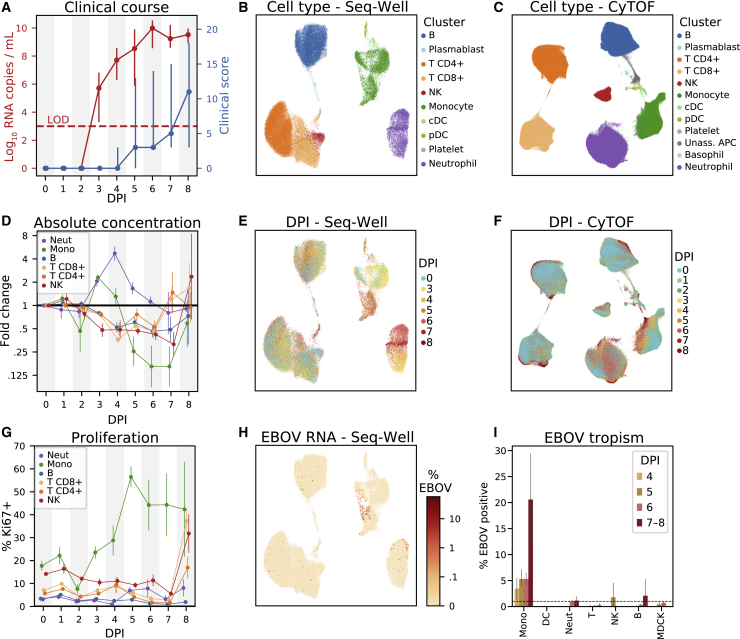
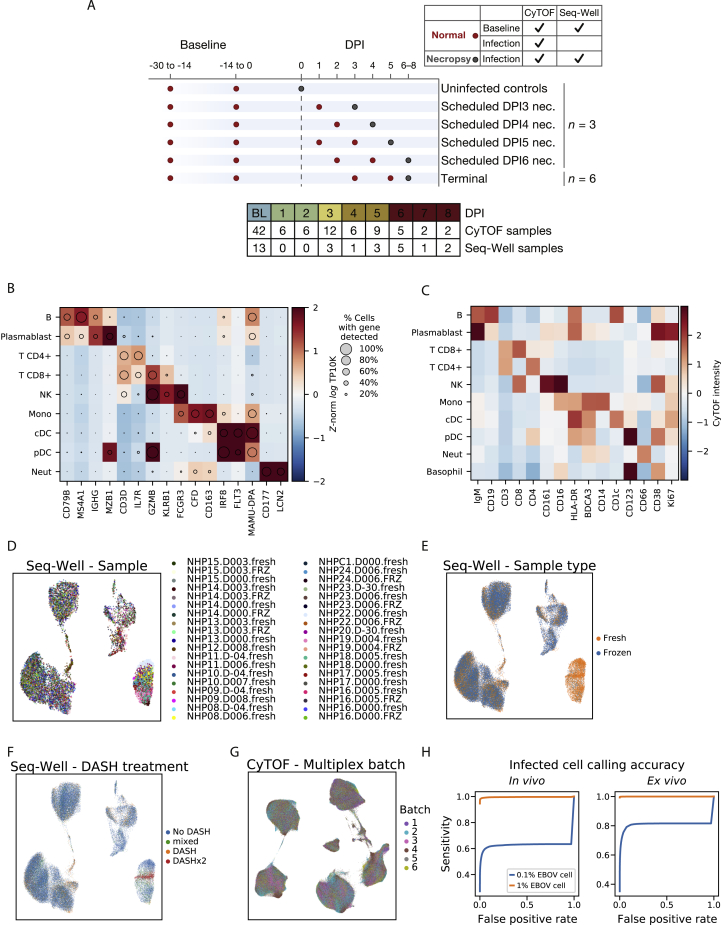
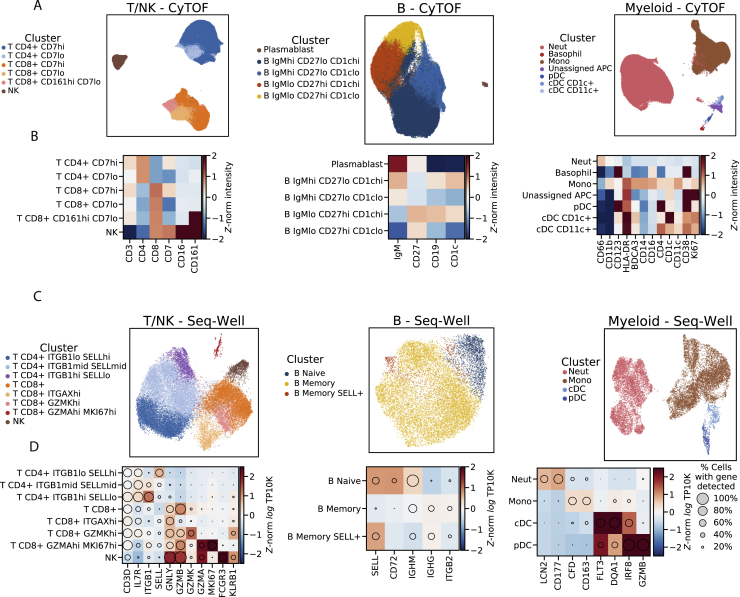
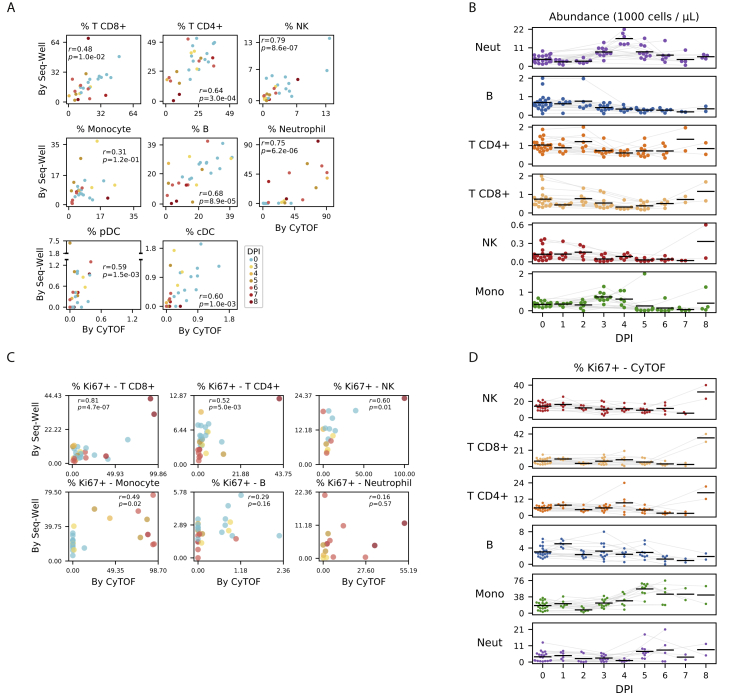
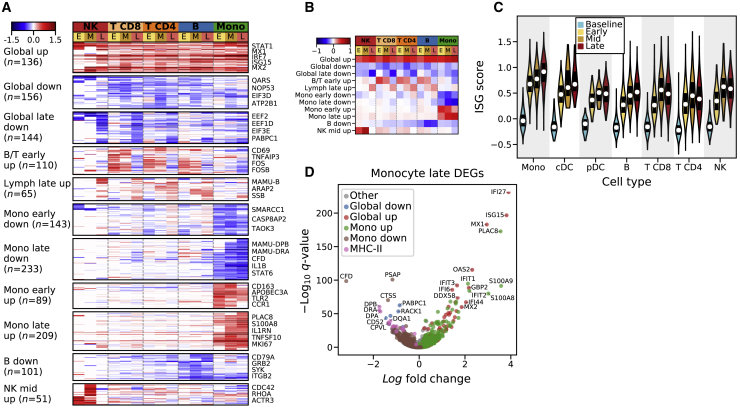
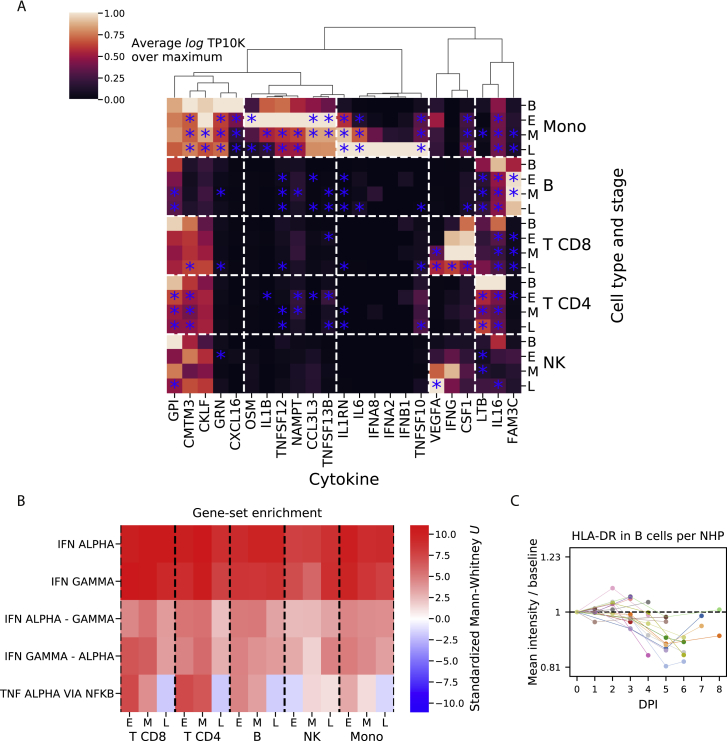
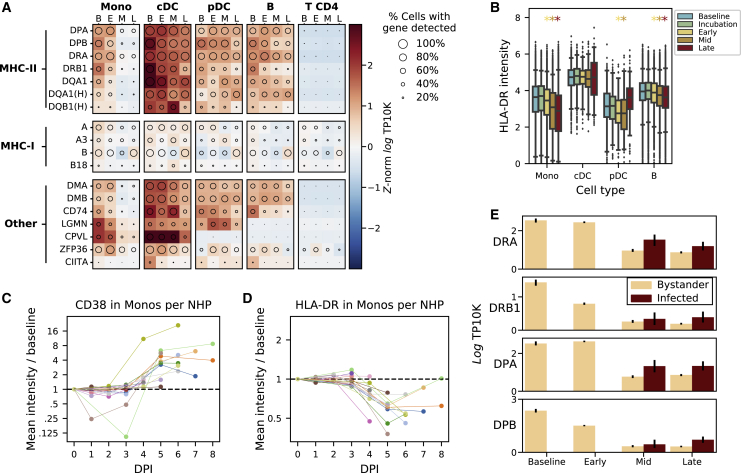
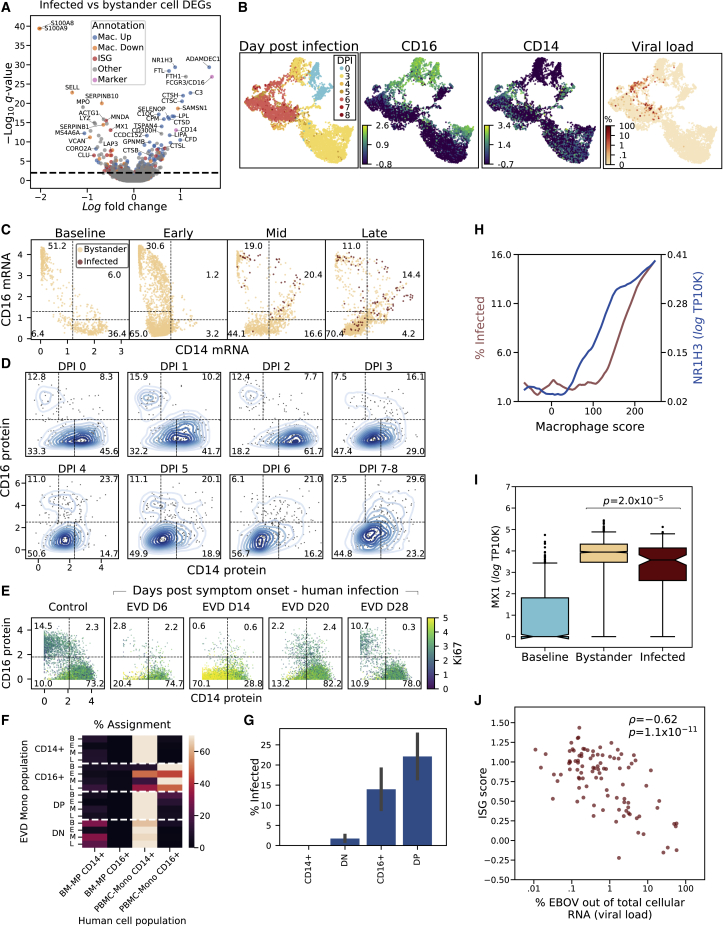
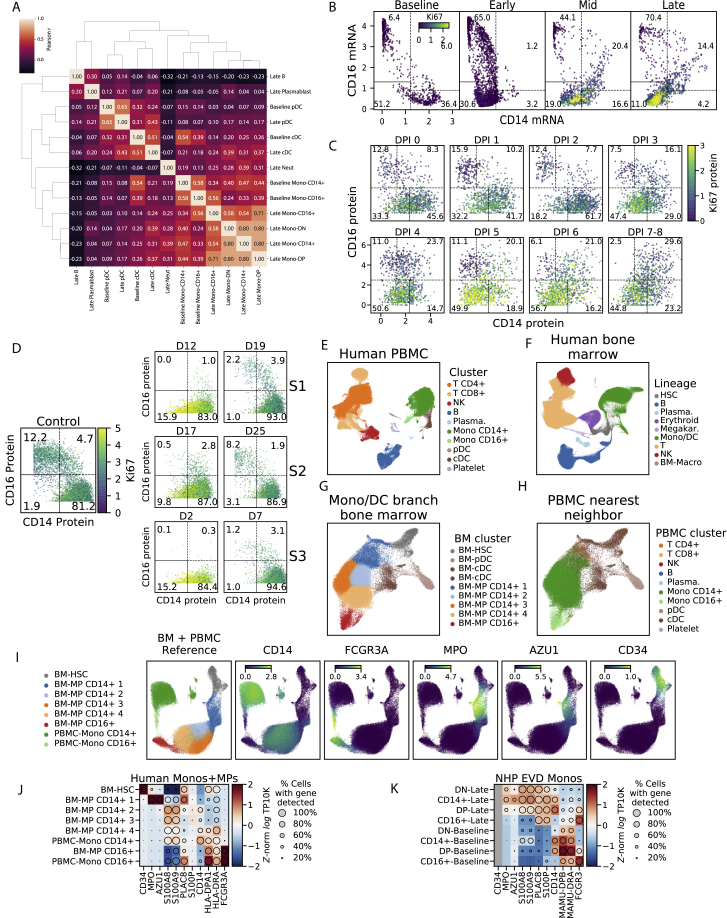
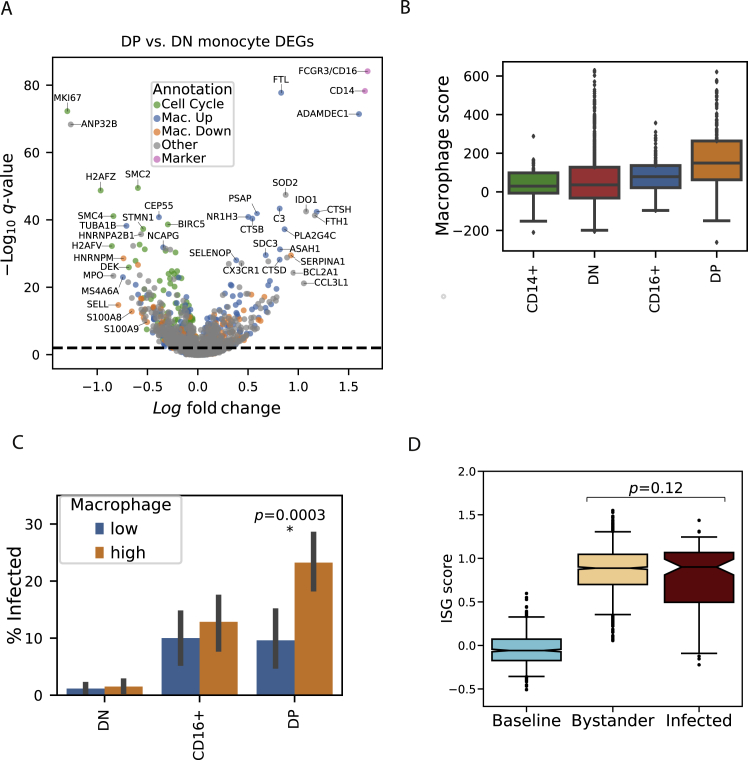
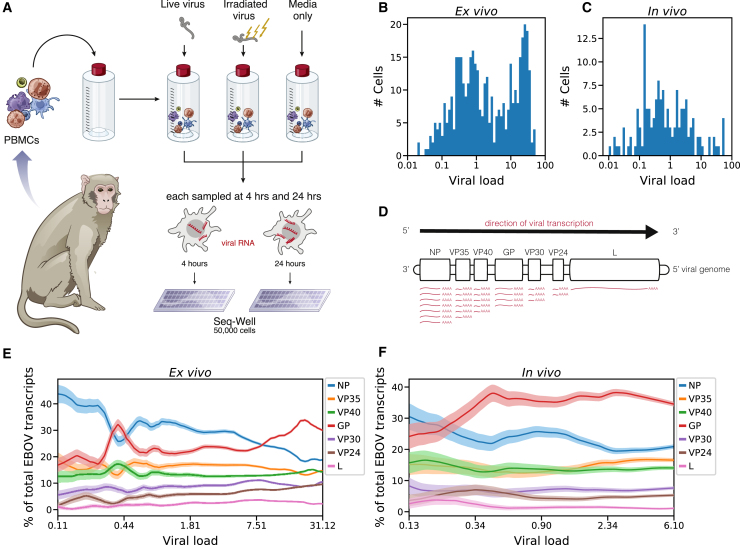
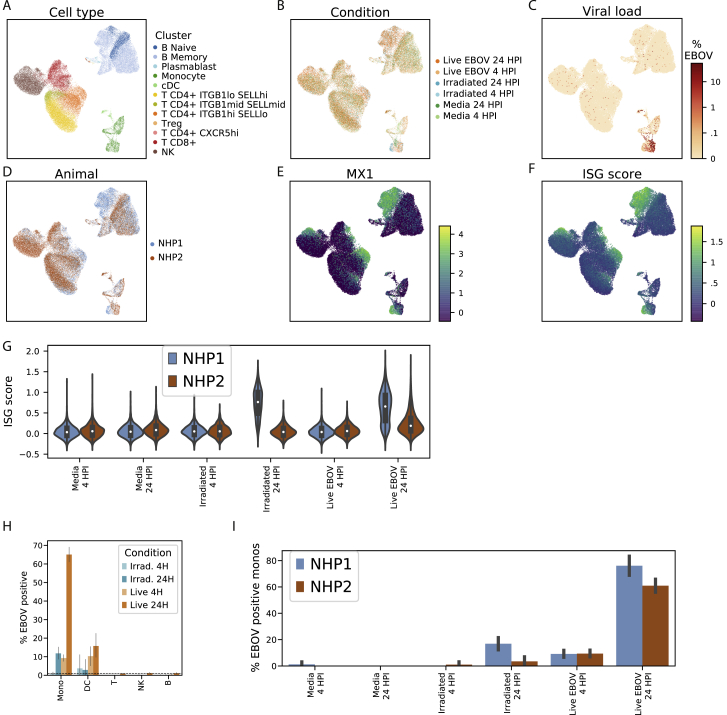
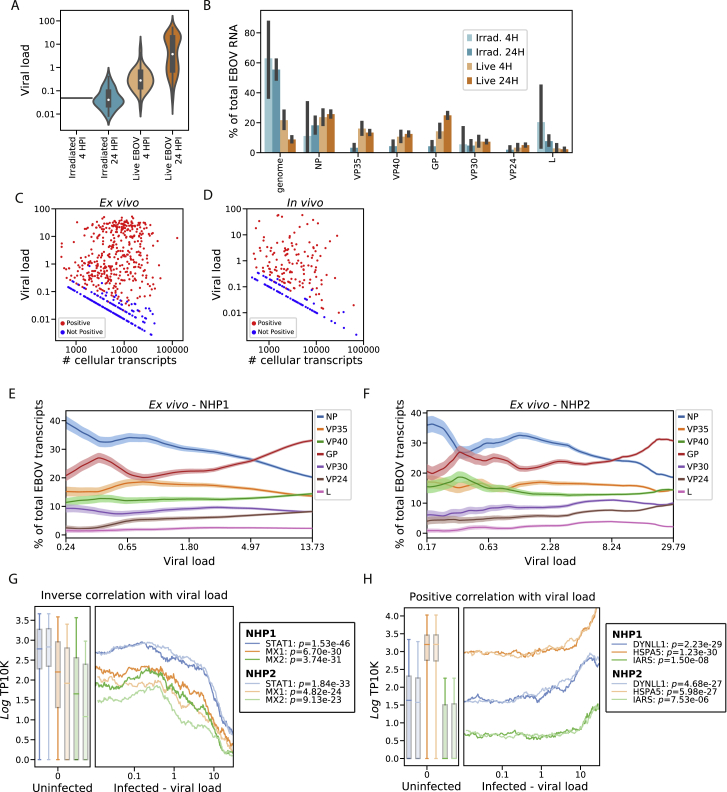
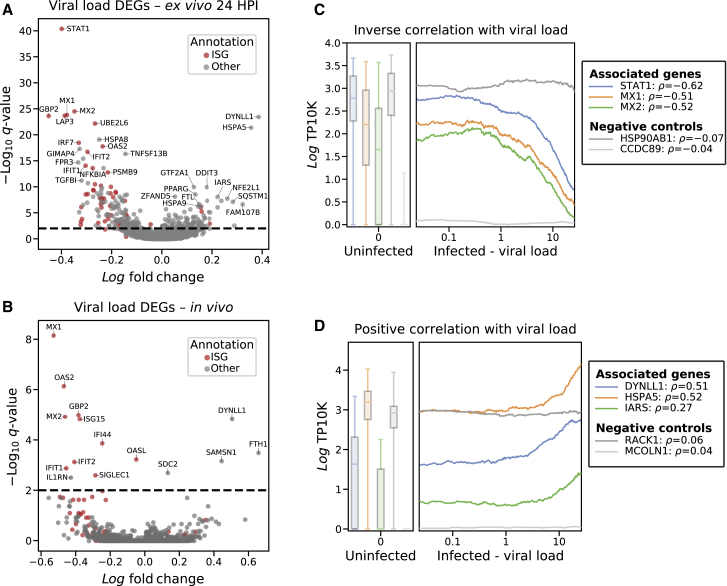
Ebola virus (EBOV) causes epidemics with high mortality yet remains understudied due to the challenge of experimentation in high-containment and outbreak settings. Here, we used single-cell transcriptomics and CyTOF-based single-cell protein quantification to characterize peripheral immune cells during EBOV infection in rhesus monkeys. We obtained 100,000 transcriptomes and 15,000,000 protein profiles, finding that immature, proliferative monocyte-lineage cells with reduced antigen-presentation capacity replace conventional monocyte subsets, while lymphocytes upregulate apoptosis genes and decline in abundance. By quantifying intracellular viral RNA, we identify molecular determinants of tropism among circulating immune cells and examine temporal dynamics in viral and host gene expression. Within infected cells, EBOV downregulates STAT1 mRNA and interferon signaling, and it upregulates putative pro-viral genes (e.g., DYNLL1 and HSPA5), nominating pathways the virus manipulates for its replication. This study sheds light on EBOV tropism, replication dynamics, and elicited immune response and provides a framework for characterizing host-virus interactions under maximum containment.

Keywords: CyTOF; Ebola virus; Seq-Well; bystander cells; host-virus interactions; interferon; monocytes; scRNA-Seq; single-cell; viral tropism.


Conflict of interest statement

Declaration of Interests A.K.S. has received compensation for consulting and SAB membership from Honeycomb Biotechnologies, Cellarity, Ochre Bio, Repertoire, and Dahlia Biosciences.

Figures

None
Graphical abstract
Figure 1
Figure 1
Study Design Under BSL-4 containment, we collected blood samples from a total of 21 rhesus monkeys at multiple days post-EBOV inoculation, extracted peripheral blood mononuclear cells (PBMCs), and profiled single-cell transcriptomes and 42 protein markers using Seq-Well and CyTOF. Seq-Well quantifies both host (black) and viral (red) RNA expression, allowing comparisons between infected and bystander cells. Daily clinical parameters (body temperature, clinical signs, and body weight) were also collected for each animal, and complete blood counts were obtained for each blood draw. See also Figure S1A and Table S1.
Figure 2
Figure 2
Changing Cell-Type Abundance, Proliferation Rate, and Infection Status during EVD (A) Time course of viral load (red, left y axis, log10 scale) and clinical score (blue, right y axis). Markers: mean; error bars: minimum and maximum; LOD, limit of detection by reverse transciption quantitative PCR. (B and C) Uniform Manifold Approximation and Projection (UMAP) embedding of Seq-Well (B) and CyTOF (C) data, colored by annotated cluster assignment. See also Figures S1 and S2, and Data S1. (D) Fold change (log2 scale) in the absolute abundance (cells/μL of whole blood) of each cell type relative to baseline based on CyTOF clusters. Error bars: mean ± 1 SE. See also Figures S3A and S3B. (E and F) UMAP embedding of Seq-Well (E) and CyTOF (F) data, colored by the day post-infection (DPI) on which each cell was sampled. (G) Percentage of Ki67-positive cells (CyTOF intensity >1.8) of each cell type. Error bars: mean ± 1 SE. See also Figures S3C and S3D. (H) UMAP embedding of Seq-Well data, colored by the percentage of cellular transcripts mapping to EBOV. (I) Percentage of infected cells by cell type based on Seq-Well. Dashed line: 1% false positive rate threshold for calling infected cells. Error bars: 95% CI on the mean based on 1,000 bootstraps. See also Figures S1H.
Figure S1
Figure S1
Cell-Type Markers for Seq-Well and CyTOF Clusters, Related to Figure 2 (A) Overview of study cohorts and blood draw timelines. Animals were grouped into cohorts with pre-scheduled necropsy times (at baseline, or day post infection [DPI] 3, 4, 5, 6 - n = 3 each), or allowed to progress until clinical score exceeded 10 (terminal), predetermined euthanasia criteria. Dots: scheduled blood draws for each cohort; red: intermediate (non-necropsy) draw; gray: draw that coincided with euthanasia and necropsy. Necropsy and baseline normal draws were used for Seq-Well and CyTOF, while intermediate post-infection draws were available only for CyTOF. (B) Expression profiles of cell-type marker genes (columns) for cell-type clusters (rows) based on the in vivo Seq-Well data. Circle area represents the percentage of cells in each group in which the gene was detected, and color denotes the average expression level (loge TP10K). (C) Average expression (Z-normalized CyTOF intensity) profiles of cell-type marker genes (columns), for cell-type clusters (rows), based on the CyTOF data. (D) Uniform Manifold Approximation and Projection (UMAP) embedding of post-integration Seq-Well data, colored by the sample source (NHP, DPI, and whether the sample was loaded for Seq-Well without any freezing [.fresh] or was frozen with cryoprotectant and thawed prior to Seq-Well [.FRZ]). A maximum of 500 cells per sample is plotted to increase representation across samples. (E) UMAP embedding of Seq-Well data, colored by whether cells were processed fresh (orange) or after freeze/thaw (blue) prior to Seq-Well. (F) UMAP embedding of Seq-Well data, colored by depletion of abundant sequences by hybridization (DASH) treatment. We developed a DASH-based method to remove a PCR adaptor artifact from some Seq-Well sequencing libraries (STAR Methods), and performed this 0 times (No DASH, blue), 1 time (DASH, orange), or 2 times sequentially (DASHx2, red). For a few samples, we sequenced ‘No DASH’ and ‘DASH’ libraries and merged the reads (mixed, green). (G) UMAP embedding of batch-corrected CyTOF data, colored by the multiplex batch in which it was pooled and analyzed by CyTOF. (H) Receiver operating characteristic curves for identifying EBOV-infected cells. Estimates of sensitivity to detect an infected cell at various false positive rate thresholds in vivo (left) and ex vivo (right). Curves are estimated separately for a hypothetical viral load of 0.1% (blue line) and 1% (orange line).
Figure S2
Figure S2
Identifying Cell Subtypes by Subclustering, Related to Figure 2 (A) UMAP embedding of broad cell-type clusters in the CyTOF data, colored by sub-cluster assignment (Neut: neutrophil, Mono: monocyte). (B) Average expression (Z-normalized CyTOF intensity) profiles of sub-clusters for marker genes based on CyTOF data. (C) UMAP embedding of broad cell-type clusters in the Seq-Well data, colored by sub-cluster assignment. (D) Expression profiles of sub-clusters for marker genes based on Seq-Well data. Circle area: percentage of cells in which the gene was detected; color: average expression level (Z-normalized loge TP10K).
Figure S3
Figure S3
Estimates of Cell-Type Abundance and Proliferation over the Time Course, Related to Figure 2 (A) Scatterplot of the percentage of cells of each cell type in a sample, inferred from CyTOF (x axis) or Seq-Well (y axis), for several cell types (panels). Each dot represents a sample colored by DPI. Pearson correlation coefficients (r) and p-value are provided. (B) Estimates of the abundance of each cell type (rows) for each NHP (individual markers) in units of 1000 cells per μL of whole blood, based on integration of CyTOF and complete blood count (CBC) information. Black line: mean value of each DPI; gray lines: serial samples from the same NHP. (C) Scatterplots of the percentage of Ki67-positive cells in a sample inferred from CyTOF (x axis) or Seq-Well (y axis) for several cell types (panels). Each dot represents a sample colored by DPI. Cells with smoothed expression of MKI67 (the gene coding for Ki67) > 0.1 are called Ki67-positive by Seq-Well. Cells with CyTOF intensity > 1.8 are called Ki67-positive by CyTOF. (D) Estimates of the percentage of Ki67-positive cells (CyTOF intensity > 1.8) of each cell type (rows) for each animal replicate (markers). Black line: mean value of each DPI; gray lines: serial samples from the same NHP.
Figure 3
Figure 3
Patterns of Differential Expression across EVD Stages and Cell Types (A) Fold changes (loge scale) of 1,430 differentially expressed genes (rows) in each cell type at early (E), middle (M), and late (L) EVD (columns), relative to baseline, with insignificant values (p > 0.2) set to 0. Genes were grouped into modules through unsupervised k-means clustering. See also Tables S2 and S3. (B) Same as (A) but displaying the average loge fold change of each module. (C) Distribution of interferon-stimulated gene (ISG) scores for each cell type. White markers: median; bars: interquartile range. See also Figures S4A and S4B. (D) Differential expression of monocytes in late EVD compared to baseline.
Figure S4
Figure S4
Quantification of Cytokine Expression and Enrichment of Response Signatures, Related to Figures 3 and 4 (A) Average expression values (loge TP10K) of literature-annotated cytokines (columns) across cell types and stages of acute EVD (rows). Values are plotted as a ratio relative to the maximum across cell types and stages. Values that are statistically different from baseline (p < 0.05) are indicated with a blue star. (B) Heatmap of rank-sum test statistics for comparison of differential expression log fold-changes of genes in a gene set (rows) compared to genes not in the set. The log fold-changes were defined from differential expression profiles of each cell type at each EVD stage (columns) relative to baseline. Five gene sets were tested — three from the Hallmark database (IFN ALPHA, IFN GAMMA, and TNF ALPHA VIA NFKB) (Liberzon et al., 2015) and 2 constructed from the hallmark sets, as uniquely IFNα-regulated genes in “IFN ALPHA” but not “IFN GAMMA” (“IFN ALPHA - GAMMA”), and vice versa for uniquely IFNγ-regulated (“IFN GAMMA - ALPHA”). See also Table S3. (C) Fold change (log2 scale) in average HLA-DR CyTOF intensity on B cells at each DPI relative to baseline for each PBMC sample. Colored lines connect serial samples from the same NHP.
Figure 4
Figure 4
Monocytes Dramatically Reduce Expression of MHC Class II Proteins Independent of Infection Status (A) Expression of major histocompatibility (MHC) or MHC-associated genes (rows) in key cell types at baseline (B), early (E), middle (M), or late (L) EVD (columns). Circle size: percentage of cells in that group in which the gene was detected; color: mean expression in Z score normalized, loge transcripts per 10,000 (TP10K). The “MAMU-” prefix, which designates MHC genes in rhesus monkeys, was removed; the “HLA-” prefix is indicated by “(H).” (B) CyTOF intensity of HLA-DR protein in antigen-presenting cells. Boxes: median and interquartile range; whiskers: 2.5th and 97.5th percentiles. Colored stars indicate significant decreases from baseline (rank-sum test p < 0.05) with color corresponding to stage. (C and D) Fold change (log2 scale) in average CD38 (C) and HLA-DR (D) CyTOF intensity on monocytes at each DPI relative to baseline, connected by colored lines for each NHP. See also Figure S4C and Data S1. (E) Average gene expression (loge TP10K) for four MHC class II genes in monocytes, stratified by cell-infection status. Error bars: 95% CI on the mean based on 200 bootstraps.
Figure 5
Figure 5
ISG Suppression, Co-expression of CD14 and CD16, and Expression of Macrophage Genes Are Associated with Monocyte Infectivity (A) Differential expression between infected and bystander monocytes from DPI 5–8. Genes are colored by membership in sets of genes (Mac. Up/Down = up- or downregulated during in vitro differentiation of monocytes into macrophages). See also Table S4. (B) UMAP embedding of monocyte gene expression data, colored by (left-to-right) DPI, CD16 expression (loge TP10K), CD14 expression (loge TP10K), and percentage of cellular transcripts mapping to EBOV. (C) Smoothed expression (loge TP10K) of CD14 and CD16 for monocytes during EVD. Boxes: CD14+, CD16+, DN, and DP subsets described in the text; numbers: percentage of cells in each subset at that EVD stage. See also Figures S5A and S5B. (D) CD14 and CD16 protein expression (CyTOF intensity) on monocytes at each DPI. Bivariate kernel density plot with 200 randomly sampled cells is overlaid as a scatterplot. See also Figure S5C. (E) CD14 and CD16 protein expression (CyTOF intensity) on monocytes in a case of human EVD, colored by Ki67 protein expression for multiple days after symptom onset. See also Figure S5D. (F) Percentage of assignment of NHP CD14/CD16 subsets at each EVD stage to human myeloid reference populations (BM-MP: bone marrow monocyte progenitors, PBMC-CD16+: circulating CD16+ monocytes, PBMC-CD14+: circulating CD14+ monocytes). See also Figures S5E–S5K. (G) Percentage of infected monocytes in each CD14/CD16 subset in late EVD. Error bars: 95% CI on the mean based on 1,000 bootstraps. (H) Association between macrophage score (x axis) and percentage of infected cells (left y axis, red) and expression of the differentiation marker NR1H3 (right y axis, blue, loge TP10K). We ordered monocytes from late EVD by macrophage score, and averaged percentage of infected cells and NR1H3 expression within 400-cell sliding windows. See also Figures S6A–S6C. (I) MX1 expression (loge TP10K) in monocytes at baseline, and uninfected bystanders or infected cells in late infection. Boxes: median and interquartile range; whiskers: 2.5th and 97.5th percentiles. Statistical significance was assessed by rank-sum test. See also Figure S6D. (J) Scatterplot of ISG score (y axis) versus percentage of cellular transcripts mapping to EBOV (x axis) for infected monocytes in late EVD (DPI 6–8). Statistical significance was assessed by Spearman ρ.
Figure S5
Figure S5
Extended Characterization of Interferon and Double-Negative CD14 CD16 Monocytes, Related to Figure 5 (A) Clustermap of pairwise Pearson correlations between cell type clusters at baseline and late EVD. Correlations are computed on average loge TP10K expression values of overdispersed genes. DN and DP monocytes at late EVD are more similar to monocytes (including baseline CD14+s) than other cell types. (B) Scatterplot of MAGIC-smoothed expression values (loge TP10K) of CD14 and CD16 for monocytes in baseline, early, mid, and late disease stages. Cells are colored by smoothed expression levels of MKI67 (the gene coding for Ki67 protein). Boxes: CD14+, CD16+, DN, and DP subsets described in the text; numbers: percentage of cells falling into each subset. (C) Scatterplot of protein expression (CyTOF intensity) of CD14 and CD16 for 1,000 randomly sampled monocytes at each DPI. Cells are colored by Ki67 expression. Boxes: CD14+, CD16+, DN, and DP subsets described in the text; numbers: percentage of cells falling into each subset. (D) Scatterplot of protein expression (CyTOF intensity) of CD14 and CD16 for monocytes during human EVD. Left: monocytes from healthy human controls. Right: monocytes from 3 EVD cases (S1, S2, and S3) at various days post symptom onset. Cells are colored by Ki67 marker intensity. Boxes: CD14+, CD16+, DN, and DP subsets described in the text; numbers: percentage of cells falling into each subset. (E) UMAP embedding of healthy human PBMCs dataset, colored by annotated cluster assignment, based on known marker genes. (Plasma.: Plasmablast). (F) UMAP embedding of healthy bone marrow cells, colored by cluster assignment, based on marker genes. (HSC: hematopoietic stem cell, Plasma.: Plasmablast, Megakar.: Megakaryocyte, Mono/DC: monocyte and dendritic cell, BM-Macro: bone marrow macrophage). (G) UMAP embedding of sub-clustered HSC and monocyte/dendritic lineage cells. (BM: bone marrow, MP: monocyte progenitor) (H) Same UMAP embedding as Figure S5G, but colored by the cluster identity of their nearest neighbor in the human PBMC dataset (Figure S5E). (I) UMAP embedding of the merged reference dataset of healthy bone marrow HSCs and monocyte lineage cells and PBMCs. Left sub-panel is colored by cluster assignment. Right sub-panels are colored by marker gene expression (loge TP10K). (J) Expression profiles of selected genes for human bone marrow monocyte progenitors (BM-MPs) and human circulating monocytes (PBMC-Monos). Circle area: percentage of cells in which the gene was detected; color: average expression (Z-normalized loge TP10K). (K) Expression profiles of selected genes for NHP monocyte subsets at baseline or late EVD for orthologs of the genes in (J). Circle area: percentage of cells in which the gene was detected; color: average expression level (Z-normalized loge TP10K). CD34 is grayed out because it is detected in <10 cells.
Figure S6
Figure S6
Extended Characterization of Gene-Expression Signals Associated with EBOV Infection Status in Monocytes, Related to Figure 5 (A) Volcano plot of differentially expressed genes between double positive and double negative monocyte subsets from DPI 5–8. Genes are colored by membership in cell cycle, macrophage upregulated (Mac. Up), macrophage downregulated (Mac. Down), or marker (CD14, CD16) gene sets. See also Table S5. (B) Macrophage scores for monocytes in late EVD for each subset. Boxes: median and interquartile range; whiskers: 2.5th and 97.5th percentiles. (C) Percentage of infected monocytes in each subset in late disease, stratified by low or high macrophage score (below or above the median of monocytes from all subsets). Error bars: 95% bootstrap CI on the mean. Statistical significance was assessed by Fisher's exact test. There are no infected monocytes in the CD14+ subset. (D) ISG scores of monocytes at baseline, and uninfected bystanders or infected cells in late stage EVD (DPI 6–8). Boxes: median and interquartile range; whiskers: 2.5th and 97.5th percentiles. Statistical significance was assessed by rank-sum test.
Figure 6
Figure 6
Viral Transcriptional Dynamics of Infected Monocytes In Vivo and Ex Vivo (A) Schematic of EBOV challenge of PBMCs ex vivo. See also Figure S7. (B and C) Percentage of cellular transcripts derived from EBOV (intracellular viral load) in monocytes from PBMCs inoculated with live virus ex vivo (B) or from PBMCs of NHPs infected in vivo (C). See also Figures S8A–S8D. (D) Schematic of EBOV transcription. The viral RNA-directed RNA-polymerase transcribes each gene sequentially but occasionally releases the genomic RNA template, ending transcription. As a result, transcription frequency decreases from NP to L. (E and F) Proportion of each EBOV gene versus viral load (log10 scale), ex vivo (E) or in vivo (F). We ordered infected monocytes by viral load and averaged the percentage of each viral gene over 50-cell sliding windows. Bands: mean ± 1 SD. See also Figures S8E and S8F.
Figure S7
Figure S7
Overview of the Ex Vivo EBOV Infection Dataset, Related to Figure 6 (A–F) UMAP embedding of Seq-Well data colored by annotated cluster assignment (A), treatment condition (B), viral load (C), NHP donor (D), MX1 gene expression (loge TP10K) (E), and interferon stimulated gene (ISG) score (F). (G) Distributions of ISG scores across monocytes from each treatment condition, stratified by NHP donor. Central white marker: median; black bar: interquartile range. (H) Estimated percentage of infected cells of each cell type in the ex vivo dataset. The dashed line denotes the 1% false positive rate threshold used for calling infected cells. Error bars: 95% bootstrap CI on the mean. (I) Percentage of EBOV-positive monocytes from each ex vivo treatment condition, stratified by NHP donor. Error bars: 95% bootstrap CI on the mean.
Figure S8
Figure S8
EBOV Infection Dynamics in the Ex Vivo Dataset, Related to Figures 6 and 7 (A) Distributions of viral loads across monocytes from different treatment conditions. Central white marker: median; black bar: interquartile range. (B) Estimated percentage of EBOV transcripts derived from the EBOV genome or each EBOV gene, out of total viral RNA, stratified by treatment conditions. Prior to averaging, the counts of EBOV genes for each cell was normalized to sum to one, so each cell contributes uniformly to the proportion, regardless of its total number of EBOV transcripts. Error bars: 95% bootstrap CI on the mean. (C and D) Scatterplot of total transcripts (unique molecular identifiers) detected in a cell (x axis, log10 scale) against viral load (y axis, log10 scale) for cells with one or more viral reads ex vivo (C) or in vivo (D). Cells called as infected are colored in red and otherwise colored in blue. (E and F) Relative proportion of each EBOV gene versus viral load (log10 scale) ex vivo for cells from donor NHP1 (E) or NHP2 (F). We ordered monocytes by viral load and averaged the percentage of each viral gene over 50-cell sliding windows. Color bands: mean ± 1 SD. (G and H) Association between gene expression and viral load for selected negatively (G) and positively (G) associated host genes in monocytes, 24 HPI after inoculation with live virus ex vivo. In the left sub-plots, distributions of gene expression in uninfected bystander cells are shown as a boxplot, boxes: interquartile range, whiskers: 2.5th and 97.5th percentiles. In the right sub-plots, we ordered infected cells by viral load (log10 scale) and averaged gene expression (loge TP10K) over 100-cell sliding windows. Curves and box-plots are shown separately for the 2 donor NHPs. p-values for the Spearman correlation between viral load and gene expression are listed for each NHP donor in the legend.
Figure 7
Figure 7
EBOV Infection Downregulates Host Antiviral Genes and Upregulates Putative Pro-viral Genes (A and B) Association between host gene expression and viral load within infected monocytes from PBMCs 24 HPI treated with live virus ex vivo (A) or from PBMCs of NHPs in vivo on DPI 5–8 (B). See also Table S6. (C and D) Select negatively (C) and positively (D) associated genes in monocytes from ex vivo infections. We ordered infected cells by viral load and averaged gene expression (loge TP10K) over 100-cell sliding windows; Spearman correlation (ρ) is given in the legend. Boxplots show gene expression in uninfected cells (boxes: median and interquartile range; whiskers: 2.5th and 97.5th percentiles). See also Figures S8G and S8H.

References

    1. Al Sayed M.F., Amrein M.A., Bührer E.D., Huguenin A.L., Radpour R., Riether C., Ochsenbein A.F. T-cell-Secreted TNFα Induces Emergency Myelopoiesis and Myeloid-Derived Suppressor Cell Differentiation in Cancer. Cancer Res. 2019;79:346–359. - PubMed
    1. Albariño C.G., Wiggleton Guerrero L., Chakrabarti A.K., Nichol S.T. Transcriptional analysis of viral mRNAs reveals common transcription patterns in cells infected by five different filoviruses. PLoS ONE. 2018;13:e0201827. - PMC - PubMed
    1. Albers S., Czech A. Exploiting tRNAs to Boost Virulence. Life (Basel) 2016;6:4. - PMC - PubMed
    1. Amici S.A., Young N.A., Narvaez-Miranda J., Jablonski K.A., Arcos J., Rosas L., Papenfuss T.L., Torrelles J.B., Jarjour W.N., Guerau-de-Arellano M. CD38 Is Robustly Induced in Human Macrophages and Monocytes in Inflammatory Conditions. Front. Immunol. 2018;9:1593. - PMC - PubMed
    1. Baize S., Leroy E.M., Georges-Courbot M.C., Capron M., Lansoud-Soukate J., Debré P., Fisher-Hoch S.P., McCormick J.B., Georges A.J. Defective humoral responses and extensive intravascular apoptosis are associated with fatal outcome in Ebola virus-infected patients. Nat. Med. 1999;5:423–426. - PubMed

Publication types

MeSH terms