. 2020 Dec 10;183(6):1586-1599.e10.
doi: 10.1016/j.cell.2020.09.061. Epub 2020 Nov 6.

Targeted Activation of Hippocampal Place Cells Drives Memory-Guided Spatial Behavior

Affiliations

Targeted Activation of Hippocampal Place Cells Drives Memory-Guided Spatial Behavior

Nick T M Robinson et al. Cell. .

Erratum in

Abstract

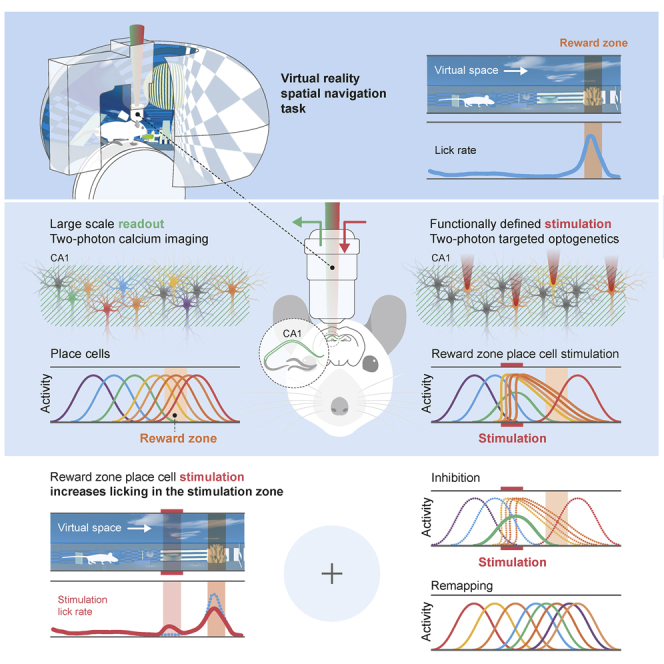
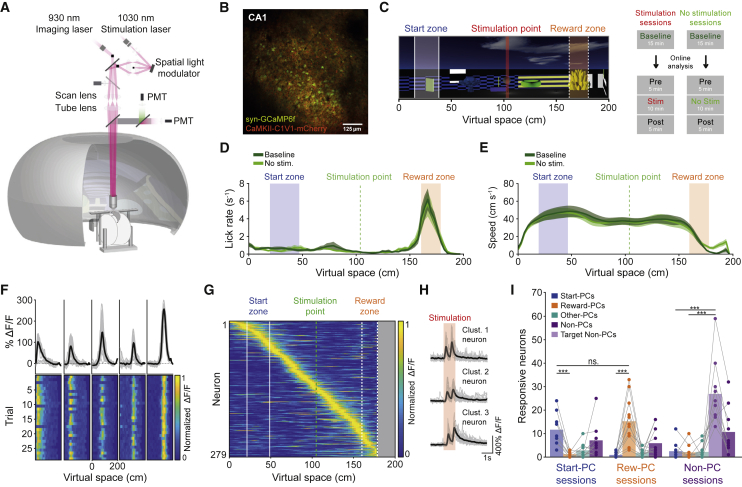
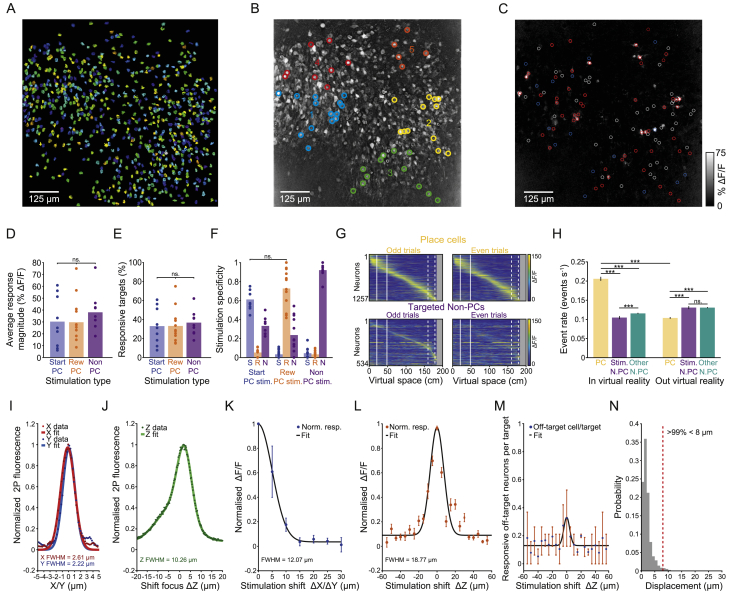
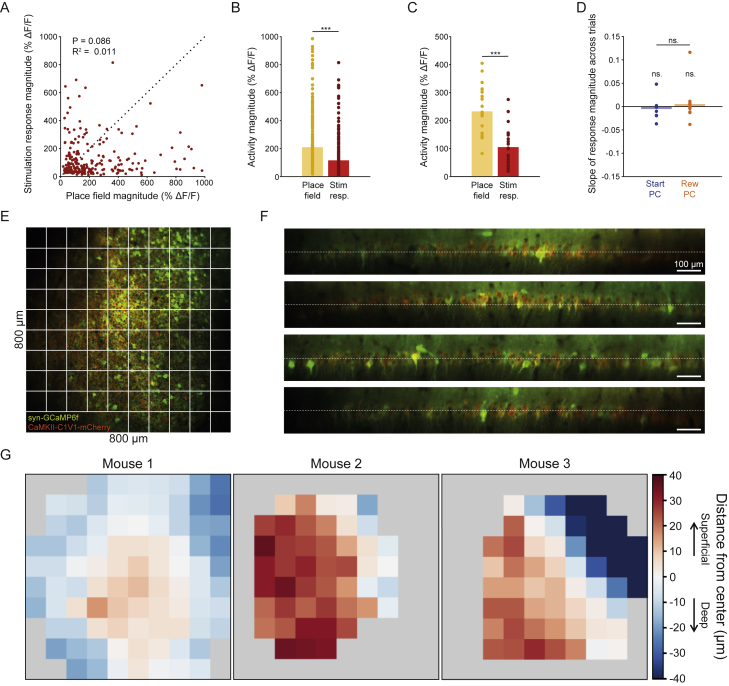
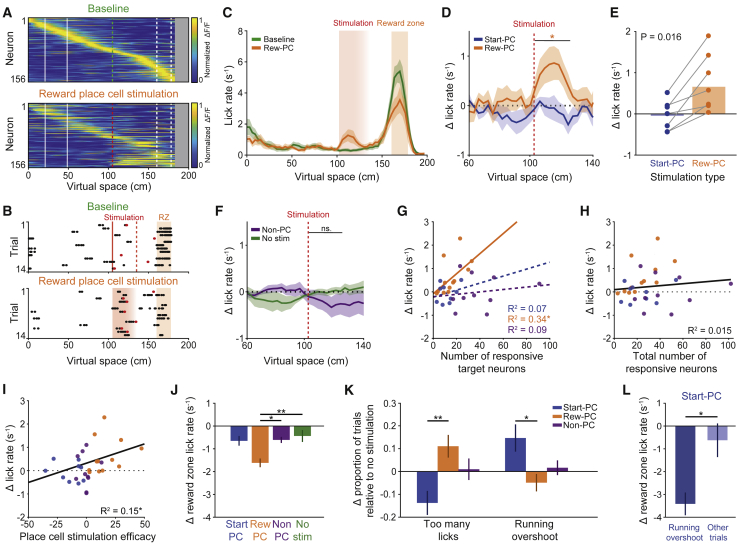
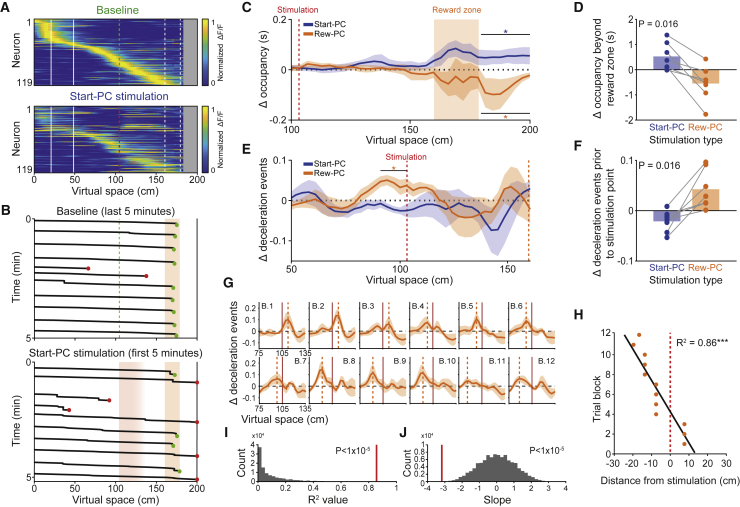
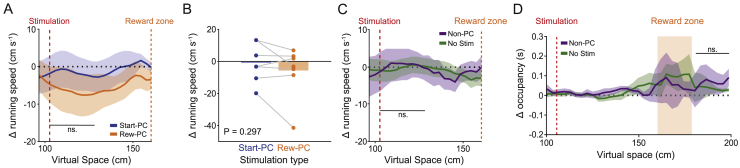
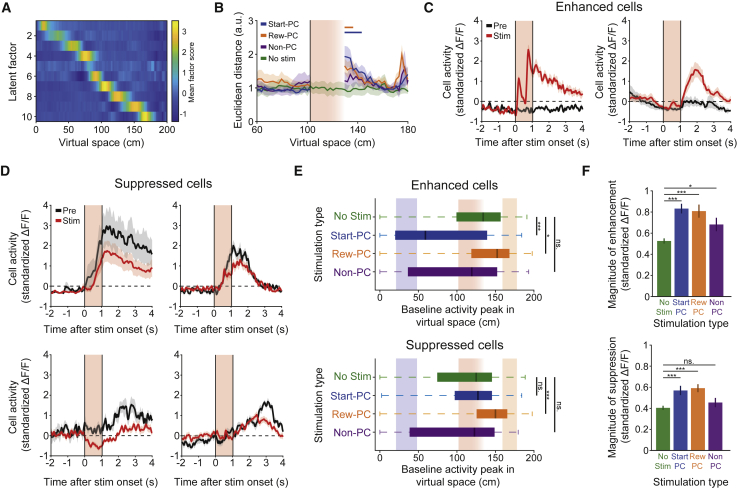
The hippocampus is crucial for spatial navigation and episodic memory formation. Hippocampal place cells exhibit spatially selective activity within an environment and have been proposed to form the neural basis of a cognitive map of space that supports these mnemonic functions. However, the direct influence of place cell activity on spatial navigation behavior has not yet been demonstrated. Using an 'all-optical' combination of simultaneous two-photon calcium imaging and two-photon optogenetics, we identified and selectively activated place cells that encoded behaviorally relevant locations in a virtual reality environment. Targeted stimulation of a small number of place cells was sufficient to bias the behavior of animals during a spatial memory task, providing causal evidence that hippocampal place cells actively support spatial navigation and memory.

Keywords: all-optical interrogation; behavior; hippocampus; inhibition; memory; place cell; spatial navigation; two-photon calcium imaging; two-photon optogenetics; virtual reality.


Conflict of interest statement

Declaration of Interests The authors declare no competing interests.

Figures

None
Graphical abstract
Figure 1
Figure 1
All-Optical Manipulation of Place Cells during Spatial Navigation in Virtual Reality (A) Schematic of head-fixed virtual reality setup and microscope design. (B) Example imaging field of view from CA1 stratum pyramidale showing neurons co-expressing GCaMP6f and C1V1. (C) Side-on view of the virtual reality linear track with start zone, reward zone, and stimulation point and schematic of the session structure. (D) Average lick-rate distribution across virtual space for the two behavioral epochs on no-stimulation days (n = 9 mice). (E) Average running speed distribution across virtual space for the two behavioral epochs on no-stimulation days. (F) Five simultaneously recorded place cells with ΔF/F traces across virtual space and ΔF/F heat plots across trials. (G) All place cells recorded from an example baseline epoch on a stimulation day and average ΔF/F across space for each neuron and ordered by peak location on the track. (H) Example photostimulation-targeted responsive neurons; black line shows photostimulus-triggered average response, and gray traces show individual trials; the two peaks correspond to the two 100 ms photostimulations of the cell. (I) Number of responsive neurons in Start-PC, Reward-PC, and Non-PC stimulation sessions where a single ensemble type was targeted for stimulation. p < 0.05; ∗∗∗p < 0.0005; all error bars show SEM. See also Figures S1 and S2.
Figure S1
Figure S1
Two-Photon Optogenetic Stimulation of Targeted Populations, Non-PC Control Group Characterization, Stimulation Resolution, and Brain Motion Quantification, Related to Figure 1 (A) Regions of interest extracted from one example session FOV. (B) 5 spatially clustered groups of Reward-PCs overlaid on a correlation image of the GCaMP6f signal from the imaging FOV, pixels values are weighted by their signal correlation with neighboring pixels. (C) Stimulation triggered average ΔF/F average intensity image from artifact subtracted recording frames during stimulation, taken from the same session as (A), red circles indicate targeted Reward-PCs, white circles denote non-targeted Start-PCs and blue circles denote stimulation zone place cells. (D) Average response magnitude across the population of responsive target neurons from each session. (E) Percentage of targets deemed responsive from each session. (F) Stimulation specificity for each experimental session, defined as the number of responsive neurons in the group divided by the sum of the number of responsive neurons across all groups. (G) Place cell population average ΔF/F across virtual space for targeted non-place cells and place cells from the same sessions, neurons in both plots are ordered by their peak ΔF/F in odd trials. (H) Event rates of place cells, targeted non-place cells and other non-place cells both in the virtual reality world and during the inter-trial interval, events were defined as the ΔF/F reaching 3 SD above the mean, error bars are SEM. (I) X and Y axis optical point spread function measurement for a stimulation beamlet. (J) Axial optical point spread function measurement for a stimulation beamlet. (K) All-optical physiological resolution along the X/Y axis as measured by the normalized GCaMP6f signal resulting from stimulation at different X/Y displacements from the target neurons, n = 21 neurons from 3 mice, error bars are 95% confidence interval. (L) Axial all-optical physiological resolution as measured by the normalized GCaMP6f signal resulting from stimulation at different Z displacements from the target neurons, n = 23 neurons from 2 mice, error bars are 95% confidence interval. (M) The fraction of off-target neurons per targeted cell when stimulating at different axial displacements, n = 2 sessions from 2 mice. (N) X/Y displacement resulting from brain motion during all stimulation epochs, determined by the translation required to maximize the correlation between each frame and an averaged image of the FOV.
Figure S2
Figure S2
Stimulated Place Cell Activation Was within Physiological Range, Stable across Trials, and Consisted of a Mixture of Deep/Intermediate/Superficial CA1 Pyramidal Neurons, Related to Figure 1 (A) Place field magnitude against response magnitude for all responsive targeted place cells. (B) Average place field peak magnitude and response window magnitude for all responsive targeted place cells. On average our neurons’ natural place fields exhibited a larger response than that driven by our stimulation, p = 5.88 × 10−16, two-sided rank-sum test. (C) Average place field peak magnitude and stimulation response magnitude for all responsive place cells averaged within each session. Our population average natural place field magnitude was larger than that driven by our stimulation, p = 3.31 × 10−5, two-sided rank-sum test, n = 21 sessions. (D) The slope of a linear fit to the response magnitude of the population of responsive neurons across trials from each session. These slopes did not differ from zero in either place cell stimulation group, and there was no difference in slope between Start-PC and Reward-PC sessions. (E) Example imaging FOV taken from one mouse. (F) Four example slices through the z stack taken from the same area of that mouse, dashed white line indicates the selected imaging plane. (G) Color maps depicting the deep/superficial location of neurons across the imaging FOV taken from 3 separate mice, gray indicates no neurons were present in that area.
Figure 2
Figure 2
Targeted Stimulation of Reward-Zone Place Cells Drives Reward-Zone-Related Behavior (A) Place cell population average ΔF/F across virtual space from an example Reward-PC stimulation session; top is the baseline epoch and bottom is the stimulation epoch, and neurons in both plots are ordered and normalized by their peak during the baseline epoch. (B) Raster plot of licking across space from the baseline and stimulation epochs of one example reward place cell stimulation session. Red circles denote licks that caused a trial to end in failure by crossing the threshold for the number of licks allowed outside of the reward zone. Only trials where the animal reached the stimulation point are shown, and trial numbers have been matched between epochs by taking trials from the end of the baseline epoch. (C) Average lick-rate distribution across space for baseline and Reward-PC stimulation epochs across all Reward-PC stimulation sessions. Note the increased lick rate during stimulation. (D) Change in lick rate from baseline across space during Reward-PC and Start-PC stimulation epochs, averaged within and then across animals (n = 7 mice). (E) Summary of the within mouse change in licking caused by Reward-PC and Start-PC stimulation. (F) Change in lick rate from baseline during non-place cell stimulation sessions (n = 6 mice) and no-stimulation control sessions (n = 9 mice). (G) Correlation between number of responsive target population neurons and change in lick rate from baseline for Reward-PC, Start-PC, and Non-PC sessions. (H) The total number of stimulated neurons across all sessions does not correlate to the change in licking. (I) Place cell stimulation efficacy correlates with the observed change in licking (see STAR Methods). (J) Change in reward-zone lick rate during stimulation epoch or no-stimulation equivalent. (K) Summary of trial outcome changes during stimulation experiments relative to baseline data. (L) Change in reward-zone lick rate separately for running overshoot and other trials during Start-PC stimulation sessions where there was an increase in running overshoots (n = 6 sessions). p < 0.05, ∗∗p < 0.01; all error bars show SEM.
Figure 3
Figure 3
Influence of Place Cell Stimulation on Running Behavior (A) Place cell population average ΔF/F across virtual space from an example Start-PC stimulation session, top is baseline epoch and bottom is stimulation epoch, and neurons in both plots are ordered and normalized by baseline peak. (B) Spatial trajectory data from the last 5 min of an example baseline epoch and first 5 min of the subsequent Start-PC stimulation epoch; green circles denote correct trials, red circles denote incorrect trials, and orange area depicts the reward zone. (C) Change in spatial occupancy from baseline across space during Reward-PC and Start-PC stimulation epochs, averaged within and then across animals (n = 7 mice). (D) Summary of the within mouse change in occupancy beyond the reward zone caused by Reward-PC and Start-PC stimulation (n = 7 mice). (E) Change in the number of deceleration events from baseline across space during Reward-PC and Start-PC stimulation epochs. (F) Summary of the within mouse change in deceleration events before the stimulation point caused by Reward-PC and Start-PC stimulation (n = 7 mice). (G) Change in the number of deceleration events from baseline during Reward-PC stimulation epochs relative to the stimulation point, 3 trial blocks in each panel with a sliding window approach, averaged within and then across animals (n = 7 mice); dashed orange lines mark the peak of the increase in deceleration events, solid red lines marks the stimulation point. (H) Peak location of the increase in deceleration events across trial blocks (Pearson’s correlation). (I) Chance distribution of correlation R2 values generated from 100,000 shuffles of trial block order and observed value from the data in (H) (red line). (J) Same as in (I) but for the slope of a linear fit. p < 0.05, ∗∗∗p < 0.001; all error bars show SEM. See also Figure S3.
Figure S3
Figure S3
Effect of Stimulation on Running Speed, Related to Figure 3 (A) Animal-wise delta running speed at the stimulation point between baseline and stimulation epochs for Start-PC and Reward-PC stimulation sessions. (B) Summary of the within animal delta running speed resulting from stimulation. (C) Delta running speed at the stimulation point between baseline and stimulation epochs for Non-PC stimulation sessions and no stimulation control sessions. (D) Change in spatial occupancy from baseline during Non-PC stimulation and no stimulation control epochs. All error bars show SEM.
Figure 4
Figure 4
Targeted Stimulation of Place Cells Interacts with Endogenous Activity (A) Factor analysis yields a low-dimensional representation of population dynamics. Shown is a representative example of trial-averaged baseline activity. The coordinated activity of groups of correlated place cells is reflected in the spatial tuning of latent factors. (B) Euclidean distance between mean latent trajectories for stimulation trials and the immediately preceding pre-epoch trials; lines along the top show consecutive bins that are significantly different after stimulation when compared to before (p < 0.05, two-sided rank-sum test). The divergence of trajectories comprising the second peak at the end of the reward zone was not statistically significant. Photostimulation occurred during the red shaded area (the data during this period were not included in the analysis). (C) Standardized stimulus triggered average ΔF/F traces from two example neurons that were identified as being enhanced during stimulation trials; the red area depicts the stimulation duration. (D) Standardized stimulus triggered average ΔF/F traces from four example neurons that were identified as being suppressed during stimulation trials. (E) The baseline spatial tuning of neurons that were identified as either enhanced or suppressed during stimulation or the no-stimulation equivalent; plots show median and interquartile range. (F) The magnitude of enhancement or suppression was greater during place cell stimulation than during the equivalent epochs from no-stimulation control sessions. The magnitude of suppression following Non-PC stimulation was similar to no-stimulation control data. p < 0.05, ∗∗∗p < 0.001; all error bars show SEM. See also Figure S4.
Figure S4
Figure S4
Opsin Expression Was Largely Specific to Excitatory Neurons and Activity Suppression Is Still Evident When Discounting Stimulation Targeted Neurons and Those within Range of Off-Target Activation, Related to Figure 4 (A) Immunohistochemistry identified GABA+ putative interneurons (white arrowheads), which did not exhibit opsin-associated mCherry signal, scale bars show 15 μm. Note that some GABA+ ROIs will correspond to astrocytes, and these have been excluded from the quantification based on their morphology. (B) Quantification of background subtracted fluorescence signal within GABA+ and C1V1+ ROIs. The GABA+ ROIs had background subtracted opsin-associated signal that did not differ from zero (p = 0.1, signed-rank test n = 114) and which was significantly lower than that in C1V1+ ROIs (p = 6.15 × 10−20, signed-rank test, n = 114 GABA+ and 157 C1V1+ ROIs). (C) The spatial tuning of neurons which were identified as either enhanced or suppressed with targets and proximal neurons excluded, plots show median and interquartile range. (D) The magnitude of enhancement or suppression in identified neurons during place cell stimulation and the equivalent epochs during no stimulation control sessions. The increase in suppression observed during place cell stimulation remained when targeted and proximal neurons were excluded from the analysis. Error bars show SEM.
Figure 5
Figure 5
Stimulation-Driven Remapping Influences Spatial Behavior (A) Trial-wise normalized ΔF/F heat plots for 4 neurons from baseline, Start-PC, Reward-PC, and Non-PC stimulation sessions; the track is cropped at 180 cm due to low occupancy data beyond the reward zone. Only trials where the mouse traversed at least 150 cm of the track are shown. (B) Single-cell correlation values for average pre-post epoch place maps across sessions and split by baseline place field location. (C) Distributions of place field center-of-mass for pre- and post-epochs during no-stimulation and place cell stimulation sessions. Note the shift toward the center of the track after stimulation of the place cell network. (D) Pre-post place field center-of-mass distribution peak differences across session type. (E) Center of mass shifts for all Start-PCs and Reward-PCs during no-stimulation, Start-PC stimulation, and Reward-PC stimulation sessions. (F) Average single-cell center-of-mass shifts for Start-PCs and Reward-PCs across session types. (G) Pre-post change in lick distribution across space averaged across sessions. (H) Summary of the change in lick rate within the reward area between pre- and post-epochs for different session types, licking was decreased following Reward-PC stimulation. (I) Correlation between the change in reward-zone lick rate and the shift in place cell distribution peak across all session types. p < 0.05, ∗∗p < 0.01, ∗∗∗p < 0.001; all error bars show SEM. See also Figure S5.
Figure S5
Figure S5
Stimulation-Driven Remapping Controls, Related to Figure 5 (A) Pre-post epoch spatial activity profile correlation for responsive and unresponsive Start-PCs and Reward-PCs, demonstrating that we did not observe more remapping in responsive neurons (p = 0.14 Start-PC and p = 0.69 Reward-PC, two-sided rank-sum test). (B) Calcium trace peak ΔF/F value location across virtual space for place cells identified during the baseline epoch of stimulation days. (C) Shuffled chance distribution of the number of place cells with peaks inside the reward zone and real data value (red line). Shuffle distribution generated by randomly translating each place cells average ΔF/F trace within the spatial range of the track. (D) Place cell center of mass distributions for all place cells in pre and post epochs of Non-PC stimulation days. (E) Pre-post center of mass shift for Start-PCs and Reward-PCs during Non-PC stimulation sessions. (F) Pre-post center of mass shift for stimulation zone place cells across all session types. (G) Pre-post center of mass shift for all place cells across different session types. (H) Summary of the stimulation zone place cell pre-post center of mass shifts, no differences were found (Kruskal-Wallis test). (I) Summary of the pre-post center of mass shift for all neurons, the shift was different when comparing Reward-PC sessions to all other session types, p = 0.0013, p = 0.0002 and p = 0.0145 for No stim, Start-PC and Non-PC respectively, Kruskal-Wallis with Dunn’s test. (J) Delta lick rate between pre and post equivalent epochs for non-stimulation days. All error bars show SEM.

Comment in

References

    1. Allen T.A., Salz D.M., McKenzie S., Fortin N.J. Nonspatial sequence coding in CA1 neurons. J. Neurosci. 2016;36:1547–1563. - PMC - PubMed
    1. Alme C.B., Miao C., Jezek K., Treves A., Moser E.I., Moser M.-B. Place cells in the hippocampus: eleven maps for eleven rooms. Proc. Natl. Acad. Sci. USA. 2014;111:18428–18435. - PMC - PubMed
    1. Aronov D., Nevers R., Tank D.W. Mapping of a non-spatial dimension by the hippocampal-entorhinal circuit. Nature. 2017;543:719–722. - PMC - PubMed
    1. Bittner K.C., Grienberger C., Vaidya S.P., Milstein A.D., Macklin J.J., Suh J., Tonegawa S., Magee J.C. Conjunctive input processing drives feature selectivity in hippocampal CA1 neurons. Nat. Neurosci. 2015;18:1133–1142. - PMC - PubMed
    1. Bittner K.C., Milstein A.D., Grienberger C., Romani S., Magee J.C. Behavioral time scale synaptic plasticity underlies CA1 place fields. Science. 2017;357:1033–1036. - PMC - PubMed

Publication types