. 2020 Nov 25;183(5):1367-1382.e17.
doi: 10.1016/j.cell.2020.10.043. Epub 2020 Oct 31.

Elicitation of Potent Neutralizing Antibody Responses by Designed Protein Nanoparticle Vaccines for SARS-CoV-2

Affiliations

Elicitation of Potent Neutralizing Antibody Responses by Designed Protein Nanoparticle Vaccines for SARS-CoV-2

Alexandra C Walls et al. Cell. .

Abstract

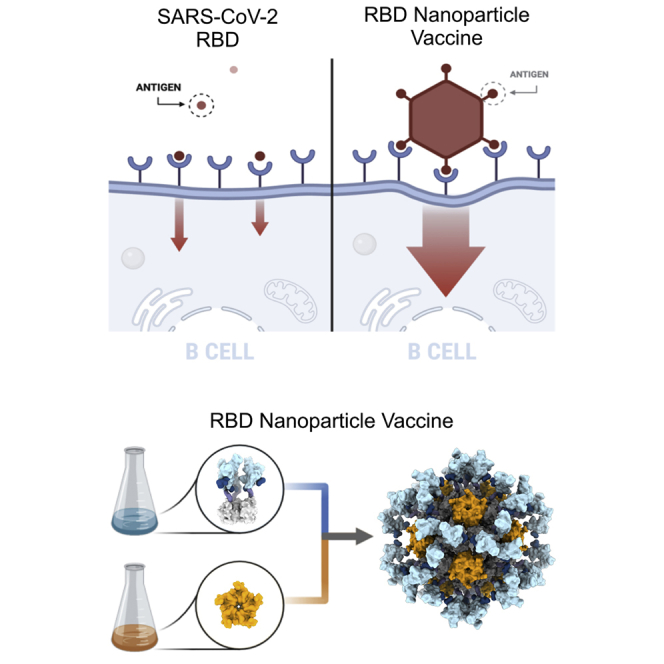
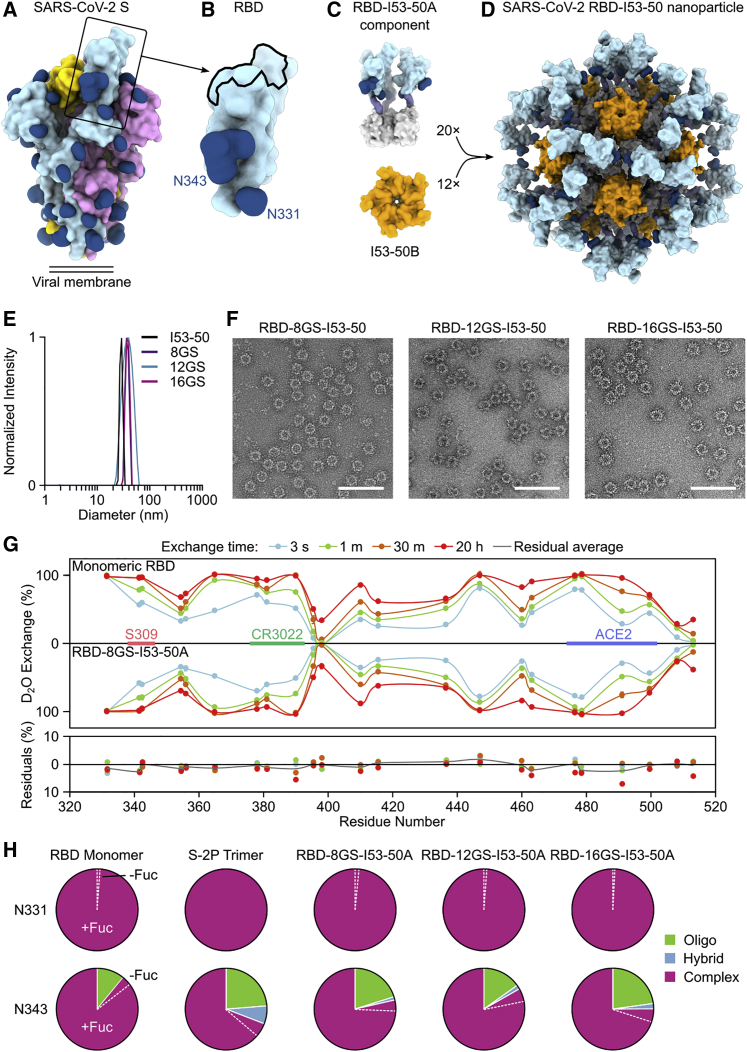
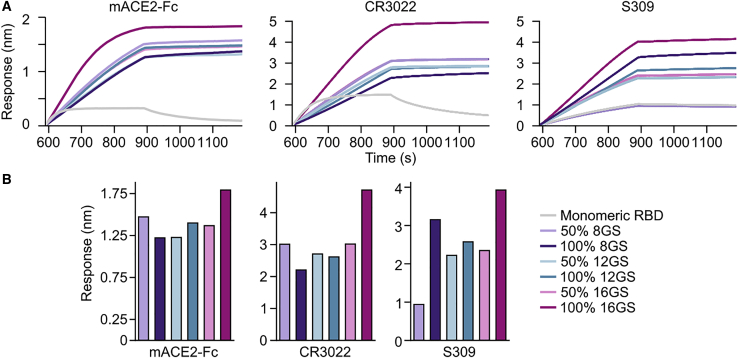
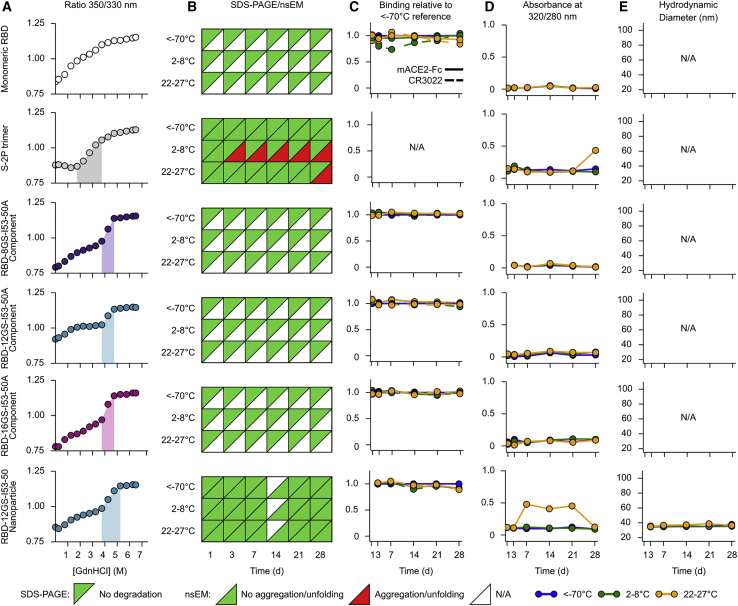
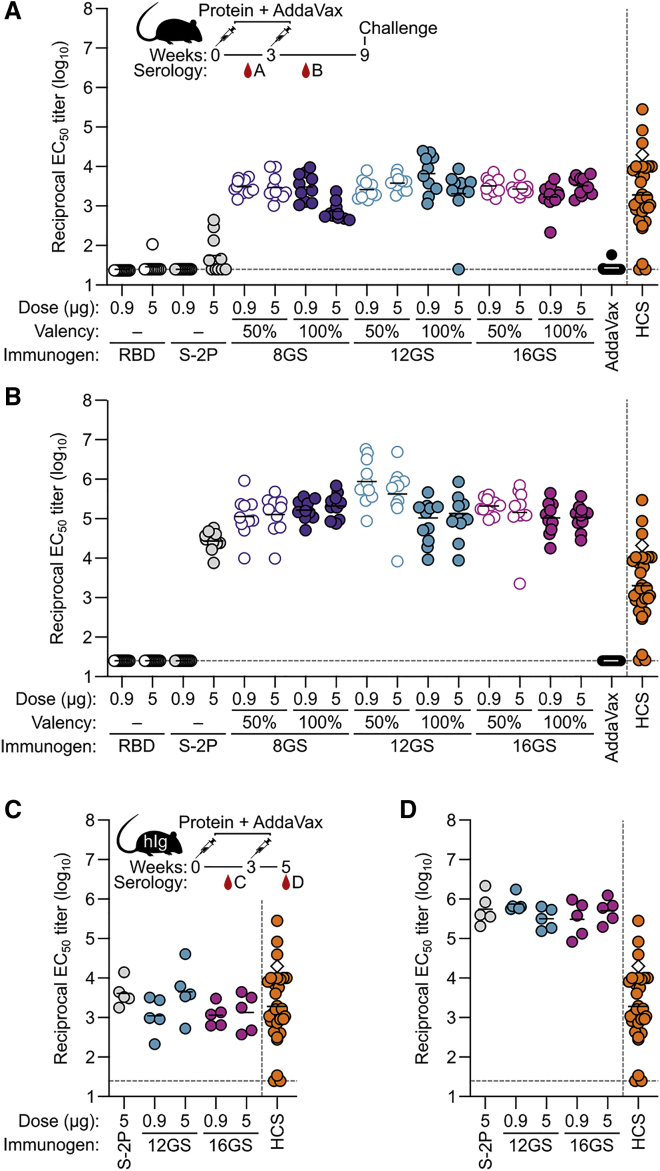
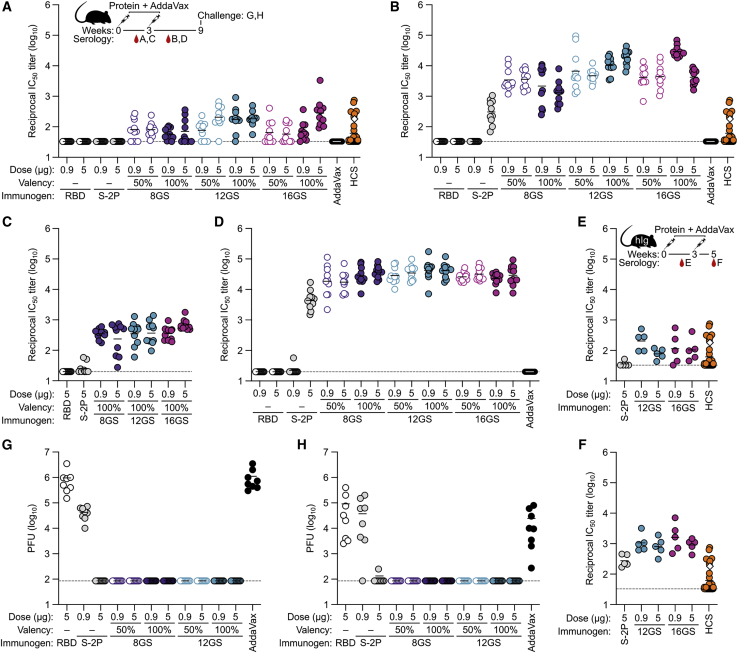
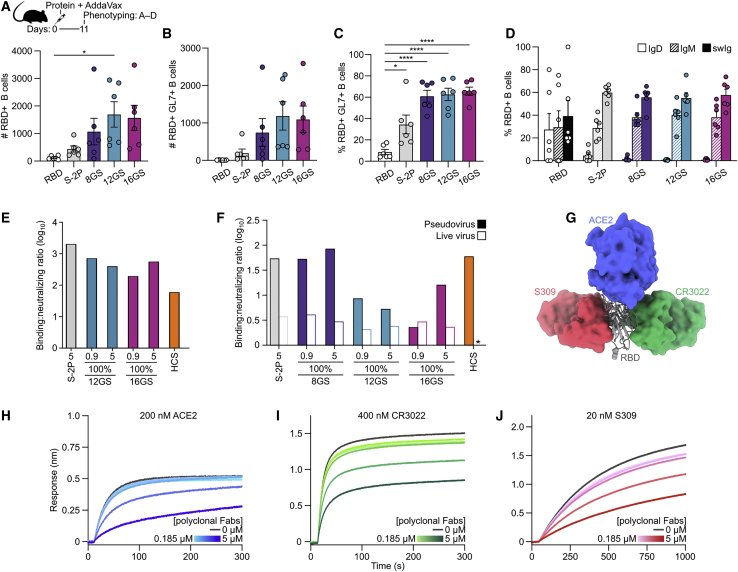
A safe, effective, and scalable vaccine is needed to halt the ongoing SARS-CoV-2 pandemic. We describe the structure-based design of self-assembling protein nanoparticle immunogens that elicit potent and protective antibody responses against SARS-CoV-2 in mice. The nanoparticle vaccines display 60 SARS-CoV-2 spike receptor-binding domains (RBDs) in a highly immunogenic array and induce neutralizing antibody titers 10-fold higher than the prefusion-stabilized spike despite a 5-fold lower dose. Antibodies elicited by the RBD nanoparticles target multiple distinct epitopes, suggesting they may not be easily susceptible to escape mutations, and exhibit a lower binding:neutralizing ratio than convalescent human sera, which may minimize the risk of vaccine-associated enhanced respiratory disease. The high yield and stability of the assembled nanoparticles suggest that manufacture of the nanoparticle vaccines will be highly scalable. These results highlight the utility of robust antigen display platforms and have launched cGMP manufacturing efforts to advance the SARS-CoV-2-RBD nanoparticle vaccine into the clinic.

Keywords: RBD; SARS-CoV-2; computational protein design; nanoparticle; protein; vaccine.


Conflict of interest statement

Declaration of Interests A.C.W, D.V., and N.P.K. are named as inventors on patent applications filed by the University of Washington based on the studies presented in this paper. N.P.K. is a co-founder, shareholder, paid consultant, and chair of the scientific advisory board of Icosavax, Inc. and has received an unrelated sponsored research agreement from Pfizer. D.V. is a consultant for and has received an unrelated sponsored research agreement from Vir Biotechnology Inc. H.Y.C. is a consultant for Merck and Pfizer and has received research funding from Sanofi-Pasteur, Roche-Genentech, Cepheid, and Ellume outside of the submitted work. P.K., A.P., and S.C. are employees and shareholders of Kymab Ltd. The other authors declare no competing interests.

Figures

None
Graphical abstract
Figure 1
Figure 1
Design, In Vitro Assembly, and Characterization of SARS-CoV-2 RBD Nanoparticle Immunogens (A) Molecular surface representation of the SARS-CoV-2 S-2P trimer in the prefusion conformation (PDB 6VYB). Each protomer is colored distinctly, and N-linked glycans are rendered dark blue (the glycan at position N343 was modeled based on PDB 6WPS and the receptor-binding motif [RBM] was modeled from PDB 6M0J). A single open RBD is boxed. (B) Molecular surface representation of the SARS-CoV-2 S RBD, including the N-linked glycans at positions 331 and 343. The ACE2 receptor-binding site or RBM is indicated with a black outline. (C) Structural models of the trimeric RBD-I53-50A (RBD in light blue and I53-50A in light gray) and pentameric I53-50B (orange) components. Upon mixing in vitro, 20 trimeric and 12 pentameric components assemble to form nanoparticle immunogens with icosahedral symmetry. Each nanoparticle displays 60 copies of the RBD. (D) Structural model of the RBD-12GS-I53-50 nanoparticle immunogen. Although a single orientation of the displayed RBD antigen and 12-residue linker are shown for simplicity, these regions are expected to be flexible relative to the I53-50 nanoparticle scaffold. (E) DLS of the RBD-8GS-, RBD-12GS-, and RBD-16GS-I53-50 nanoparticles compared to unmodified I53-50 nanoparticles. (F) Representative electron micrographs of negatively stained RBD-8GS-, RBD-12GS-, and RBD-16GS-I53-50 nanoparticles. The samples were imaged after one freeze/thaw cycle. Scale bars, 100 nm. (G) Hydrogen/deuterium-exchange mass spectrometry of monomeric RBD versus trimeric RBD-8GS-I53-50A component, represented here as a butterfly plot, confirms preservation of the RBD conformation, including at epitopes recognized by known neutralizing Abs. In the plot, each point along the horizontal sequence axis represents a peptide where deuterium uptake was monitored from 3 s to 20 h. Error bars shown on the butterfly plot indicate standard deviations from two experimental replicates. The difference plot below demonstrates that monomeric RBD and RBD-8GS-I53-50A are virtually identical in local structural ordering across the RBD. (H) Pie charts summarizing the glycan composition at the N-linked glycosylation sites N331 and N343 in five protein samples: monomeric RBD, S-2P trimer, RBD-8GS-, RBD-12GS-, and RBD-16GS-I53-50A trimeric components. The majority of the complex glycans at both sites were fucosylated; minor populations of non-fucosylated glycans are indicated by dashed white lines. Oligo, oligomannose.
Figure S1
Figure S1
Additional characterization of RBD Nanoparticle Immunogens, Related to Figure 1 (A) Size exclusion chromatography of RBD-I53-50 nanoparticles, unmodified I53-50 nanoparticle, and trimeric RBD-I53-50A components on a Superose 6 Increase 10/300 GL. (B) SDS-PAGE of SEC-purified RBD-I53-50 nanoparticles under reducing and non-reducing conditions before and after one freeze/thaw cycle. (C) Dynamic light scattering of RBD-I53-50 nanoparticles before and after one freeze/thaw cycle indicates monodisperse nanoparticles with a lack of detectable aggregates in each sample. (D) Hydrogen/Deuterium-exchange mass spectrometry analysis, represented here as heatmaps, reveals the structural accessibility and dynamics of the RBD (PDB 6W41). Color codes indicate deuterium uptake levels. Monomeric RBD and RBD-8GS-I53-50A have indistinguishable uptake patterns, and are presented in a single heatmap at each time point. (E) Top, bar graphs reveal similar glycan profiles at the N-linked glycosylation sites N331 and N343 in five protein samples: monomeric RBD, S-2P trimer, RBD-8GS-, RBD-12GS-, and RBD-16GS-I53-50A trimeric components. Bottom, comprehensive glycan profiling on other N-linked glycosylation sites besides N331 and N343 that are found in the S-2P trimer. The axis of each bar graph is scaled to 0%–80%. M9 to M5, oligomannose with 9 to 5 mannose residues, are colored green. Hybrid and FHybrid, hybrid types with or without fucosylation, are blue. Subtypes in complex type, shown in pink, are classified based on antennae number and fucosylation (Harvey et al., 2011).
Figure S2
Figure S2
Determination of hACE2 and CR3022 Fab Affinities by Biolayer Interferometry, Related to Table 1 (A) Analysis of monomeric hACE2 binding to immobilized monomeric RBD and trimeric RBD-8GS-, RBD-12GS-, and RBD-16GS-I53-50A components. (B) Analysis of CR3022 Fab binding to immobilized monomeric RBD and trimeric RBD-8GS-, RBD-12GS-, and RBD-16GS-I53-50A components. Affinity constants (Table 1) were determined by global fitting of the kinetic data from six analyte concentrations to a 1:1 binding model (black lines).
Figure S3
Figure S3
Characterization of Partial Valency RBD Nanoparticles, Related to Figure 2 (A) Representative electron micrographs of negatively stained RBD-8GS-, RBD-12GS-, and RBD-16GS-I53-50 nanoparticles displaying the RBD at 50% valency. The samples were imaged after one freeze/thaw cycle. Scale bars, 100 nm. (B) SDS-PAGE of purified RBD-8GS-, RBD-12GS-, and RBD-16GS-I53-50 nanoparticles displaying the RBD at 50% valency. Both RBD-bearing and unmodified I53-50A subunits are visible on the gels. (C) DLS of 50% valency RBD-8GS-, RBD-12GS-, and RBD-16GS-I53-50 nanoparticles both before and after freeze/thaw. No aggregates or unassembled components were observed. (D) UV/vis absorption spectra of 50% valency RBD-8GS-, RBD-12GS-, and RBD-16GS-I53-50 nanoparticles. Turbidity in the samples is low, as indicated by the low absorbance at 320 nm.
Figure 2
Figure 2
Antigenic Characterization of SARS-CoV-2 RBD-I53-50 Nanoparticle Immunogens (A) Biolayer interferometry of immobilized mACE2-Fc, CR3022 mAb, and S309 mAb binding to RBD-8GS-, RBD-12GS-, and RBD-16GS-I53-50 nanoparticles displaying the RBD antigen at 50% or 100% valency. The monomeric SARS-CoV-2 RBD was included in each experiment as a reference. (B) The magnitude of the binding response at 880 s, near the end of the association phase, is plotted for each experiment in (A) to enable comparison of the binding signal obtained from each nanoparticle.
Figure 3
Figure 3
Physical and Antigenic Stability of RBD Nanoparticle Immunogens and S-2P Trimer (A) Chemical denaturation by guanidine hydrochloride. The ratio of intrinsic tryptophan fluorescence emission at 350/320 nm was used to monitor retention of protein tertiary structure. Major transitions are indicated by shaded regions. Representative data from one of three independent experiments are shown. (B) Summary of SDS-PAGE and nsEM stability data over 4 weeks. SDS-PAGE showed no detectable degradation in any sample. nsEM revealed substantial unfolding of the S-2P trimer at 2°C–8°C after 3 days incubation, and at 22°C–27°C after 4 weeks. N/A, not assessed. (C) Summary of antigenicity data over 4 weeks. The antigens were analyzed for mACE2-Fc (solid lines) and CR3022 mAb (dashed lines) binding by biolayer interferometry after storage at the various temperatures. The plotted value represents the amplitude of the signal near the end of the association phase normalized to the corresponding <−70°C sample at each time point. (D) Summary of UV/vis stability data over 4 weeks. The ratio of absorbance at 320/280 nm is plotted as a measure of particulate scattering. Only the S-2P trimer and the RBD-12GS-I53-50 nanoparticle showed any increase in scattering and only at ambient temperature. (E) DLS of the RBD-12GS-I53-50 nanoparticle indicated a monodisperse species with no detectable aggregate at all temperatures and time points. The data in (B–E) are from a 4-week real-time stability study that was performed once.
Figure S4
Figure S4
Day 28 Stability Data, Related to Figure 3 (A) SDS-PAGE of purified monomeric RBD, S-2P trimer, RBD-I53-50A components and RBD-12GS-I53-50 nanoparticle in reducing and non-reducing conditions. No degradation of any immunogen was observed after a four-week incubation at any temperature analyzed. (B) Analysis of mACE2-Fc and CR3022 IgG binding to monomeric RBD, RBD-I53-50A trimeric components, and RBD-12GS-I53-50 nanoparticle by BLI after a four-week incubation at three temperatures. Monomeric RBD was used as a reference standard in nanoparticle component and nanoparticle BLI experiments. The RBD-12GS-I53-50 nanoparticle lost minimal binding at the higher temperatures after four weeks; the remaining antigens did not lose any mACE2-Fc or CR3022 IgG binding over the course of the study. (C) UV/vis spectroscopy showed minimal absorbance in the near-UV, suggesting a lack of aggregation/particulates after a four week-incubation at three temperatures, with the exception of S-2P trimer, which gained significant absorbance around 320 nm at ambient temperature. RBD-12GS-I53-50 nanoparticle samples at 22-27°C at several earlier time points exhibited similar peaks near 320 nm (see Data S2). (D) nsEM of RBD-12GS-I53-50 nanoparticle (top) and S-2P trimer (bottom) after a 4-week incubation at three temperatures. Intact monodisperse nanoparticles were observed at all temperatures, with no observed degradation or aggregation. The S-2P trimer remained well folded in the < -70°C and 22-27°C samples, but was unfolded in samples incubated at 2-8°C. Scale bars: RBD-12GS-I53-50, 100 nm; S-2P, 50 nm. (E) DLS of the RBD-12GS-I53-50 nanoparticle after a four-week incubation at three temperatures. No aggregation was observed at any temperature.
Figure 4
Figure 4
RBD-I53-50 Nanoparticle Immunogens Elicit High Ab Titers in BALB/c and Human Immune Repertoire Mice (A and B) Post-prime (week 2) (A) and post-boost (week 5) (B) anti-S Ab binding titers in BALB/c mice, measured by ELISA. Each symbol represents an individual animal, and the GMT from each group is indicated by a horizontal line. 8GS, RBD-8GS-I53-50; 12GS, RBD-12GS-I53-50; 16GS, RBD-16GS-I53-50; HCS, COVID-19 human convalescent sera. The open diamond in the HCS data is the benchmark NIBSC plasma (see STAR Methods). The inset depicts the study timeline. The mouse immunization study was repeated twice, and representative data are shown. (C and D) Post-prime (week 2) (C) and post-boost (week 5) (D) anti-S Ab binding titers in Kymab Darwin mice, which are transgenic for the non-rearranged human Ab variable and constant region germline repertoire, measured by ELISA and plotted as in (A). The inset depicts the study timeline. The mouse immunization study was performed once. The dotted horizontal lines represent the lower limit of detection of the assay, and the dotted vertical lines highlight that measurements on HCS used a different secondary Ab than measurements on mouse sera. Raw data are provided in Data S3, and statistical analyses are provided in Data S4.
Figure S5
Figure S5
Subclasses of Vaccine-Elicited Abs and Anti-scaffold Antibody Titers, Related to Figure 4 Levels of vaccine-elicited IgG specific to the (top) trimeric I53-50A component, (middle) pentameric I53-50B component, and (bottom) assembled I53-50 nanoparticle two weeks post-prime (left) and post-boost (right) in BALB/c mice. Data are plotted as in Figure 4 and are representative data from technical replicates that were performed at least twice.
Figure 5
Figure 5
RBD-I53-50 Nanoparticle Immunogens Elicit Potent and Protective Neutralizing Ab Responses (A and B) Serum pseudovirus neutralizing titers post-prime (A) and post-boost (B) from mice immunized with monomeric RBD, S-2P trimer, or RBD-I53-50 nanoparticles. Each circle represents the reciprocal IC50 of an individual animal. GMT for each group is indicated by a horizontal line. 8GS, RBD-8GS-I53-50; 12GS, RBD-12GS-I53-50; 16GS, RBD-16GS-I53-50; HCS, COVID-19 human convalescent sera. The open diamond in the HCS data is the benchmark NIBSC plasma (see STAR Methods). The inset depicts the study timeline. The mouse immunization study was performed twice, and representative data from duplicate measurements are shown. (C and D) Serum live virus neutralizing titers post-prime (C) and post-boost (D) from mice immunized as described in (A). (E and F) Serum pseudovirus neutralizing titers from Kymab Darwin mice post-prime (E) and post-boost (F), immunized as described in (A). The mouse immunization study was performed once, and the neutralization assays were performed at least in duplicate. (G and H) Seven weeks post-boost, eight BALB/c mice per group were challenged with SARS-CoV-2 MA. Two days post-challenge, viral titers in lung tissue (G) and nasal turbinates (H) were assessed. The dotted horizontal lines represent the lower limit of detection of the assays. Raw data are provided in Data S3, and statistical analyses are provided in Data S4.
Figure S6
Figure S6
B Cell Gating Strategy and Durability of the Vaccine-Elicited Immune Response, Related to Figures 4, 5, and 6 (A) Representative gating strategy for evaluating RBD-specific B cells, germinal center (GC) precursors and B cells (CD38+/–GL7+), and B cell isotypes. Top row, gating strategy for measuring numbers of live, non-doublet B cells. These cells were further analyzed as depicted in the middle and bottom rows. Middle row, representative data from a mouse immunized with the monomeric RBD formulated with AddaVax. RBD+CD38+/–GL7+ cells that did not bind decoys were counted as antigen-specific GC precursors and B cells. Bottom row, representative data from a mouse immunized with the RBD-12GS-I53-50 nanoparticle formulated with AddaVax. GC precursors and B cells were further analyzed to characterize B cell receptor isotypes. (B and C) Levels of (B) S-specific IgG and (C) pseudovirus neutralization in sera collected 20 (RBD-16GS-I53-50) or 24 (monomeric RBD, S-2P, RBD-8GS-I53-50, and RBD-12GS-I53-50) weeks post-boost. Sera were collected from the two animals from each group that were not challenged with MA-SARS-CoV-2. Data are plotted as in Figures 4 and 5. (D) Numbers of S-2P–specific Ab secreting cells in the bone marrow of BALB/c mice immunized with either S-2P trimer or RBD-16GS-I53-50 nanoparticle, measured by ELISpot. Cells were harvested 17 weeks post-boost (see panel B inset). The animal experiment was performed once. Statistical significance was determined by two-tailed unpaired t test. p = 0.02.
Figure 6
Figure 6
RBD Nanoparticle Vaccines Elicit Robust B Cell Responses and Abs Targeting Multiple Epitopes in Mice and a Nonhuman Primate (A and B) Number of RBD+ B cells (B220+CD3CD138) (A) and RBD+ GC precursors and B cells (CD38+/–GL7+) (B) detected across each immunization group. (C and D) Frequency of RBD+ GC precursors and B cells (CD38+/–GL7+) (C) and IgD+, IgM+, or class-switched (IgMIgD; swIg+) RBD+ GC precursors and B cells (D). In (A–D), n = 6 across two experiments for each group. Statistical significance was determined by one-way ANOVA, and Tukey’s multiple comparisons tests were performed for any group with a p value less than 0.05. Significance is indicated with stars: p < 0.05; ∗∗∗∗p < 0.0001. (E) Ratio post-boost (week 5) of S-2P ELISA binding titer (Figure 4D) to pseudovirus neutralization titers (Figure 5F) in Kymab Darwin mice. The ratio is the (GMT [EC50] of five mice):(the GMT [IC50] of five mice) or the EC50:IC50 of all HCS tested. Lower values correspond to higher quality Ab responses. (F) Ratio post-boost (week 5) of S-2P ELISA binding titer (Figure 4B) to either pseudovirus (Figure 5B) or live virus (Figure 5D) neutralization titers in BALB/c mice. The ratio is the (GMT [EC50] of 10 mice]:(the GMT [IC50] of 10 mice) or the EC50:IC50 of all HCS tested. (G) SARS-CoV-2 RBD (gray ribbon) with monomeric ACE2 (blue surface), CR3022 Fab (green surface), and S309 Fab (red surface) bound. (H–J) Determination of vaccine-elicited Ab epitope specificity by competition BLI. A dilution series of purified polyclonal NHP Fabs was pre-incubated with the SARS-CoV-2 RBD immobilized on BLI biosensors. The 1:3 dilution series of polyclonal Fabs is represented from dark to light, with a dark gray line representing competitor loaded to apo-RBD (no competition). Competition with 200 nM ACE2 (H), 400 nM CR3022 (I), or 20 nM S309 (J).

Update of

References

    1. Alsoussi W.B., Turner J.S., Case J.B., Zhao H., Schmitz A.J., Zhou J.Q., Chen R.E., Lei T., Rizk A.A., McIntire K.M. A Potently Neutralizing Antibody Protects Mice against SARS-CoV-2 Infection. J Immunol. 2020;205:ji2000583. - PMC - PubMed
    1. Anthony S.J., Gilardi K., Menachery V.D., Goldstein T., Ssebide B., Mbabazi R., Navarrete-Macias I., Liang E., Wells H., Hicks A. Further Evidence for Bats as the Evolutionary Source of Middle East Respiratory Syndrome Coronavirus. MBio. 2017;8:e00373-17. - PMC - PubMed
    1. Anywaine Z., Whitworth H., Kaleebu P., Praygod G., Shukarev G., Manno D., Kapiga S., Grosskurth H., Kalluvya S., Bockstal V. Safety and Immunogenicity of a 2-Dose Heterologous Vaccination Regimen With Ad26.ZEBOV and MVA-BN-Filo Ebola Vaccines: 12-Month Data From a Phase 1 Randomized Clinical Trial in Uganda and Tanzania. J. Infect. Dis. 2019;220:46–56. - PMC - PubMed
    1. Bale J.B., Gonen S., Liu Y., Sheffler W., Ellis D., Thomas C., Cascio D., Yeates T.O., Gonen T., King N.P., Baker D. Accurate design of megadalton-scale two-component icosahedral protein complexes. Science. 2016;353:389–394. - PMC - PubMed
    1. Barnes C.O., West A.P., Huey-Tubman K.E., Hoffmann M.A.G., Sharaf N.G., Hoffman P.R., Koranda N., Gristick H.B., Gaebler C., Muecksch F. Structures of Human Antibodies Bound to SARS-CoV-2 Spike Reveal Common Epitopes and Recurrent Features of Antibodies. Cell. 2020;182:828–842. - PMC - PubMed

Publication types

MeSH terms