

Height and body-mass index trajectories of school-aged children and adolescents from 1985 to 2019 in 200 countries and territories: a pooled analysis of 2181 population-based studies with 65 million participants
- PMID: 33160572
- PMCID: PMC7658740
- DOI: 10.1016/S0140-6736(20)31859-6
Height and body-mass index trajectories of school-aged children and adolescents from 1985 to 2019 in 200 countries and territories: a pooled analysis of 2181 population-based studies with 65 million participants
Abstract
Background: Comparable global data on health and nutrition of school-aged children and adolescents are scarce. We aimed to estimate age trajectories and time trends in mean height and mean body-mass index (BMI), which measures weight gain beyond what is expected from height gain, for school-aged children and adolescents.
Methods: For this pooled analysis, we used a database of cardiometabolic risk factors collated by the Non-Communicable Disease Risk Factor Collaboration. We applied a Bayesian hierarchical model to estimate trends from 1985 to 2019 in mean height and mean BMI in 1-year age groups for ages 5-19 years. The model allowed for non-linear changes over time in mean height and mean BMI and for non-linear changes with age of children and adolescents, including periods of rapid growth during adolescence.
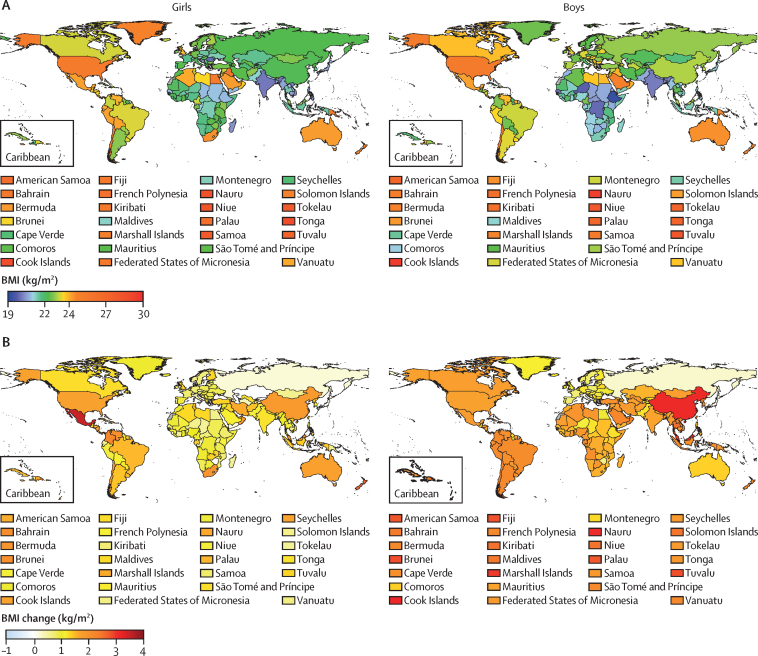
Findings: We pooled data from 2181 population-based studies, with measurements of height and weight in 65 million participants in 200 countries and territories. In 2019, we estimated a difference of 20 cm or higher in mean height of 19-year-old adolescents between countries with the tallest populations (the Netherlands, Montenegro, Estonia, and Bosnia and Herzegovina for boys; and the Netherlands, Montenegro, Denmark, and Iceland for girls) and those with the shortest populations (Timor-Leste, Laos, Solomon Islands, and Papua New Guinea for boys; and Guatemala, Bangladesh, Nepal, and Timor-Leste for girls). In the same year, the difference between the highest mean BMI (in Pacific island countries, Kuwait, Bahrain, The Bahamas, Chile, the USA, and New Zealand for both boys and girls and in South Africa for girls) and lowest mean BMI (in India, Bangladesh, Timor-Leste, Ethiopia, and Chad for boys and girls; and in Japan and Romania for girls) was approximately 9-10 kg/m2. In some countries, children aged 5 years started with healthier height or BMI than the global median and, in some cases, as healthy as the best performing countries, but they became progressively less healthy compared with their comparators as they grew older by not growing as tall (eg, boys in Austria and Barbados, and girls in Belgium and Puerto Rico) or gaining too much weight for their height (eg, girls and boys in Kuwait, Bahrain, Fiji, Jamaica, and Mexico; and girls in South Africa and New Zealand). In other countries, growing children overtook the height of their comparators (eg, Latvia, Czech Republic, Morocco, and Iran) or curbed their weight gain (eg, Italy, France, and Croatia) in late childhood and adolescence. When changes in both height and BMI were considered, girls in South Korea, Vietnam, Saudi Arabia, Turkey, and some central Asian countries (eg, Armenia and Azerbaijan), and boys in central and western Europe (eg, Portugal, Denmark, Poland, and Montenegro) had the healthiest changes in anthropometric status over the past 3·5 decades because, compared with children and adolescents in other countries, they had a much larger gain in height than they did in BMI. The unhealthiest changes-gaining too little height, too much weight for their height compared with children in other countries, or both-occurred in many countries in sub-Saharan Africa, New Zealand, and the USA for boys and girls; in Malaysia and some Pacific island nations for boys; and in Mexico for girls.
Interpretation: The height and BMI trajectories over age and time of school-aged children and adolescents are highly variable across countries, which indicates heterogeneous nutritional quality and lifelong health advantages and risks.
Funding: Wellcome Trust, AstraZeneca Young Health Programme, EU.
Copyright © 2020 The Author(s). Published by Elsevier Ltd. This is an Open Access article under the CC BY 4.0 license. Published by Elsevier Ltd.. All rights reserved.
Figures


Comment in
-
Global growth trends in school-aged children and adolescents.Lancet. 2020 Nov 7;396(10261):1465-1467. doi: 10.1016/S0140-6736(20)32232-7. Lancet. 2020. PMID: 33160551 No abstract available.
References
-
- Georgiadis A, Penny ME. Child undernutrition: opportunities beyond the first 1000 days. Lancet Public Health. 2017;2:e399. - PubMed
-
- Alderman H, Behrman JR, Glewwe P, Fernald L, Walker S. Evidence of impact of interventions on growth and development during early and middle childhood. In: Bundy DAP, Silva N, Horton S, Jamison DT, Patton GC, editors. Child and adolescent health and development. The International Bank for Reconstruction and Development / The World Bank; Washington (DC): 2017. - PubMed
-
- Tanner JM. Growth as a mirror of the condition of society: secular trends and class distinctions. Acta Paediatr Jpn. 1987;29:96–103. - PubMed
-
- Strauss J, Thomas D. Health, nutrition, and economic development. J Econ Lit. 1998;36:766–817.
Publication types
MeSH terms
Grants and funding
- K43 TW010698/TW/FIC NIH HHS/United States
- MC_UP_A620_1015/MRC_/Medical Research Council/United Kingdom
- MC_U147585827/MRC_/Medical Research Council/United Kingdom
- MC_UU_12011/2/MRC_/Medical Research Council/United Kingdom
- G0901530/MRC_/Medical Research Council/United Kingdom
- MC_U147585819/MRC_/Medical Research Council/United Kingdom
- MC_UU_12011/3/MRC_/Medical Research Council/United Kingdom
- 101506/Z/13/Z/WT_/Wellcome Trust/United Kingdom
- MC_UU_00017/1/MRC_/Medical Research Council/United Kingdom
- MC_UU_00006/1/MRC_/Medical Research Council/United Kingdom
- MC_UU_12015/1/MRC_/Medical Research Council/United Kingdom
- MC_UP_A620_1014/MRC_/Medical Research Council/United Kingdom
- MC_UU_12011/1/MRC_/Medical Research Council/United Kingdom
- G0400519/MRC_/Medical Research Council/United Kingdom
- G0400491/MRC_/Medical Research Council/United Kingdom
- MC_UP_A620_1016/MRC_/Medical Research Council/United Kingdom
- MC_U147585824/MRC_/Medical Research Council/United Kingdom
- MR/S019669/1/MRC_/Medical Research Council/United Kingdom
LinkOut - more resources
Full Text Sources
Other Literature Sources
Medical
Miscellaneous
